Transcription
8 November 2021 6:46AM ESTGlobal Economics AnalystGS Macro Outlook 2022: The Long Road to Higher RatesnnAlthough the fastest pace of recovery now lies behind us, we expect strongglobal growth in coming quarters, thanks to continued medical improvements, aconsumption boost from pent-up saving, and inventory rebuilding. For 2022 as awhole, global GDP is likely to rise 4½%, more than 1pp above potential.Jan HatziusThe major DM economies should grow rapidly through midyear and thenmoderate gradually as the near-term impulses wane. In EM, we expectcomparatively sluggish performance in China, where the property market is likelyto soften further and macro policy looks set to ease only modestly, and in Brazil,where financial conditions have tightened sharply and a potentially messyelection looms. By contrast, we are more optimistic on India because ofsignificant catch-up potential and on Russia because of a boost from the oil andgas sector.Yulia ZhestkovanThe biggest surprise of 2021 has been the goods-led inflation surge. Thisrecently prompted us to pull forward our forecast for Fed liftoff by a full year toJuly 2022. Subsequently, we expect a funds rate hike every six months, arelatively gradual pace that assumes a normalization in goods prices and inoverall inflation (albeit later and more partial than we previously thought).nBy the time Fed hikes get underway, some advanced economies (including theUK and Canada) should be well into the interest rate normalization process, anda number of economies in Latin America and Eastern Europe may already beapproaching its end. By contrast, we think the ECB and RBA are still far awayfrom hiking rates, and markets seem to have overshot in their expectation of animminent hawkish turn.nBeyond the next few years, we expect nominal policy rates across most DMeconomies to rise well beyond the rock-bottom levels now priced in the bondmarket. For one thing, inflation should settle ½pp above the pre-pandemic levelon average, in part because central banks have tweaked their goals accordingly.Moreover, neutral real rates are more likely to rise than to fall, given increasedpolitical tolerance for budget deficits and climate-related investment needs. 1(212)902-0394 jan.hatzius@gs.comGoldman Sachs & Co. LLCDaan Struyven 1(212)357-4172 daan.struyven@gs.comGoldman Sachs & Co. LLC 1(646)446-3905 yulia.zhestkova@gs.comGoldman Sachs & Co. LLCSid Bhushan 44(20)7552-3779 sid.bhushan@gs.comGoldman Sachs InternationalDaniel Milo 1(212)357-4322 dan.milo@gs.comGoldman Sachs & Co. LLCInvestors should consider this report as only a single factor in making their investment decision. For Reg ACcertification and other important disclosures, see the Disclosure Appendix, or go towww.gs.com/research/hedge.html.
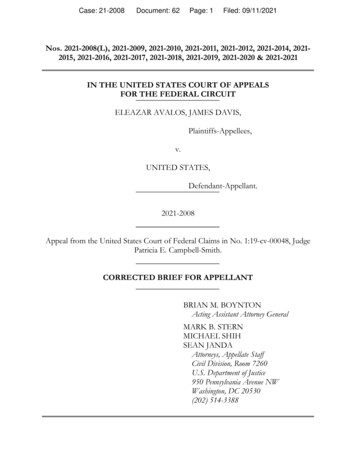
Goldman SachsGlobal Economics AnalystGS Macro Outlook 2022: The Long Road to Higher RatesGlobal growth in 2021 has broadly matched our above-consensus 6% prediction of ayear ago, as illustrated in Exhibit 1. In particular, the US, UK, Brazil, and Russia all camein well ahead of consensus forecasts. And even in the Euro area, where annual-averagegrowth looks to be on track for a consensus outcome, the back-loaded sequentialpattern means that the economy made up a lot of ground through the year.Exhibit 1: Global Growth in 2021 Matched Our Lofty ExpectationsPercent change, year ago1210GS Latest2021 GDP Growth ForecastsGS as of Nov. 2020Percent change, year ago1210Consensus as of Nov. 20208866442200WorldUSEuro Area JapanUKCanadaChinaIndiaBrazilRussiaSource: Bloomberg, Goldman Sachs Global Investment ResearchBy contrast, we did not anticipate the 2021 inflation surge. While we had built a positivebase effect from the exceptionally weak prints during the initial 2020 lockdown andsome upward pressure on prices in reopening service sectors into our forecast, wemissed the two most important inflation sources, namely the excess demand fordurable goods and the labor supply squeeze. Since we now expect both of theseinflation drivers to abate only gradually and partially, we have pulled forward our policyrate liftoff projections across most major economies, including the US where we arenow calling for the first funds rate hike in July 2022.8 November 20212
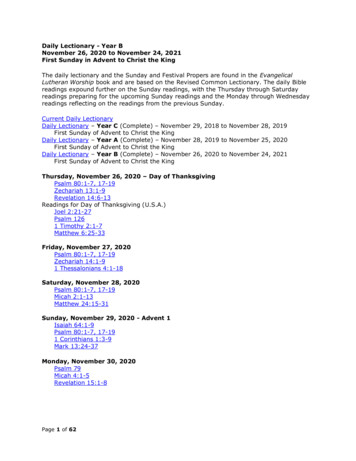
Goldman SachsGlobal Economics AnalystAnother Strong Year ComingAlthough the fastest pace of the recovery now lies behind us, global GDP is likely togrow 4½% in 2022 for the year as a whole, more than 1pp above potential (Exhibit 2).Especially in the advanced economies—with the exception of the Euro area where Q3was very strong—we expect a significant near-term acceleration that should extend wellinto 2022 (Exhibit 3).Exhibit 2: Another Strong Year Coming in 2022Real GDP Growth2021 (f)2022 (f)2023 (f)PotentialPercent Change yoy2020GS Consensus GS Consensus GS ConsensusGSUSEuro .04.54.53.43.63.1Note: All forecasts calculated on calendar year basis. 2021-2023 are GS forecasts. Potential growth estimates are for 2022, based onour supply-side model and exclude scarring. IMF forecasts used for India 2023 consensus when quarters not available in Bloomberg.Source: Bloomberg, IMF, Goldman Sachs Global Investment ResearchExhibit 3: The Major Advanced Economies Should Grow Strongly Through Midyear and Then ModerateGraduallyPercentage pointsPercentage points1010Quarter-Over-Quarter Annualized GS GDP Growth Forecasts Relative toPotential88Euro AreaJapan66US442200-2-2Q3Q42021Q1Q2Q3Q42022*We assume potential growth is 1.75% in the US, 1.1% in the Euro Area, and 1.0% in Japan.Source: Goldman Sachs Global Investment ResearchThe most important reason for optimism is that we expect further sizable medicalimprovements, illustrated in Exhibit 4. Although the virus will continue to ebb and flow,increasing global access to vaccinations, booster shots, and other medical8 November 20213
Goldman SachsGlobal Economics Analystimprovements should result in lower highs and lower lows on infections and, especially,on hospitalizations and deaths. From now until the end of 2022, we expect a 15ppincrease in the GDP-weighted global protection rate against infections andhospitalizations to 70% and 85%, respectively.1 Moreover, the new antiviral drugs fromPfizer and Merck—if approved and broadly distributed—should cut the risk of severeoutcomes sharply further.2 In turn, these medical improvements are likely to supportfurther recovery in sectors such as travel, entertainment, and office-adjacentconsumption.Exhibit 4: Further Medical ImprovementsGlobal* Effective Protection Rate 21*GDP weighted average of largest economies.Sep-21Mar-22Sep-22We calculate effective protection rates as the population share with some immunity from vaccination or prior infection, multiplied by the strength of theprotection against each outcome. See “Dan Milo, Daan Struyven, “How Immune is the World?”, Global Economics Comment, 24 September 2021.Source: Goldman Sachs Global Investment ResearchIn recent months, we have also become more optimistic about the impact of fiscalpolicy on growth. This is straightforward in the Euro area, where the likely Germancenter-left coalition looks set to spend more and the EU Recovery Fund will start fundinginvestment projects in greater size next year.3 But even in the US, the outlook is betterthan suggested by standard measures of the fiscal impulse.4 The fact that the USpersonal saving rate remains at 7.5% as of September—a month with strongconsumption and mostly without extended unemployment benefits—suggests thatconsumers have already largely absorbed the loss of government support without eithera meaningful cutback in spending or an undue decline in the saving rate. Moreover, itsuggests that the consumption boost from the 2.4trn stock in US pent-up savings isstill ahead of us, at least in aggregate. Combined with the passage of the bipartisan1We calculate this rate as the population share with some immunity from vaccination or prior infection,multiplied by the strength of the protection against each outcome2The Pfizer results were particularly strong. In the initial topline readout, the drug reduced hospitalizations by89% relative to the control group, and there were zero deaths in the treatment group versus seven (or 1.8%)in the control group.3See Alain Durré, Sören Radde, Filippo Taddei, “Persistent Fiscal Support for the European Recovery,”European Economics Analyst, 24 October 2021.48 November 2021See Daan Struyven, Dan Milo, “Fiscal Come, Fiscal Go”, Global Economics Analyst, 24 August 2021.4
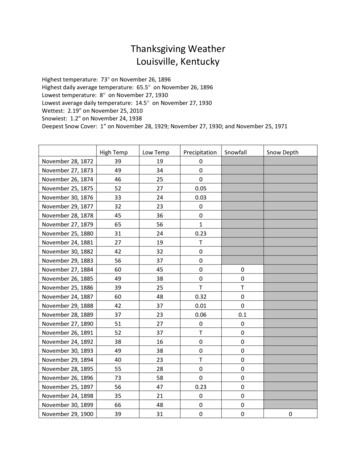
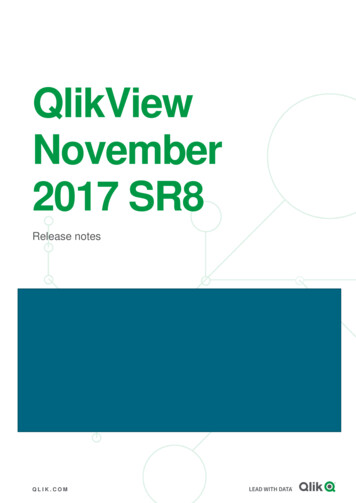
Goldman SachsGlobal Economics Analystinfrastructure bill on November 5—which we had assumed but which had been held upin intra-party Democratic wrangling—this has made us less concerned about a largenegative US fiscal impulse than we were a few months ago.Growth trends in the major emerging economies are likely to look more disparate, withrelative weakness—both relative to consensus and to the long-term trend—in China andBrazil, but strong performance in India and Russia.Our forecast of 4.8% growth in China next year is below consensus. The key driver ofthis muted outlook is a negative swing in the property sector growth impulse from anaverage of 1½pp in the last five pre-pandemic years to just above -1pp in 2022 andbeyond. This reflects the negative impact of deleveraging on construction, consumption,government spending, real estate services, and construction materials activity (Exhibit5, left panel).Exhibit 5: A Large Negative Swing in China’s Property Sector Impact on GrowthppChina: Housing Contribution to Annual GDP GrowthConstruction MaterialsReal Estate ionNew Apartments Needed Each Year in Urban China3 242Million24Demand Sources:Property 884411GS Forecast00-1-1-2 0-22011 2013 2015 2017 2019 2021 2023 2025 2027 2029 2031020102015202020252030203520402045*Demographic demand sources include urbanization, population growth, and household size growth.Source: Haver Analytics, Wind, Goldman Sachs Global Investment ResearchIn past cycles, Chinese policymakers would have reacted to such a slowdown viaaggressive macro stimulus, but the policy reaction function appears to be changing. Weexpect policymakers to stem major downside risks, but with an intent to “do justenough”—implying a broadly stable policy rate and an increase in the annual augmentedfiscal deficit by only 1pp next year. Policymakers appear to put a growing weight onobjectives other than near-term GDP growth, including income distribution, financialstability, and decarbonization. Combined with the demographic headwinds5, this shiftlies behind our forecast of a large, but gradual and managed slowdown in trend GDPgrowth to around 3¼% by 2032.Brazil is likely to underperform as well, with growth of just 0.8% in 2022, but thereasons are more short-term. Exhibit 6 shows that financial conditions have tightenedvery sharply, as the central bank has reacted to the large inflation overshoot with aseries of dramatic rate hikes and as worries about governability have increased ahead of5See Hui Shan, “Credit Supply Holds the Key to China Housing Outlook in 2022”, Asia Economics Analyst,11 October 2021.8 November 20215
Goldman SachsGlobal Economics Analysta potentially messy election next fall.Exhibit 6: Sharp FCI Tightening in Brazil; Room for Catch-Up Growth in IndiaBasis points400Change in GS Financial Conditions Index since Jan. 1 2020300Basis points400300Brazil% of Potential GDP5India GS Long-Run Output Gap% of Potential GDP500-5-5-10-10-15-15-20-20-25-25US200Banco Central doBrasil startstightening cyclewith 75bp 0May-20Sep-20Jan-21May-21Sep-21-200 -30Jan-07-30Jan-10Jan-13Jan-16Jan-19Source: Goldman Sachs Global Investment ResearchWe are considerably more optimistic on India and Russia. We expect India growth topick up from 8% in 2021 to 9.1% in 2022 given its significant catch-up potentialfollowing the hit from the Delta wave (Exhibit 6, right panel). In Russia, oil production islikely to rise back to pre-covid levels as the OPEC caps are removed, and the increase inprices has led to an improvement in the terms of trade to multi-year highs.8 November 20216
Goldman SachsGlobal Economics AnalystHigher Inflation, Earlier LiftoffThe biggest surprise of 2021 has been the global inflation surge, visible not only in EMeconomies that have a history of these bouts but also in the G10 (see Exhibit 7).Exhibit 7: Inflation Has Been Much Higher Than Expected in Most G10 Economies2021Q4 GS Core Inflation Forecasts: G10% Change, year ago% Change, year ago55Latest4As of Nov. 2020433221100NewZealandUSUKEuro Area Australia CanadaSweden Switzer landJapanNorwayCore inflation is PCE ex food and energy in the US; HICP ex food, energy, alcohol and tobacco in the Euro area; CPI ex freshfood in Japan; CPI ex food,energy, alcohol and tobacco in the UK; the average of common, median and trimmed mean inflation (BoC preferred) in Canada; trimmed mean (30%) inAustralia; CPI ex food, energy and fuel in New Zealand; CPI adjusted for tax changes and ex energy products in Norway; CPI with fixed interest rate exenergy in Sweden; CPI ex fresh and seasonal products, energy and fuel in Switzerland.Source: Goldman Sachs Global Investment ResearchHigher-than-expected US inflation recently prompted us to pull forward our forecast forFed liftoff by a full year to July 2022. We now expect core PCE inflation to remain above3%—and core CPI inflation above 4%—when the QE taper concludes, which wouldmake a seamless move from tapering to rate hikes the path of least resistance. Afterliftoff, we see a second hike in November 2022 and two hikes per year after that.The key to this gradual pace is a partial moderation in goods prices and in overallinflation, driven by a combination of slowing demand and rising supply. On the demandside, we expect spending on goods to moderate as US government income supportnormalizes and service activity rebounds. Although US real goods consumption remainsnearly 10% above trend, this already represents a decline of 5% since the peak inMarch when households received stimulus checks, and the adjustment likely has furtherto go (Exhibit 8).8 November 20217
Goldman SachsGlobal Economics AnalystExhibit 8: Moderating US Goods Demand Should Lower US Goods InflationDec 2019 100USCL10USAggregate OECD without USTrend US (2012Q1 - 2019Q4)Trend OECD without US (2012Q1 - 2019Q4)12098Goods Prices in Sep 2021,% Change from Jan 2020Real Goods Expenditure2019Q4 100OECD Countries11ISNO7EECZ6CALV3KRSE GBITATIE11001009090DKFR2110NLDE4110y .39x 3.66R 2 .90NZ5120FIJP0-8-6-4-20246810121416Real Goods Expenditure Gap in 2021Q2from Trend (%)8020168020172018201920202021Trend is estimated using observations from 2012Q1 till 2019Q4. Both bubble sizes and regression weights are proportional to GDP.Source: OECD, Goldman Sachs Global Investment ResearchOn the supply side, we are particularly focused on a rebound in semiconductorproduction (and therefore cars) because of post-Delta factory restarts in South East Asia(2021Q4), and eventually by expanded production capacity (2022H2 and 2023).6 Bothincreased protection against infections and less stringent policies in Asia should reducethe threat to supply chains from renewed plant and port shutdowns (Exhibit 9). Besides,we expect a partial normalization of labor supply on the back of reduced covid concernsand reduced benefits, especially in the US where the participation rate remains wellbelow its longer-term trend.7Exhibit 9: Diminishing Risk of New Covid-Driven Shocks From Asia to Global Goods SupplyQ1Q22020Q3Q4Risk of Factory/Port aSingaporePhilippinesMalaysiaThailandSouth KoreaTaiwanRed high; orange moderate; green low.We classify the quarterly risk of factory/port closures for each economy based on i) stringency of government policy (to gauge the risk of governmentimposed closures) and ii) the level of protection against infections (to gauge the risk of closures caused by worker illness). For economies and quarterswhere we believe factories/ports will be closed by policy if there are high cases in the locality, we classify them as having a high risk of closure if theirinfection protection rate is less than 75% and a medium risk otherwise. For economies and quarters where some factories/ports may be closed by policy(perhaps region dependent) if there are high cases in the locality, we classify them as having a high risk of closure if their infection protection rate is lessthan 65% and a medium risk otherwise. For economies and quarters where factories/ports would not close just because there are high cases in thelocality, we classify them as having a high risk of closure if their infection protection rate is less than 35%, a medium risk if it is in between 35% and55%, and low risk otherwise.Source: Goldman Sachs Global Investment Research6See Spencer Hill, “Track My Package: A Roadmap for Supply Chain Normalization”, US Economics Analyst,26 October 2021.78 November 2021See Joseph Briggs, “Will Worker Shortages Be Short-Lived?”, US Economics Analyst, 4 October 2021.8
Goldman SachsGlobal Economics AnalystCentral Bank Leaders and LaggardsBy the time Fed hikes get underway, several DM central banks should already be wellinto the normalization process, with rate increases from the pandemic low of 150bp inNew Zealand, 75bp in Canada, and 40bp in the UK. We expect the BoC to hike fourtimes in 2022 starting with liftoff in January given its limited tolerance for very highinflation and an impressive jobs recovery. Although the BoE’s hold in November was asurprise, major bottlenecks and high inflation are likely to prompt a 15bp first rate hikesoon (most likely in December), followed by 25bp hikes in May and November 2022.The normalization process is already much more advanced in several Latin America andEastern Europe economies, where inflation has been very high. In Brazil, we expectanother 150bp hike to 9.25% in December and a terminal rate of 11.0% in 2022Q1,followed by cuts in 2023. In Russia, we expect a final 25bp rate hike in December, withrate cuts starting in 2022H2.Exhibit 10: Early Normalization in the UK, Canada, Norway, and New Zealand; An Earlier End to Normalization in Brazil and RussiaPolicy RatePercent2.5CanadaNew ZealandNorwayUK2.0Policy RatePercent Percent2.5 0.50.50.00.0Q1 Q2 Q3 Q4 Q1 Q2 Q3 Q4 Q1 Q2 Q3 Q4 Q1 Q2 Q3 Q4 Q1 Q2 Q3 Q42019202020212022202300Q1 Q2 Q3 Q4 Q1 Q2 Q3 Q4 Q1 Q2 Q3 Q4 Q1 Q2 Q3 Q4 Q1 Q2 Q3 Q420192020202120222023Source: Goldman Sachs Global Investment ResearchBy contrast, some DM central banks are likely to be far behind the Fed in lifting rates. Inparticular, we think markets have overshot significantly in their expectation of animminent hawkish turn at the European Central Bank and the Reserve Bank of Australia.We expect the policy rate to stay on hold until 2024Q3 in the Euro area and until2023Q4 in Australia (Exhibit 11, left panel).8 November 20219
Goldman SachsGlobal Economics AnalystExhibit 11: ECB and RBA Liftoff Is Further Away Than Markets ExpectTime to First Rate HikeMonthsExpected Change to Policy Rate by End of 2023bp35250Dot below 45 degree line:GS more dovish than market30Dot below 45 degree line:GS more dovish than market200BoCGS Baseline ForecastMarket25RBNZ15020RiksbankECB15Norges 101520GS Baseline Forecast253035ECB0050100150200bp250MarketSource: Bloomberg, Goldman Sachs Global Investment ResearchThe main reason for our dovish ECB and RBA calls is that underlying wage and inflationpressures are more muted than elsewhere. Our wage trackers are still soft in both theEuro area, where significant long-run excess capacity remains8, and in Australia, wherethe RBA wants wage growth of at least 3% before lifting off (Exhibit 12). We expectEuro area core inflation to peak right around now, fall back to 1.2% in December 2022 asinflationary distortions—such as the German VAT hike and this year’s HICP weightchanges—drop out, and then rise only gradually to 1.7% as long-run slack is absorbed inlate 2024. In Australia, we expect trimmed inflation—the relatively stable measuretargeted by the RBA—to rise only gradually, and meet the RBA’s criterion of “beingsustainably within the 2% to 3% target range” in 2023.8We estimate substantial amount of excess slack, with a 2021Q3 long-run output gap of -5% for the Euroarea average, and even -10% for Spain. See, Daan Struyven, Sid Bhushan, Dan Milo, Yulia Zhestkova, JanHatzius, “Tight Now, Slack Later”, Global Economics Analyst, 15 October 2021.8 November 202110
Goldman SachsGlobal Economics AnalystExhibit 12: Softer Wage Growth in the Euro Area and Australia% Change, year ago% Change, year agoGS Wage Trackers6565USEuro AreaAustralia44332211020070200920112013Note: grey bars denote US recessions.2015201720192021Source: Goldman Sachs Global Investment ResearchA Long Way From Nominal NeutralBeyond the next few years, we expect nominal policy rates across most DM economiesto rise well beyond the rock-bottom levels now priced in the bond market, as illustratedin Exhibit 13. Assuming another long expansion, we forecast peak nominal policy ratesof around 2¾% in both Canada (reached in 2025) and the US (2026), 2½% in Australia(2026), 1¾% in the UK (2025), and 1¼% in the Euro area (2027).Exhibit 13: Policy Rates Likely to Rise By More Than Priced in Markets (Eventually)US Fed Funds Rate%3.0Euro Area Deposit Rate%%3.0 1.5GS Baseline2.5%1.5GS Baseline2.5Market Pricing1.01.0Market PricingBloomberg Consensus2.02.01.51.51.01.00.50.5Bloomberg Consensus0.50.50.00.0-0.5-0.50.0 02018201920202021202220232024202520262027Source: Bloomberg, Goldman Sachs Global Investment ResearchThere are two reasons to expect higher policy rates than markets are pricing. First,across the G10 economies, we expect inflation to settle ½pp above the pre-pandemiclevel on average, as shown in Exhibit 14. In the US, our forecast for core PCE inflation in2024 is 2.2%, 0.6pp above the 2015-2019 average. In the Euro area, we have raised our8 November 202111
Goldman SachsGlobal Economics Analystforecast for core HICP inflation in 2024Q4 to 1.7%, 0.7pp above the 2015-2019 average.In part, these forecasts reflect the recent changes in policy frameworks at the Fed andthe ECB. But they also incorporate observable factors that we expect to mostly persist,including tightness in the housing and energy markets, increased measures of long-runinflation expectations, and increased US wage pressure.Exhibit 14: G10 Inflation Should Settle ½pp Above the Pre-Pandemic Level on AverageAustraliaCore Inflation, 2024 Q4 GS Forecast(% Change, Year Ago)2.5USNew Zealand2.0Average nCanadaNorwayUK 0.55ppDot above 45 degree line:2024Q4 inflation higher than 2015-20190.50.00.00.51.01.5Core Inflation, 2015-2019 Average (% Change, Year Ago)2.02.5Core inflation is PCE ex food and energy in the US; HICP ex food, energy, alcohol and tobacco in the Euro area; CPI ex freshfood in Japan; CPI ex food,energy, alcohol and tobacco in the UK; the average of common, median and trimmed mean inflation (BoC preferred) in Canada; trimmed mean (30%) inAustralia; CPI ex food, energy and fuel in New Zealand; CPI adjusted for tax changes and ex energy products in Norway; CPI with fixed interest rate exenergy in Sweden; CPI ex fresh and seasonal products, energy and fuel in Switzerland.Source: Goldman Sachs Global Investment ResearchSecond, neutral real short-term interest rates (r*) are more likely to rise than to fall overtime. Statistically, we have found that in low and stable inflation environments over thepostwar period, real policy rates averaged about 1% over the cycle, albeit with a greatdeal of variability.9 The post-Volcker period was an outlier to the high side, while thepost-GFC period was an outlier to the low side, as shown in Exhibit 15.9See, Jan Hatzius, Daan Struyven, “Later but Steeper in the Post-Pandemic Economy”, Global EconomicsAnalyst, 31 May 2021.8 November 202112
Goldman SachsGlobal Economics AnalystExhibit 15: The Real Short-Term Rate Has Averaged Around 1% When Inflation Is Low%%Average Real Short-Term Interest Rate In Low Inflation Episodes*8787Overall AverageNon-US Country AverageUS-Average665544AverageInflation 4%in AllEconomies32132100-1-1-21950-21960War Recovery1950-19601970Vietnam War1961-197219801990Oil rage inflation between 0% and 4%.20002010Globalization Financial Crisisand After2000-20072008-2017Source: Goldman Sachs Global Investment ResearchMore fundamentally, our savings-investment framework suggests that increasedpolitical tolerance for budget deficits and the investment needs associated with theclimate transition could together boost r* by around 50bp relative to the post-GFC cycle.This estimate relies on our forecast of a 1¼% of global GDP increase in governmentdeficits relative to the pre-pandemic norms, the estimate of a 1¼% of global GDPincrease in green investments needed to achieve net zero, and estimates from theacademic literature on the effect of government deficits and investment on r* (Exhibit16).Exhibit 16: A Boost to r* From Larger Budget Deficits and Green Investments% of GDPGovernment Deficit% of GDP6Long-Term Pre-2020Expansion Average52022-2025 Average(GS Forecast)4% of GDP6 2.05Incremental Annual Green Investment% of GDP2.01.51.51.01.00.50.5433221100.0Global, 2021-2050 China, 2019-2050 Global, bleTransitionsEnergy Agency)Energy Agency)Commission)Average0.00US (Federal)WorldFor the expansion averages, we include 1992-2000, 2002-2007, and 2012-2019 in the US, and 2005-2007 and 2012-2019 globally.Source: IREA, IEA, Energy Transition Commission, Goldman Sachs Global Investment Research8 November 202113
Goldman SachsGlobal Economics AnalystFrom Pandemic Risks to Inflation RisksOur baseline forecast is that the global economy gradually transitions from a highlyunusual pandemic recovery to a more normal expansion starting in 2022. During thistransition, demand slows while supply rises, growth shifts from very rapid to merelysolid, activity rebalances from goods (and in China housing) to services, and inflationmoderates. Monetary policy shifts from highly accommodative to slightly more normal,although the normalization speed varies greatly by economy.Despite all this, we are unlikely to revert fully to the pre-pandemic macroeconomy. Newmonetary policy frameworks, more ambitious fiscal policy, green investments, andhealthier household balance sheets all point to stronger aggregate demand for a longerperiod. Stronger demand, especially for investment, along with the uptick in inflationexpectations due to the pandemic inflation shock, suggest that we are on a long road tohigher nominal interest rates relative to the post-GFC world.What is the biggest risk to this generally constructive outlook? Throughout the periodsince March 2020, the answer would have been a renewed deterioration of thepandemic, especially from new and more transmissible variants. While this may still bethe right answer in the near term as the Northern Hemisphere winter approaches, it isno longer as clear thereafter given the dramatic recent medical advances, including theexperimental oral antivirals from Pfizer and Merck. Admittedly, better treatments couldundercut to some degree the incentive to get vaccinated among the hesitant. But themore important factor is probably a reduction in fear among the vast majority of thepopulation that is either already vaccinated or has no desire to get vaccinated under anycircumstances, and consequently higher economic activity even when there is anoutbreak.This means that the biggest risk to the global economy may no longer be a reneweddownturn because of fresh virus outbreaks, but may now be higher inflation because oftight goods supplies and excessive wage pressure. Although we expect a significantpart of the goods supply squeeze to abate over the next year, at present the stress onsupply chains is substantial and inventories in semiconductors, durable goods, andenergy markets are very low. In such an environment, even a moderate productionoutage resulting from covid outbreaks in China, an energy demand spike related to acold winter, or other short-term disruptions could have sizable economic effects.The wage issue is potentially longer-lasting because it might involve a change in socialnorms whereby workers—many of whom have a greater financial cushion than in pastcycles—demand more from their jobs not only in terms of compensation but alsoworking conditions and personal fulfillment. While many observers might view such achange in the mindset of the workforce as understandable and perhaps even overdue, itcould imply a significantly longer and more pronounced period of upward wagepressures—after all, essential roles need to be filled and if there aren’t enough peoplewho want to fill them at the prevailing wage, then the prevailing wage needs to rise.In turn, upside inflation surprises would likely result in a bigger monetary tighteningfrom the world’s major central banks, first and foremost the Federal Reserve. This is adownside risk to the growth outlook especially in EM economies, which often prove to8 November 202114
Exhibit 1: Global Growth in 2021 Matched Our Lofty Expectations . 0 2 4 6 8 10 12 0 2 4 6 8 10 12 World US Euro Area Japan UK Canada China India Brazil Russia 2021 GDP Growth Forecasts GS Latest GS as of Nov. 2020 Consensus as of Nov. 2020 Percent change, year ago Percent change, year ago. Source: Bloomberg, Goldman Sachs Global Investment .