Transcription
Developing Production Practices for Efficient Fertilizer & Irrigation Use in Vegetable Crops(fourth quarterly and final project progress report 2-27-2007 through 14-6-2007)FDACS# 11275Report Submitted to Florida Department of Agriculture and Consumer ServicePrincipal Investigator: Johan Scholberg, Univ. of Florida Agronomy Department,304 Newell Hall, PO Box 110500, Gainesville FL32611-0500, Tel: (352) 392-1811jmscholberg@ifas.ufl.eduCo-PI Michael Dukes and Rafael Muñoz-Carpena, UF Agric. & Biol. Engin. Dept.120 Fraziers-Rogers Hall PO Box 110570, Gainesville, FL 32611-0570Research coordinator: Lincoln Zotarelli, UF Agric. & Biol. Engin. Dept.120 Fraziers-Rogers Hall PO Box 110570, Gainesville, FL 32611-0570Summary:This report provides an update on research activities from a comprehensive research programthat aims to evaluate the interactive effects of irrigation and N-fertilizer management practiceson yield, fertilizer/water use efficiency, and potential N leaching. During the spring of 2007 wecompleted the labeled isotopes (15N) fertilizer uptake trial for sweet corn which was conductedduring the spring and summer of 2006. Results showed that initial fertilizer uptake efficiency islow and that use of either ammonium-based and/or slow release fertilizers may be preferableduring initial growth. We also implemented two additional field trials for sweet pepper andtomato during the spring of 2007 to confirm previous research findings. Results from thesestudies confirm our previous findings that use of sensor based systems results in substantial (40100%) reduction in irrigation requirements, while potential nitrate leaching underneathproduction beds during the production season is reduced by 75-80% as well. Based on theseresults we conclude that use of these production techniques will result in much more efficientwater and fertilizer use. We would therefore like to propose to test these technologies on a largerfield scale in collaboration with commercial growers during a next project phase.
IntroductionUrban and agricultural water use restriction has recently been approved for South Florida regiondue to the lack of rainfall during the last few months. As a result, South Florida residents mustcut water use by up to 30%, while farmers in that area must cut water use by 45%. Agriculturalwater use is still the largest single category of water use in Florida, and farmers are being forcedto become more efficient with their use of irrigation water.Improved irrigation scheduling is one potential method to increase irrigation water useefficiency. It has been shown that irrigation water use efficiency for vegetable crop productioncan be improved through better irrigation management. The use of frequent but low waterapplication volumes has proven superior to the more traditional scheduling of few applications ofa large irrigation volumes (Locascio, 2005). However, such approach is labor intensive and/ortechnically difficult to employ. The use of automated irrigation systems, which make use of soilmoisture sensing devices may greatly facilitate the successful employment of low volume-highfrequency irrigation systems for commercial vegetable crops (Muñoz-Carpena et al., 2005).Soil moisture sensors configured to provide feedback within an irrigation control systemhave been shown to reduce water use for tomato production in South Florida by as much as 70%(Muñoz-Carpena et al., 2005) and on green bell pepper as much as 50% (Dukes et al., 2003) withminimal or no impact on vegetable yields.The technology being tested in this project includes commercially available controllersthat have been marketed for irrigation control but have not been tested under Florida conditionsfor vegetable crops. However, these controllers have been shown to save significant amounts ofirrigation water on turfgrass with respect to time irrigation schedules (Cardenas-Lailhacar et al.,2005). This program thus aims to develop more efficient irrigation practices and to evaluate theinteractive effects of irrigation management on crop nitrogen requirements of pepper and tomato.The program also evaluated and improved methods for monitoring crop N status and N leachingfor commercial Florida vegetable production systems.
Two field experiments were implemented during the spring of 2007 to confirm previousresearch findings and to determine the effects of water and nitrogen application rates on nitrogenleaching, crop nitrogen uptake, tomato growth and yield. This project has allowed for criticaltechnological innovations and generated a comprehensive knowledge base that could be used fordevelopment of improved production guidelines, Best Management Practices (BMPs),calibration and verification of computer models, and innovative in-season irrigation and nutrientmanagement tools for Florida vegetable crops.Project Objectives:The overall objectives of this program are to: 1) Develop irrigation systems/practices that willreduce nitrogen leaching; 2) Determine the interactive effects of irrigation practices and fertilizerrates on yield, fertilizer use efficiency, and N-leaching; 3) Quantify when and how much waterand nutrients are taken up vegetable crops; 4) Determine rooting and irrigation patterns andcombine this information to develop improved irrigation guidelines; 5) Provide information onimproved integration of cover crops in vegetable cropping systems to improve soil nutrientretention; 6) Develop a scientific basis for developing management tools for improved irrigationand in-season crop nutrient status assessment and outline their appropriate use; 7) Integrateresearch results into BMPs and future computer-based in-season management tools for vegetablecrops.Research findings and project deliverablesI) Bell Pepper irrigation management x N rate studyExperimental conditions and treatmentsThe planning phase of this project started in January 2007 with the design of the field trial. Theexperiment was conducted at the University of Florida Plant Science Research and EducationCenter (PSREU) near Citra, Florida in Marion County and the experimental irrigation treatmentswere established according to Table 1. The experimental design consisted of a complete factorialincluding five irrigation treatments ranging from sensor based control systems to time-based andthree N-rates. Treatments were replicated four times in a complete randomized block design.
Table 1. Experimental treatment codes and description for pepper.TreatmentThreshold (VWC[z])DescriptionI18%Acclima RS500, 5 daily watering windowsI210%Acclima RS500, 5 daily watering windowsI313%Acclima RS500, 5 daily watering windowsI410%Acclima RS500, 5 daily watering windows “Twin drip lines”I5N/AFixed time irrigation, one event each day (2 hours)[z]Volumetric water contentIrrigation treatmentsThe experimental design consisted of a complete factorial including five irrigation treatmentsranging from sensor based control systems to time-based and three N-rates. Treatments werereplicated four times in a complete randomized block design.Irrigation was applied via drip tape (Turbulent Twin Wall, 0.20 m (8 inch) emitterspacing, 0.25 mm (1 inch) thickness, 3.8 L hr-1 (1gph) at 69 kPa (10 psi), Chapin Watermatics,NY). Water applied by irrigation and/or fertigation was recorded by positive displacementflowmeters (V100 16 mm (5/8 inch) diameter bore with pulse output, AMCO Water MeteringSystems, Inc., Ocala, FL). Weekly manual meter measurements were manually recorded anddata from transducers that signaled a switch closure every 18.9 L (5 gal) were collectedcontinuously by data loggers (HOBO event logger, Onset Computer Corp., Inc., Bourne, MA)connected to each flow meter. Pressure was regulated by inline pressure regulators to maintainan average pressure in the field of 69 kPa (10 psi) during irrigation events.The irrigation treatments were regulated by the commercial RS500 soil moisture sensor(SMS) controller manufactured by Acclima, Inc. (Meridian, ID) for I1-I3 and an AcclimaCS3500 for I4. The RS500 unit controls irrigation application by bypassing timed events if soilmoisture was at or above a preset threshold of 8-12% volumetric water content (VWC)depending on irrigation treatment (Table 1). The CS3500 controls irrigation by maintaining soilmoisture content within a user specified range of low to high and a time clock is not necessary.
For all soil moisture sensor controllers, a sensor was installed at a 30 degree angle between twoplants and the sensor measured the soil moisture in the upper 0 to 0.2 m of the bed. Timedirrigation windows were specified as five possible events per day, starting at 8:00 am, 10:00 am,12:00 pm, 2:00 pm, and 4:00 pm for 24 minutes each (2 hr/day total). As a reference treatment, atime-based irrigation treatment was set for one fixed 2 hr irrigation event per day.Nitrogen treatmentsWeekly N-fertilizer applications rates were designated as N0.8, N1.0, and N1.5 of IFAS Nrecommendation rate, which corresponded to 166; 208 and 312 kg ha-1 of NO3-N, respectively(Fig. 1). All nutrients (except for P and micro nutrients) were applied via injection in theirrigation system (fertigation). Fertilizer sources used were calcium nitrate (N), potassiumchloride (K) and magnesium sulfate (Mg and S). Additional fertilizer was applied beforetransplanting: 40 kg N ha-1; 134 kg P2O5 ha-1 and 100 kg K2O ha-1 pre-plant fertilizer wasincorporated into the beds. On tomatoes, it was applied 134 kg P2O5 ha-1 and 100 kg K2O ha-1pre-plant fertilizer incorporated into the beds.Weekly Fertigation350N0.8N1.0N1.530Nitrogen (kg ha-1)Cumulative Fertigation25300250200201501510010504/10Nitrogen (kg ha-1)3550005/0105/2205/0106/1207/03 04/10Days after transplanting05/2206/1207/03Figure 1. Weekly and cumulative N application (fertigation) for pepper and tomato plots, spring 2007.After the initial establishment period and irrigation implementation, sensor treatments were initiated (13DAT). During the establishment period, about 5-6 mm day-1 was applied to all treatments, which makes
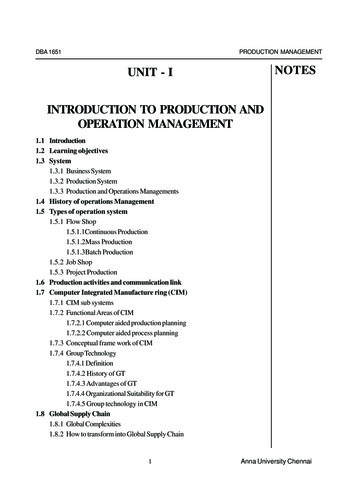
the N-fertilizer vulnerable to leaching. In order to increase the N-fertilizer availability to the pepper andtomato plants, the same N-rate has been applied rate was applied twice a week, on Tuesdays andFridays. After the irrigation treatments started, the entire fertilizer rate has been applied at once, onTuesdays.Plant growth, yield and water use efficiencyFor harvest measurements, an area of 10.5 m (34.4 ft) in central region within each plot will besampled. Number and weight of fruits per grading class were recorded for individual plots.Pepper fruits were graded into culls, U.S. Number 2 (medium), U.S. Number 1 (large), andFancy (extra-large) according to USDA (1997) standards. Marketable weight was calculated astotal harvested weight minus culls. Irrigation water use efficiency (WUE) expressed in kg offruits m-3 of irrigation was calculated by the quotient of marketable yields (kg ha-1) and the totalseasonal irrigation applied (m3 ha-1). Total biomass will be sampled between 60-70 days aftertransplanting for each crop, these results will be used to calculate the fertilizer use efficiency.Monitoring soil water and N leachingThe volumetric water content in the top 15 cm of each plot was monitored by coupling timedomain reflectometry (TDR) probes (CS-615, Campbell Scientific, Inc. Logan, Utah) with adatalogger (CR-10X, Campbell Scientific, Inc., Logan, Utah). Average volumetric water contentwas calculated for each treatment from measurements taken across all replicates.Soil samples (0-30, 30-60, and 60-90 cm) soil depths were collected at 42 and 63 daysafter transplanting. A detailed soil sampling will be performed previous a fertigation event, 1, 3and 7 days after fertigation event. After soil extraction samples were analyzed for NO3-N.Drainage lysimeters were installed 0.75 m below the surface of the bed prior to the bedformation (Fig. 2). Leachate extraction via a vacuum pumping system occurred weekly, one daybefore each fertigation event. Total leachate volume was determined gravimetrically, andsubsamples collected from each bottle were analyzed for NO3-N so that total N loading ratescould be calculated. Soil solution and soil core extracts were stored at –18 ºC until nitrate andnitrite analysis. Samples were analyzed using an air-segmented automated spectrophotometer
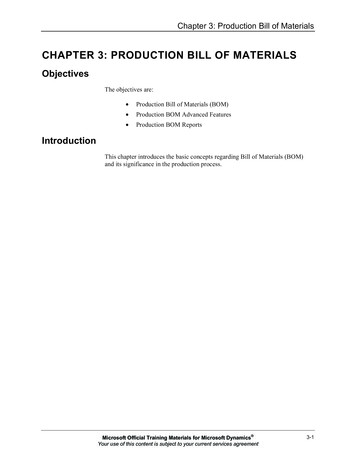
(Flow Solution IV, OI Analytical, College Station, TX) coupled with a Cd reduction approach(modified US EPA Method 353.2).Statistical analysesStatistical analyses were performed using PROC GLM of SAS (SAS Inst. Inc., 1996) todetermine treatment effects. When the F value was significant, a multiple means comparison wasperformed using Duncan Multiple Range Test at a P value of 0.05.Field implementation and initial research findingsPreparation of the field site began during the middle of January 1007 (Fig. 3) with tilling thefield several times and leveling and smoothing the surface (Fig. 4). The beds were formed onMarch 22 and pre-plant fertilizer was incorporated into the beds. Fumigation, drip tape, and plasticmulch were applied in a single pass on just after bed formation (Fig. 4AB). The fumigant used was 80%methyl bromide and 20% chloropicrin by weight as planned. Approximately forty-five day old pepperplants (Capsicum annuum, ‘Brigadier’) were transplanted by hand on April 10. Bell peppers wereplanted in twin staggered rows approximately 0.1 m to either side of the drip lines at 0.3 m within rowspacing for a plant population of 35,879 plants ha-1. Four replicates were established in a randomizedcomplete block design. Fixed irrigation of one hour each day was applied to the transplants until April23, 13 days after transplanting (DAT) and Fig 5 shows the experimental irrigation control center.Irrigation treatments were implemented by activating the soil moisture controllers (Fig. 6), installing soilmoisture probes (Fig. 7), and setting the irrigation time clock according to Table 1.Weather data and soil moisture monitoringA weather station within 500 m of the experimental site was used to provide temperature, relativehumidity, solar radiation, and wind speed data which will be used to calculate referenceevapotranspiration (ETo) according to FAO-56 (Allen et al., 1998). Crop evapotranspiration (ETc) wascalculated based on the product of ETo and crop coefficient (Kc) for a given growth stage (Simonne etal., 2004) reduced 30% for plastic mulched vegetable production (Amayreh and Al-Abed, 2005).
1.8 m0.95 mRaised bedDrip0.32 m0.55 m0.75 m 0.27 mDrainagelysimeterRaised bed0.85 mDrainage Lysimeter0.95DripTapePump at35-40 kPaBottle20-LDrainage LysimeterFigure 2. Overview of drainage lysimeter details.
Figure 3. Bell pepper 2007 experimental area after tillage (3/22/07).AFigure 4. A) Soil bed preparation (rototill) and B) soil fumigation and plastic mulching.B
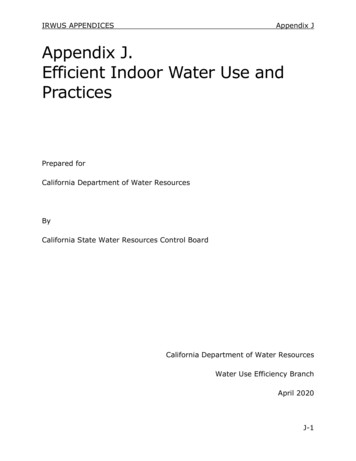
ABFigure 5. A) Experimental irrigation monitoring manifold showing flow meters, solenoid valves, andpressure regulation B) Acclima RS500 soil moisture controller.TDRprobesAcclimaSoil MoistureSensorAcclimaSoil MoistureSensorFigure 6. TDR probes and Acclima soil moisture sensor installation (4/20/07).
AcclimaSoil MoistureSensorTDRprobesFigure 7. Campbell Scientific CS616 TDR probe distribution related to the Acclima RS500 soilmoisture probe at raised bed with green bell pepper (4/20/07).
Pepper FieldDrainage LysimetersTDR probeTDR probeQIC SMSprobeFigure 8. Overview of tomato and pepper experiment, detail of QIC SMS and TDR probe location,drainage lysimeters. (5/1/07).Time domain reflectometry (TDR) probes were also installed to provide an independentmeasurement of soil moisture content in the root zone. They were installed approximately 7-8 cm fromthe drip line in between two plants and they were inserted at an angle to measure moisture content in thetop 15 cm of the bed. In addition, TDR probes were also installed vertically to monitor the soil moisturecontent at 15 to 45 cm depth layer. Probe readings were measured at 5 minutes intervals and average
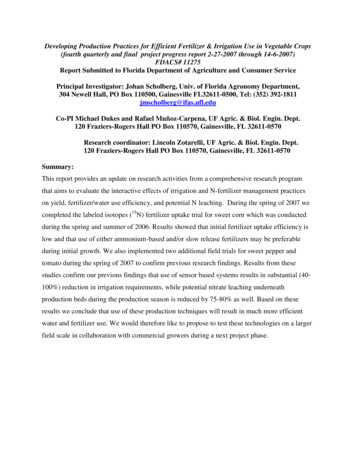
output for 15 minutes intervals were recorded via data loggers. The area close to the Acclima sensor wasalso monitored by a set of four probes which was installed around the Acclima sensor (Fig. 7).Field observationsSpecial attention was given to the installation and monitoring of soil moisture sensors in thefield in order to avoid similar problems that occurred during the spring season 2006 whenmalfunctioning of the irrigation controller systems resulted in over irrigation in the pepperplots. The cumulative irrigation for peppers is shown in Fig. 9. During the spring season all theinitial technical problems with sensor settings and placements that occurred during theprevious spring were addressed. The soil moisture sensors did a good job maintaining soilmoisture at target values and bypassing irrigation events and reducing water application forlower threshold settings (e.g. I1 and I2). After the initial crop establishment period, thecumulative irrigation depths that were applied were: 90; 114; 179; 229 and 221 mm for I1, I2, I3,I4 and I5, respectively. The leaching patterns followed the same trend as that for irrigation.The volume of irrigation collected in the drainage lysimeters until early June was: 19; 23 and 29mm, for I2, I3 and I5, respectively (Fig. 10)Current StatusMonitoring of the project is ongoing and leachate samples are currently being analyzed. At the time atwhich the report was completed the final harvest was not yet completed (First harvest will occur on June18th) so this report outlines preliminary leaching results only. Overall system performance of theirrigation system is superior to that in previous years although overall pepper yields may be lowercompared to the fall season which is consistent with findings for previous years.
Pepper Irrigation - Spring 2007350I1 - Acclima 8%I2 - Acclima 10%I3 - Acclima 13%I4 - Acclima 10% "twin lines"I5 - Time Fixed300Irrigation (mm)250200150100 1505/2205/2906/0506/12Date (day after tranplanting)Figure 9. Cumulative irrigation on pepper plots, spring 2007.Pepper - Spring 2007 - Volume Percolated40Volume percolated (mm)I2 - Acclima 10%I3 - Acclima 13%I5 - Time 2906/05Date (after transplanting)Figure 10. Cumulative volume percolated and captured on drainage lysimeters on pepper plots, spring2007.
II) Tomato irrigation management x N rate study (spring 2006)Experimental conditions and treatmentsThe planning phase of this project started in January 2007 with the design of the field trial. Theexperiment was conducted at the University of Florida Plant Science Research and EducationCenter (PSREU) near Citra, Florida in Marion County and the experimental irrigation treatmentswere established according to Table 2. The experimental design consisted of a complete factorialincluding five irrigation treatments ranging from sensor based control systems to time-based andthree N-rates. Treatments were replicated four times in a complete randomized block design.Table 2. Experimental treatment codes and description for %I4I5N/AN/ADescriptionQIC-based control system for a maximum 5 irrigation windows per day,irrigation drip positioned 0.15cm below soil surface, and fertigation drip on thesoil surface.QIC-based control system for a maximum of 5 irrigation windows per day,Irrigation and fertigation drip positioned on the soil surfaceAcclima soil moisture sensor for a maximum of 5 irrigation windows per day,Irrigation and fertigation drip placed on the soil surfaceFixed time irrigation schedule, irrigation applied at three fixed windows per dayOnce daily fixed duration applied irrigation treatment and surface irrigationVolumetric water contentFor the tomato trial we also included an other soil moisture sensor based system referredto as the Quantified Irrigation Controller (QIC) system (Muñoz-Carpena et al., 2006) since it isrelatively inexpensive and the QIC system was shown to be effective in other research settings.This system includes a 0.20 m long ECH2O probe (Decagon Devices, Inc. Pullman, WA) tomeasure soil moisture in tomato plots. Probes were inserted vertically in order to integrate thesoil water content in the upper 0.15 m of the soil profile. The QIC irrigation controllers allowedpre-programmed timed irrigation events if measured soil water content was below a volumetricwater content (VWC) value of 0.10 m3 m-3 during one of five daily irrigation windows, eachwindow lasting 24 min. Based on these readings up to a maximum of five irrigation events couldoccur per day totaling 2 hr, an amount of time equivalent to the timer application treatments. Anoverview of all included irrigation treatments for pepper is presented in Table 1.
In the tomato plots, a set of twelve Hydra Probe II (Stevens Water Monitoring Systems,Inc., Portland, Oregon) were also installed for the I1, I2, I3 and I5 irrigation treatments at a soildepth of 12,5; 37.5 and 67.5 cm. The Hydra Probe II is an in-situ soil sensing system thatmeasures 21 different soil parameters simultaneously, including soil moisture and soil watersalinity (Stevens Water Monitoring Systems, Inc., Portland, Oregon).The use of a portable soil moisture monitoring probe (Sentek - Diviner 2000) allowed assessmentof soil moisture content throughout the entire soil profile (5-105 cm). Access tubes were installed indifferent irrigation treatments, these measurements helped to understand the soil water movement in thesoil profile during the irrigation events.Nitrogen application rates and crop methods were the same as those reported for pepperand are shown in Fig. 2. General crop production practices and field sampling techniquesincluding soil, water and plant sampling were the same as for peppers and will there not bediscussed again. An overview of irrigation treatments for tomato is outlined in Table 2.Field implementation and initial research findingsApproximately forty-five day old tomato plants (Lycopersicon esculentum Mill. var. “Florida 47”) weretransplanted by hand on April 10, 2007. Tomatoes were planted in single rows with 0.3 m betweenplants within the row. Individual plots were 15.2 m long (50 feet) with a 9.1 m (30 feet) harvest lengthand the remainder of the plot was allocated for both soil and destructive plant sampling. Four replicateswere established using a randomized complete block design. Fixed irrigation of one hour each day wasapplied to the transplants until April 23, 13 days after transplanting (DAT). At that time, the irrigationtreatments were implemented by activating the soil moisture controllers (Fig. 6), installing soil moistureprobes (Fig. 7), and setting the irrigation time clock according to target values outlined in Table 2.Figure 11 shows the cumulative irrigation depth applied to specific irrigation treatmentsfor tomato. After the establishment period the cumulative irrigation was 191; 121;177; 216 and204 mm for I1, I2, I3, I4 and I5, respectively. The leaching patterns for tomato followed the
same trend as that for irrigation. The volume of irrigation collected in the drainage lysimetersuntil early June was: 12; 26 and 32 mm, for I1, I2 and I5, respectively (Fig. 12).Actual soil water transfer dynamics for an irrigation event for the fixed irrigation time controlwhich mimics typical farmer practices is shown in Fig. 13. This figure shows that very high soilwater values ( field capacity) occur to a soil depth of 50 cm within 1-2 hours after thecompletion of a 2-hour irrigation daily cycle. Since N moves with the wetting front, these resultsare consistent with those for dye test demonstrations were solute displacement reached adisplacement depth of 40-50 cm within the first day. During subsequent irrigation events, theadditional water being added acts like a piston and pushes the fertilizer down to below 3 feetwithin 7 days after initial fertilizer application. Using soil moisture sensors will allow growers toapply smaller volumes of water more frequently thereby avoiding wasting irrigation water andprevent excessive nitrate leaching losses. In this fashion similar or higher yields may be realizedwith less water and fertilizer.Current StatusMonitoring of the project is ongoing and leachate samples are currently being analyzed. At the time atwhich the report was completed the final harvest was not yet completed (First harvest will occur on June18th) so this report outlines preliminary leaching results only. Overall system performance of theirrigation system was superior to that in the first year while overall crop growth is similar to the secondyear and superior to that observed during the first year.
Tomato Irrigation - Spring 2007300I1 - SDI - QIC 10%I2 - QIC 10%I3 - Acclima 10%I4 - Fixed Time 3 events/dayI5 - Time Fixed 1 event/dayIrrigation /2405/0105/0805/1505/2205/2906/0506/12Date (day after tranplanting)Figure 11. Cumulative amount of irrigation applied to tomato plots, spring 2007.Tomato- Spring 2007 - Volume Percolated40Volume percolated (mm)I1 - SDI - QIC 10%I2 - QIC 10%I5 - Time 2906/05Date (after transplanting)Figure 12. Cumulative leaching volume captured in drainage lysimeters underneath tomato plots.
Volumetric Water Content (m3/m3)24Irrigation volume 5.47 mm22Depth10 cm20 cm30 cm40 cm50 cm60 cm70 cm201816141210800:0001:0002:0003:0004:0005:00Time in hours after irrigation event startedFigure 13. Changes in soil moisture as related to irrigation event in control treatment (I5).III) Improved integration of cover crops in vegetable production systemsExperimental conditions and treatmentsOn March 23rd of 2006 all field plots were mowed and sweet corn was planted on April 7th of2006. Sweet corn was fertilized at 0, 0.33 or 0.67 times IFAS N recommendations for cover cropbased treatments and fertilizer was applied in 3 applications (0, 3 and 5 weeks after planting).Alternatively, conventionally managed plots were fertilized or at 0, 0.33, 0.67, 1.0, or 1.33 timesIFAS N recommendation for (this range of N rates allowed us to develop a representative Nfertilizer response curve and to verify IFAS N recommendations for sweet corn).
During the spring of 2006 we applied 15N ( a stable isotopic marker) at 3 different times(preplanting, 2 or 4 weeks after planting). In this manner we could determine what fraction ofthe applied fertilizer was taken up for these 3 application times. In addition to this we used twodifferent labels. The first one had the label was inserted in the nitrate part (15NO3-N) of thefertilizer molecule while for the second material the ammonium part (15NH4-N) of the fertilizermolecules was labeled. By using this approach we could calculate the uptake efficiency of anitrate vs a ammonium based N-fertilizer source for each application time (preplant, early andlate). This technique is very powerful since it allows us to gain a better understanding of hownitrogen behaves in the soil.Effects of N-fertilizer treatment on plant growth, and yield and N accumulation weredetermined by sampling plants at 3-week intervals and results were reported in a previous report.Soil nitrate levels were determined by soil coring at 0.3m increments upto the 0.9 m soil depthprior and after each fertilizer application. This field study was complemented with a columnstudy during the spring of 2006 to assess how residence time (retention of fertilizer in therootzone as related to N displacement associated with leaching rainfall or excessive irrigation),affects corn growth and fertilizer uptake efficiency. Effects of N-fertilizer rate on cropproduction as affected by cover crop treatments were presented in previous reports so this reportwill focus on the results of the labeled fertilizer recovery in the crop as related to fertilizer useefficiency instead.Research FindingsBy using the labeled fertilizer we were able to determine at what time and in what form fertilizer is usedmost efficiently in a sweet corn production systems. Moreover, we also looked at in what plant part thefertilizer is being accumulated. Table 3 shows how time of N-fertilizer application and N-form affectshow much N is taken up in the vegetative (stover) and marketable (ears) plant parts. An asterisk (*) nextto an fertilizer application event indicates that labeled fertilizer was applied at that time where as regularfertilizer was applied at the same rate for all the other applications (so total N rate was identical for alltreatments shown in this table). The last rows shows the effect of splitting the labeled fertilizer in threesmaller (equal) doses across all application events. Results reported in this row should therefore be
similar then the average of the first three rows, which is the case and shows that our technique workedwell.Overall N accumulation from labeled fertilizer in both vegetative and reproductive plantparts was greater for the second and third application when the N was applied later (Table 3). Earlyapplications mainly resulted in N accumulation in the leaves and stems since ears were not present atthat time although some N translocation from leaves to stems may occur during final growth. If the Napplied later on it tend to accumulate more in ears since ears tend to form later on and at that pointvegetative growth starts to decline.In terms of fertilizer uptake efficiency, applying fertilizer early on during the season whenroot systems were poorly developed and crop N-demand is low resulted in limited plant uptake and poorfertilizer uptake efficiencies (Table 4). For N-fertilizer applied in nitrate form, the initial fertilizeruptake efficiency was 7% and values increased to 19 and 39% for the 2nd and 3rd N application,respectively. For N-fertilizer applied in ammon
irrigation system (fertigation). Fertilizer sources used were calcium nitrate (N), potassium chloride (K) and magnesium sulfate (Mg and S). Additional fertilizer was applied before transplanting: 40 kg N ha-1; 134 kg P 2O 5 ha-1 and 100 kg K 2O ha-1 pre-plant fertilizer was incorporated into the beds. On tomatoes, it was applied 134 kg P 2O 5 .