Transcription
bp second quarter 2022financial results2 August 2022
svp investor relations1Q 2022 financial resultsGood morning everyone and welcome to bp’s second quarter 2022 resultspresentation.I am here today with Bernard Looney, chief executive officer and MurrayAuchincloss, chief financial officer.Before we begin today, let me draw your attention to our cautionary statement.2
Cautionary statementIn order to utilize the ‘safe harbor’ provisions of the United States Private Securities Litigation Reform Act of 1995 (the ‘PSLRA’) and the general doctrine of cautionary statements, bp is providing the following cautionary statement: The discussion in this results announcementcontains certain forecasts, projections and forward-looking statements - that is, statements related to future, not past events and circumstances - with respect to the financial condition, results of operations and businesses of bp and certain of the plans and objectives of bpwith respect to these items. These statements may generally, but not always, be identified by the use of words such as ‘will’, ‘expects’, ‘is expected to’, ‘aims’, ‘should’, ‘may’, ‘objective’, ‘is likely to’, ‘intends’, ‘believes’, ‘anticipates’, ‘plans’, ‘we see’, ‘focus on’ or similarexpressions.In particular, the following, among other statements, are all forward looking in nature: expectations regarding the conflict in Ukraine, including the impacts and consequences on energy supplies; plans, expectations and assumptions regarding oil and gas demand, supply, andprices; expectations regarding capacity and inventory levels; plans and expectations regarding bp’s performance, earnings, balance sheet and capital expenditure, including with respect to bp’s resilient hydrocarbons, convenience and mobility and low carbon energybusinesses; plans and expectations related to earnings growth, including the aim that resilient hydrocarbons will reach 28-33 billion of EBITDA by 2030, that EBITDA from convenience and mobility will reach around 9-10 billion by 2030, that EBITDA for bp’s low carbonbusinesses will reach around 2-3 billion of EBITDA by 2030, that EBITDA from transition growth businesses will reach around 9-10 billion by 2030, and that EBITDA from EV charging will reach around 2 billion by 2030; plans to high-grade bp’s oil and gas portfolio, includingexpectations regarding future production; expectations regarding the oil and gas business’s contribution to the aim of sustaining EBITDA from resilient hydrocarbons to 2030; plans and expectations regarding allocating investments to material regions of the world, andexpectations regarding EBITDA growth from these regions; plans and expectations regarding cost efficiency, divestment and growing unit margins; plans and expectations for oil and gas EBITDA to remain highly leveraged to price over the decade; plans and expectationsregarding the start-up of new high-margin, major projects by end 2024; plans and expectations regarding increased investment in bpx energy from 2021 to 2022 and growing production in bpx energy; plans and expectations regarding the growth in EV charge points andcharge capacity, including expectations related to the benefits of bp’s integrated organisation and expectations related to growth in regions including the US; plans and expectations regarding bp’s ‘on-the-go’ chargers; plans and expectations regarding bp’s five transitiongrowth engines of EV charging, convenience, bioenergy, renewables and hydrogen; plans and expectations regarding bp’s convenience and mobility business; plans and expectations regarding resilient hydrocarbons; expectations regarding refining margins and productdemand; expectations regarding bp’s future financial performance and cash flows; expectations regarding supply issues; expectations with regards to bp’s transformation to an IEC; expectations regarding the energy trilemma and bp’s capabilities and scale to help the worldaddress it; plans and expectations regarding bp’s financial frame; bp’s plans and expectations regarding the allocation of surplus cash flow; plans regarding future quarterly dividends and the amount and timing of share buybacks; plans and expectations regarding bp’s creditrating, including in respect of maintaining a strong investment grade credit rating; expectations regarding bp’s development of hydrogen projects and bp’s hydrogen production, low carbon energy hubs and wind projects; plans and expectations regarding start-ups during 2022;expectations of disposal proceeds of 2-3 billion in 2022; plans and expectations of around 14-15 billion capital expenditure in 2022; plans and expectations regarding the acquisition of a 35% interest in the Bay du Nord discovery in offshore Canada, the divestment of bp’sSunrise oil sands asset, the delivery of low carbon hydrogen to bp’s Rotterdam, Lingen, Gelsenkirchen and Castellon refineries, the award of a 100% working interest in an offshore exploration block in Egypt, the appraisal of the Brazil discovery at Cabo Frio, the Basra EnergyCompany joint venture, the Indonesia discovery at Timpan-1 and bp’s acquisition of a stake in the Asian Renewable Energy Hub project; and plans and expectations regarding joint ventures, partnerships and other collaborations with Uber Eats, Didi, Daimler Trucks, Eni,PetroChina, Volkswagen Group, Iberdrola and Thyssenkrupp Steel.By their nature, forward-looking statements involve risk and uncertainty because they relate to events and depend on circumstances that will or may occur in the future and are outside the control of bp.Actual results or outcomes, may differ materially from those expressed in such statements, depending on a variety of factors, including: the extent and duration of the impact of current market conditions including the volatility of oil prices, the effects of bp’s plan to exit itsshareholding in Rosneft and other investments in Russia, the impact of COVID-19, overall global economic and business conditions impacting bp’s business and demand for bp’s products as well as the specific factors identified in the discussions accompanying such forwardlooking statements; changes in consumer preferences and societal expectations; the pace of development and adoption of alternative energy solutions; developments in policy, law, regulation, technology and markets, including societal and investor sentiment related to theissue of climate change; the receipt of relevant third party and/or regulatory approvals; the timing and level of maintenance and/or turnaround activity; the timing and volume of refinery additions and outages; the timing of bringing new fields onstream; the timing, quantum andnature of certain acquisitions and divestments; future levels of industry product supply, demand and pricing, including supply growth in North America and continued base oil and additive supply shortages; OPEC quota restrictions; PSA and TSC effects; operational and safetyproblems; potential lapses in product quality; economic and financial market conditions generally or in various countries and regions; political stability and economic growth in relevant areas of the world; changes in laws and governmental regulations and policies, includingrelated to climate change; changes in social attitudes and customer preferences; regulatory or legal actions including the types of enforcement action pursued and the nature of remedies sought or imposed; the actions of prosecutors, regulatory authorities and courts; delaysin the processes for resolving claims; amounts ultimately payable and timing of payments relating to the Gulf of Mexico oil spill; exchange rate fluctuations; development and use of new technology; recruitment and retention of a skilled workforce; the success or otherwise ofpartnering; the actions of competitors, trading partners, contractors, subcontractors, creditors, rating agencies and others; bp’s access to future credit resources; business disruption and crisis management; the impact on bp’s reputation of ethical misconduct and noncompliance with regulatory obligations; trading losses; major uninsured losses; the possibility that international sanctions or other steps taken by governmental authorities or any other relevant persons may impact Rosneft’s business or outlook, bp’s ability to sell its interestsin Rosneft, or the price for which bp could sell such interests; the possibility that actions of any competent authorities or any other relevant persons may limit bp’s ability to sell its interests in Rosneft, or the price for which it could sell such interests; the actions of contractors;natural disasters and adverse weather conditions; changes in public expectations and other changes to business conditions; wars and acts of terrorism; cyber-attacks or sabotage; and other factors discussed elsewhere in this report, as well as those factors discussed under“Risk factors” in bp’s Annual Report and Form 20-F 2021 as filed with the US Securities and Exchange Commission.Reconciliations to GAAP - This presentation also contains financial information which is not presented in accordance with generally accepted accounting principles (GAAP). A quantitative reconciliation of this information to the most directly comparable financial measurecalculated and presented in accordance with GAAP can be found on our website at www.bp.com.This presentation contains references to non-proved resources and production outlooks based on non-proved resources that the SEC's rules prohibit us from including in our filings with the SEC. U.S. investors are urged to consider closely the disclosures in our Form 20-F,SEC File No. 1-06262.Tables and projections in this presentation are bp projections unless otherwise stated.August 2022* For items marked with an asterisk throughout this document, definitions are provided in the glossary2Q 2022 financial results3During today’s presentation, we will make forward-looking statements includingthose that refer to our estimates, plans and expectations. Actual results andoutcomes could differ materially due to factors we note on this slide and in ourUK and SEC filings. Please refer to our Annual Report, Stock Exchangeannouncement and SEC filings for more details. These documents are availableon our website.I will now handover to Bernard.3
Chief executive officer1Q 2022 financial resultsThanks Craig.Good morning everyone.Welcome to our second quarter results. It is great to have you join us on the calland see those of you here in person.You are going to hear about – what I hope you will agree – is some goodprogress from us today.But before we do that – let me take a moment to put what follows into context.Russia’s military action is continuing in Ukraine, devastating people’s lives anddisrupting energy supplies.The cost of living is spiralling upwards – with energy costs a big contributor.And since the start of the Ukraine conflict, power generation from coal in Europehas significantly increased.These are stark examples of the energy trilemma. Energy security under threat; Energy affordability an acute problem for many; and A pressing need for lower carbon energy.4
We see this.And it’s why we are absolutely focused on delivering our strategy totransform to an Integrated Energy Company. A company which canhelp solve that energy trilemma. We do that by:a)Working hard to keep the energy flowing today. And – not or -b)At the same time investing to accelerate the energy transition.That’s the role of an IEC and its purpose has never been clearer.And we do all of that while remaining acutely focused on deliveringlong-term value for our owners.4
2Q 2022 financial results5That is the context against which we present today’s results.A set of results that show us performing while transforming.During the quarter we generated operating cash flow of 10.9 billion.We reduced net debt for the ninth consecutive quarter to reach 22.8 billion.And we are growing distributions to shareholders – our owners - by announcing: A 10% increase in the quarterly dividend per ordinary share; And a further 3.5 billion share buyback.Crucially we are doing this within a financial frame which is unchanged andmaintaining a resilient 40 per barrel cash balance point. With all the uncertaintyin the world – now is not the time to lose discipline.We also have real momentum in our transformation. In a moment I will updateyou on how we are: Driving improvement in our oil and gas portfolio; and Making good progress in our transition growth engines.But for now, I will hand over to Murray to take us through the second quarterresults.Murray.5
Chief financial officer1Q 2022 financial resultsThanks Bernard and good morning everyone.6
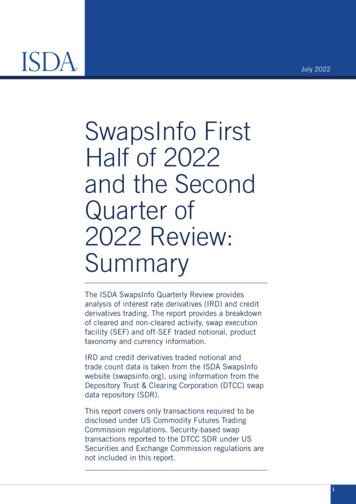
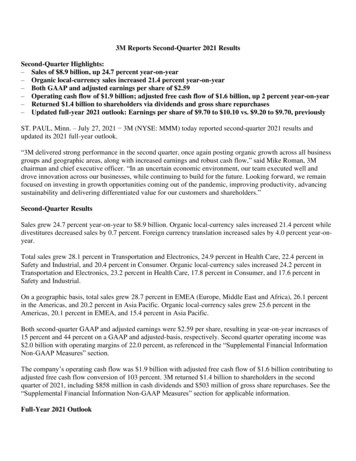
Macro environmentOil price1 /bblNatural gas price1 /mmbtuRefining marker margin* 1 /bblSource: Platts - all data 1 July 2021 to 27 July 2022(1)Spot price2Q 2022 financial results7Let’s begin with macro environment.Starting with the oil price. During the second quarter, Brent averaged 114 perbarrel, up from 102 per barrel in the first quarter. This was driven by reducedspare global capacity and inventory levels significantly below the 5-year average.Looking ahead, we expect these factors to keep oil prices elevated during thethird quarter.Turning to gas prices. During the second quarter, average European pricesdeclined as high LNG imports supported a recovery in inventories. However, inthe latter stages of the quarter prices moved sharply higher driven by reducedRussian supply and the outage at Freeport. In the US, Henry Hub rose by anaverage 60% from the first quarter. This was supported by limited gasproduction growth and strong gas-to-power demand.The outlook for global gas prices is heavily dependent on Russian pipeline flows.We expect prices to remain elevated and volatile during the third quarter due to alack of supply to Europe.Moving to refining. Margins more than doubled to average 45.50 per barrel inthe second quarter. This reflects resilient demand, lower stocks and sanctioningof Russian crude and product. In the third quarter we expect refining margins toremain elevated due to ongoing supply disruptions.7
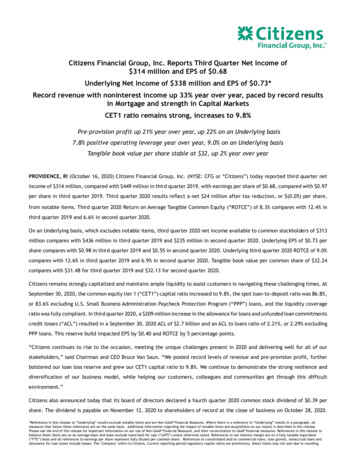
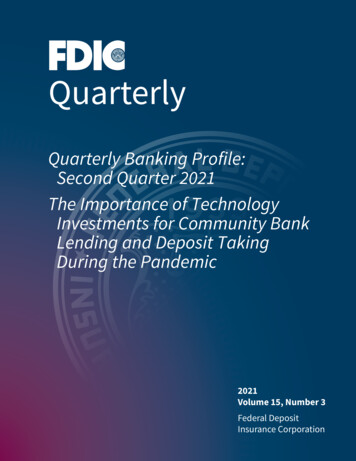
Underlying results bn2Q211Q222Q224.710.212.8Gas & low carbon energy1.23.63.1Oil production & operations2.24.75.9Customers & products0.82.24.0Other businesses and corporate 10.4(0.3)Other businesses and corporate excluding Rosneft *(0.3)Rosneft*0.7Underlying RCPBIT *2Q 2022 vs 1Q 2022 Strong realised refining margins(0.2) Higher liquids and gas realisations*(0.3)(0.2) Average gas marketing and trading--(0.0)0.0(0.0)Underlying replacement cost profit*2.86.28.5Operating cash flow*5.48.210.9(2.5)(2.9)(2.8)0.21.20.7Of which:Consolidation adjustment - UPIICapital expenditure**Divestment and other proceedsSurplus cash flow*0.74.16.6Net issue (repurchase) of shares(0.5)(1.6)(2.3)Net debt*Announced dividend per ordinary share (cents per share)(1)32.727.522.85.4605.4606.006From first quarter 2022 the results of Rosneft, previously reported as a separate segment, are also included in other businesses & corporate.Comparative information for 2021 has been restated to reflect the changes in reportable segments.result after exceptional 1Q22 Higher refinery turnaround andmaintenance activity2Q 2022 financial results8Moving to results.In the second quarter we reported an underlying replacement cost profit of 8.5billion compared to 6.2 billion last quarter.Compared to the first quarter: In gas and low carbon energy the result benefited from higher realisations.This was offset by an average gas marketing and trading result following theexceptional performance in the first quarter. The result includes our bestestimate of the impact of the recent outage at Freeport LNG leading to asignificant reduction in the number of cargoes expected to be received. In oil production and operations, the result reflects higher realisations. In customers and products, the products result benefited from a significantincrease in refining margins partially offset by higher turnaround andmaintenance activity. The contribution from oil trading remainedexceptionally strong.Strength in products more than offset the impact of weaker fuel retailmargins and higher inflation in a challenging environment in our customersbusinesses. Despite these factors, the convenience contribution remainedstrong.8
Cash flow and balance sheet2Q22 highlights 1H22 cash inflows/outflows bn 10.9bn operating cash flow* including: 2.9bn working capital*1 build – includes 1.2bn Gulfof Mexico oil spill payment 6.6bn surplus cash flow* 2.3bn share buyback executed 2.5bn programme announced with 1Q22 resultscompleted on 22 July (1)Net debt* reduced to 22.8bnAdjusted for inventory holding gains and fair value accounting effects2Q 2022 financial results9Turning to cash flow.Operating cash flow was 10.9 billion in the second quarter. This included 1.2billion of Gulf of Mexico oil spill payments within a working capital build of 2.9billion.Capital expenditure was 2.8 billion with our guidance for 2022 remaining in arange of 14 to 15 billion.And disposal proceeds were 700 million in the quarter, bringing the first halftotal to 1.9 billion. Guidance of 2 to 3 billion in 2022 is unchanged.During the quarter we repurchased 2.3 billion of shares. The 2.5 billionprogramme announced with first quarter 2022 results was completed on 22 July.Reflecting underlying cash flow delivery, net debt fell for the ninth consecutivequarter to reach 22.8 billion.With second quarter surplus cash flow of 6.6 billion, we intend to execute ashare buyback of 3.5 billion prior to reporting third quarter results.9
Maintaining our disciplined financial frame(1)(2)Subject to maintaining a strong investment grade credit ratingIn addition, executed 500m buyback programme during 1Q22 to offset expected dilution from vesting of awards under employee share schemes during 20222Q 2022 financial results10Moving to our disciplined financial frame which has five priorities and remainsunchanged.Our first priority remains a resilient dividend.As Bernard has outlined, we have announced a 10% increase in the quarterlydividend.Crucially, this is funded within an unchanged 2021 to 2025 average cash balancepoint of around 40 per barrel Brent, 3 Henry Hub and 11 per barrel RMM – all2020 real.This increase reflects the underlying performance and cash generation of thebusiness, which has enabled strong progress in delivering share buybacks andnet debt reduction.Our second priority is to maintain a strong investment grade credit rating. Weintend to continue to allocate 40% of 2022 surplus cash flow to furtherstrengthen the balance sheet.Our third and fourth priorities are the disciplined allocation of investment to ourlow carbon and convenience and mobility businesses and to resilienthydrocarbons.And our fifth priority is share buybacks. We are committed to returning 60% of2022 surplus cash flow through share buybacks subject to maintaining a stronginvestment grade credit rating. And we have now announced share buybacksfrom 2021 and first half 2022 surplus cash flow of over 10 billion. This isequivalent to 60% of the cumulative surplus.I’ll now hand back to Bernard.10
Chief executive officer1Q 2022 financial resultsThanks Murray.11
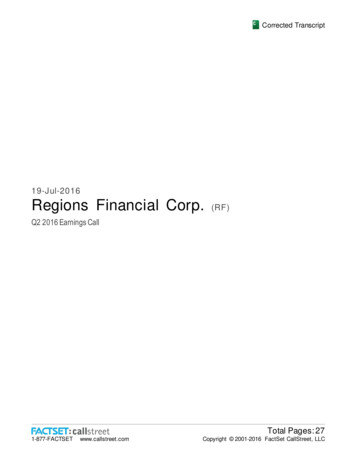
Advancing our strategy at pace – growing EBITDA to 2030All numbers represent 2030 EBITDA* aims, at 60/bbl Brent (2020, real) and bp planning assumptions2Q 2022 financial results12Turning then to our strategic momentum in transforming to an IEC.First, I am going to provide an update on the progress that we are making in ouroil and gas business.Second, I want to highlight some examples which give us growing confidence inour transition growth engines and how this is underpinned by incumbency. Byour assets, our capabilities, our relationships and our brand. I will focus today ontwo of the engines – EV charging and hydrogen – where we are excited by theprogress made in recent months.12
2Q 2022 financial results13Turning first to our oil and gas business.13
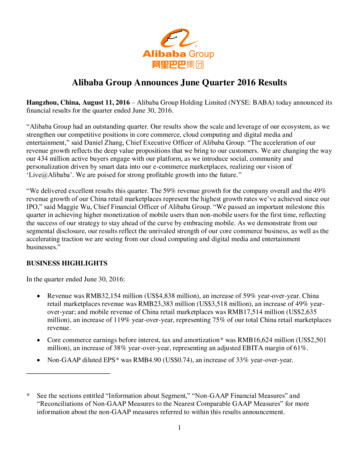
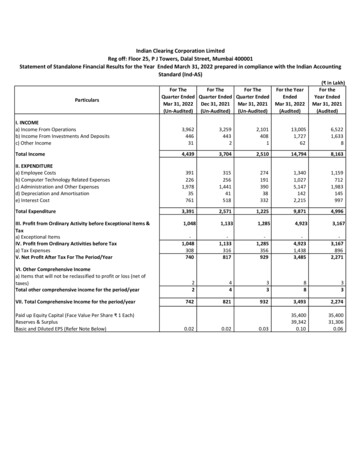
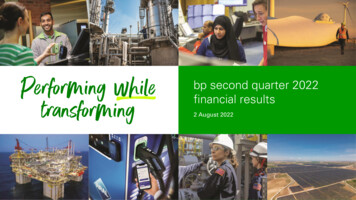
Oil and gas – a high-graded portfolioRemaining highly price leveragedas production declinesFocused on growth from sixmaterial regionsOil & gas EBITDA*1,2,3 bnDriving 20% margin expansionin unit EBITDAOil & gas EBITDA*1,3 bnPrice upsideProduction1,3 % 45/boeOther resilienthydrocarbons 30-45/boeOtherOther oil& gasregionsregions2021 actual( 71/bbl) 15-30/boe6 material6 materialoil ®ionsgas regions 15/boe2021(1)(2)(3)2030 aims20212030 aimsOil and gas EBITDA excludes Rosneft, bioenergy, refining and trading. Reflects planned divestments2021 and 2030 price upside adjusted for average oil and natural gas marker prices 1H 2022 (nominal)2030 at 60/bbl Brent (2020, real) and 3/mmbtu Henry Hub (2020, real)20212030 aims2Q 2022 financial results14Our strategy in oil and gas is to maximise returns and cash flow; creatingresilience through lower costs, higher margins and lower operational emissions.Focusing on the best barrels. And high grading through divestment at the righttime and for the right value.Let me say three things about our oil and gas portfolio.Firstly. Leverage to price.Today’s results show our portfolio doing what is it supposed to do – capturingthe upside from higher prices.And as the first chart shows, over the decade, we expect our oil and gas EBITDAto remain highly leveraged to price as we high-grade our portfolio and reduceproduction.This is enabled by EBITDA growth coming from just six material regions.Secondly. Focus. The middle chart.Underpinned by a deep resource base, we are focusing our investment andleveraging incumbency. Through 2030 we plan to allocate around 80% of oil andgas investment to these six material regions. We expect EBITDA to grow fromthem and represent around 90% of the 2030 total from oil and gas.Thirdly. Higher unit margins.The third chart illustrates our evolving margin mix. It’s the same chart we shared14
at our strategy update in February.It demonstrates how unit margins are expected to grow by over 20%by 2030 relative to 2021 as we: Focus our investment in higher margin regions; Execute our plans to drive cost efficiency; and High-grade through divestments in lower margin regions.This high-graded oil and gas portfolio, together with our growth plansin refining and bioenergy, gives us confidence in sustaining EBITDAfrom resilient hydrocarbons at around 2021 levels through 2025,aiming to hold around this level to 2030.14
Oil and gas – progress in high-grading our portfolioHigh-gradingposition in Canada Agreed to divest 50%interest in Sunriseoil sands assetGrowing investment andproduction in bpx energy3,500 drillable locations 30% IRR at 55/bbl WTIand 3/mmbtu Henry Hub Agreed to acquire 35%interest in Bay du NorddiscoveryAccess in EgyptAwarded 100% workinginterest in offshoreexploration blockAzule Energy beginsoperationsAngola’s largestindependent oil & gasproducer1H 2022 efficiencyAppraisal ongoingBrazil discovery atCabo Frio Plant reliability* 95%New oil hub potential,appraisal ongoing 11% lower productioncost YoYMajor project start-upsTargeting seven newhigh-margin1 majorprojects* by end 2024(1)Discovery inIndonesia at Timpan-1Average major project margins above portfolio averageBasra EnergyCompany formedJoint venture to restructurebusiness in Iraq2Q 2022 financial results15And we are making real progress – in four areas.First, investment.By the end of 2024 we expect to start-up a further seven high-margin majorprojects.And to maximise value we will be flexible in our capital allocation. For instance,within our disciplined capital frame we plan to increase investment in bpx energyfrom 1 billion in 2021 to around 1.7 billion in 2022. Here we are leveraging ahopper of around 3,500 drilling locations capable of delivering IRRs of over 30%at 55 WTI and 3 Henry Hub.Second, reliability and efficiency.In the first half of 2022 plant reliability increased to over 95% and unit productioncosts fell by almost 11% compared to the same period last year.Third, exploration and renewal.We continue to selectively explore, aiming to further enhance our portfolio. Sofar this year we have: Announced an oil discovery offshore Brazil with the potential to become anew hub; Participated in a gas discovery offshore Indonesia; And strengthened our position offshore Canada, agreeing to acquire a 35%interest in the Bay du Nord discovery.15
Finally, portfolio optimisation. This year we have: Agreed to divest our Canadian Sunrise and Pike oil sands assets; Created a new Angola focused company – Azule Energy – in a jointventure between Eni and ourselves; and Restructured our business in Iraq with PetroChina.15
Integration2Q 2022 financial results16Now let me turn to two of our transition growth engines, starting with EVcharging.16
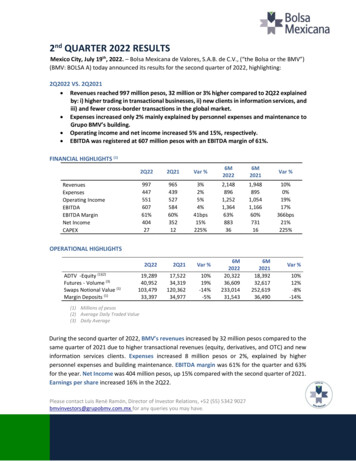
EV charging – aim to deliver 2bn EBITDA by 2030Leveraging ourglobal scale(1)Charge points*: 50% growth to 2025 already announced000’sGlobal network and infrastructureConvenience and loyalty offersEstablished global strategic relationshipsTrading and shippingReported to the nearest 502Q 2022 financial results17Here, we aim to deliver around 2 billion of EBITDA by 2030, focusing on fleetand fast charging to ‘on-the-go’ customers.Clear sources of competitive advantage underpin this: Our global network of 20,600 retail sites; Integrated convenience offers at our 2,200 strategic sites; Our customer base with around 16 million loyalty customers and around170,000 fleet accounts; Our trading and shipping organisation which provides optimised and reliableelectron sourcing. Over time, one of the benefits of integration is expectedto be the sourcing of electrons from our own renewables business. Andhere, we have already secured offshore wind licenses with over 5 gigawattsof capacity net bp; And strategic relationships with partners like VW, Uber, Didi, and DaimlerTrucks.We are accelerating our roll-out plans. We now have around 16,000 charge points – up almost 50% since the samepoint last year; We have announced partnerships with VW and Iberdrola that have thepotential to help achieve half of our target growth to 2025; And we are excited about potential opportunities in other regions, like the17
US.Importantly, we have a distinctive focus on fast-charging. Around 50% of our charge points are now rapid or ultra-fast –that’s at least 50kW for rapid, more than 150kW for ultra-fast; We recently became the leading provider of ultra-fast charging inGermany, building on our leading position in the UK; And by 2030, we expect around 90% of our 100,000 ‘on-the-go’chargers to be rapid or ultra-fast, resulting in around 10 gigawattsof installed capacity. This is equivalent to around 30 billion EVmiles driven per annum assuming just a 10% utilisation of ournetwork – 15 times more than a network of the same scale withpredominately 7kW charge points.And we are rapidly growing electron sales. Supported by increasingutilisation rates, the amount of electricity we sold through EV chargingrose more than two-fold in the first half of 2022 compared to the prioryear.17
2Q 2022 financial results18Turning then to hydrogen.18
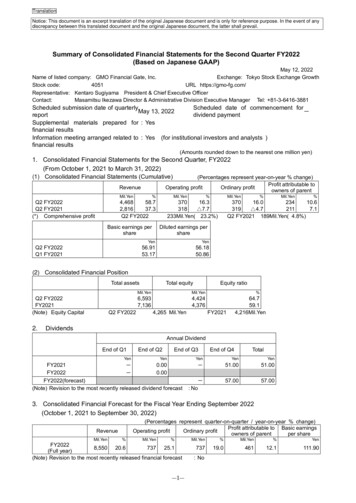
Hydrogen – building global leadership in low carbon hydrogenOur progressAsian Renewable Energy Hub (AREH)Global scale, cost advantaged solar, wind & hydrogenDecarbonisingown demandRefineriesBuilding globalscale 1mtpahydrogen hopper(risked)Capturing customerdemand 2.5mtpaidentifiedGlobal scale major project executionTrading and shippingIntegrating energy value chainsLeveraging partnerships and global customers2Q 2022 financial results19We see a huge opportunity given the anticipated strong growth in global demandfor low carbon hydrogen.Our strategy is to leverage existing demand pools – often our own - and developadvantaged production hubs – manufacturing green and blue hydrogen at scaleto create competitive supply for global markets.It is underpinned by our distinctive sources of competitive advantage: Delivering and operating complex global scale major projects; Our global trading capability and experience in building integrated valuechains; and Our track record in building and maintaining partnerships – establishing longterm customer relationships.We are actively progressing our business development and now have a globalscale, risked project hopper of over one million tonnes per annum hydrogenproduction capacity. And we have identified more than 2.5 million tonnes perannum of potential customer demand. This includes our recently announcedstrategic collaboration with Thyssenkrupp Steel to advance decarbonisation ofsteel production.Initially we are progressing projects that help decarbonise hydrogen feedstocksupply to deliver low carbon hydrogen to our Rotterdam, Lingen, Gelsenkirchenand Castellon refineries.We are also helping to decarbonise industrial clusters, including in Texas, and at19
Teesside in the UK.And we are accelerating our aim to create cost-advantaged globalproduction hubs. We have agreed to lead and operate the AsianRenewable Energy Hub – AREH – in Australia where bp will hold40.5% stake.AREH has the potential to be one of the world’s largest renewablesand green hydrogen hubs that will help decarbonise the Australianmarket, as well as supplying competitive green hydrogen and ammoniato major international users.This project has plans to reach up to 26 gigawatts of renewableenergy. To put this in context, it’s around a third of all electricitygenerated in Australia in 2020. And it will target production of 1.6million tonnes of green hydrogen or nine million tonnes of greenammonia per annum. Hydrogen at scale.19
2Q 2022 financial results20To summarise.I hope you agree that today’s results show that bp is focused on delivery.We are performing while transforming – doing exactly what we said we woulddo. The company is running well and continues to strengthen. We have real strategic momentum in our transformation to an IEC. Our fin
(1) Oil and gas EBITDA excludes Rosneft, bioenergy, refining and trading. Reflects planned divestments (2) 2021 and 2030 price upside adjusted for average oil and natural gas marker prices 1H 2022 (nominal) (3) 2030 at 60/bblBrent (2020, real) and 3/mmbtuHenry Hub (2020, real) 2021 2030 aims 2021 2030 aims 15-30/boe 15/boe 30-45/boe 45/boe