Transcription
The International Archives of the Photogrammetry, Remote Sensing and Spatial Information Sciences, Volume XLVI-M-2-2022ASPRS 2022 Annual Conference, 6–8 February & 21–25 March 2022, Denver, Colorado, USA & virtualCOMPARISON OF LANDSAT-9 AND PRISMA SATELLITE DATA FOR LAND USE /LAND COVER CLASSIFICATIONAylin Tuzcu Kokal1*, İrem İsmailoğlu2, Nebiye Musaoğlu1,21Istanbul Technical University, Civil Engineering Faculty, Department of Geomatics Engineering, 34469 Maslak, Istanbul, Turkey (tuzcuay, musaoglune)@itu.edu.tr2 Istanbul Technical University, Center for Satellite Communications and Remote Sensing, 34469 Maslak, Istanbul, Turkey (iremism@cscrs.itu.edu.tr)KEY WORDS: Remote Sensing, Land Use /Land Cover, Landsat-9, PRISMA, Support Vector MachineABSTRACT:Land use and land cover (LU/LC) detection has great significance in management of natural resources and protection of environment.Hence, monitoring LU/LC with the state-of-the-art approaches has gained importance during the recent years and free access satelliteimages have become valuable data source. The aim of this study is to compare classification abilities of Landsat-9 and PRISMAsatellite images while applying Support Vector Machine (SVM) algorithm to distinguish different LU/LC classes. For this purpose,the study area was chosen to be of heterogeneous character that includes industrial area, roads, residential area, airport, sea, forest,vegetation and barren land. When the classification results were visually examined, it was seen that forest, industrial area and airportclasses were distinguished more accurately than other classes. On the other hand, qualitative results were validated with quantitativeaccuracy assessment results. The overall accuracy (OA) and Kappa coefficient values were calculated as 89.33 and 0.88 for Landsat9 satellite image and as 92.33 and 0.91 for the PRISMA satellite image, respectively. In the accuracy assessment results, althoughLandsat-9 and PRISMA satellite images showed similar classification performances, a slight improvement was observed by using thePRISMA satellite image. The findings indicated that although both of the Landsat-9 and PRISMA satellite images were proper data toassess the LU/LC of the complex region, a slightly more performance could be achieved by using the PRISMA satellite image.1. INTRODUCTIONAssessment of the land use and land cover (LU/LC) is playing avital role for natural resource management and environmentalprotection (Tan et al., 2016; Tadese et al., 2020). Mapping theLU/LC accurately by using state-of-the-art approaches hasbecome a major focus as it has profound impact on the ecosystem(Huang et al., 2020; Ge et al., 2020). Earth observation satelliteimagery have started to provide rich information with the rapiddevelopment of remote sensing technologies (Du et al., 2012; Geet al., 2020; Tong et al., 2020). In particular, remote sensingbased images that were based on a free access policy are themajor data source for assessing the spatial extents of variousLU/LC classes in a cost and time effective way (Mugo et al.,2020; Nguyen et al., 2020; Tadese et al., 2020; Weigand et al.,2020).Landsat, which is a joint mission of The National Aeronauticsand Space Administration (NASA) and US Geological Survey(USGS), provides consistent multispectral images over the pastfive decades. Landsat- 9, which was launched in September 2021,is the latest of Landsat Earth-observing satellites series. Althoughfree and open Landsat satellite images provide opportunities forLU/LC applications, multispectral satellite images have somelimited factors to classify heterogeneous regions. Thus, the needarises to discriminate complex LU/LC classes by using satelliteimages that have higher spectral resolution. Hyperspectralsatellite images offer a great number of spectral bands that enableacquiring continuous spectral reflectance of the objects on theearth (Tan et al., 2005; Velez-Reyes et al., 2006; Vangi et al.,2021). PRecursore IperSpettrale della Missione Applicativa(PRISMA), which is a mission of Italian Space Agency (ASI), isa new hyperspectral earth observation satellite provides freeproducts and helps to improve the understanding of environmentwith its high spectral resolution. High accuracies were achievedby using PRISMA satellite image in different classificationapplications such as detection of non-photosynthetic vegetation(Pepe et al., 2020), different forest types (Vangi et al., 2021), andburned areas (Lazzeri et al., 2021) due to providing narrowspectral bands ( 12 nm).Numerous studies about usage of previous Landsat satelliteimages for LU/LC classification applications have beenconducted (Coulter et al., 2016; Chen et al., 2020; Deng et al.,2019; Kumar et al., 2021). Landsat-9 satellite has the sametechnical properties with the Landsat-8 satellite (Url-1). AsLandsat-9 is a recently launched satellite, LU/LC classificationapplications with Landsat-9 satellite image have not yet beenextensively performed. On the other hand, PRISMA satelliteimages were widely used in studies on discriminating differenttypes of land cover classes (Lazzeri et al., 2021; Vangi et al.,2021). However, there is a lack of studies about discriminatingdifferent LU/LC types by using PRISMA satellite image.Comparison of classification performances of Landsat-9 andPRISMA satellite images which bear the same spatial resolutionwas aimed in this study for determining different LU/LC classes.* Corresponding authorThis contribution has been es-XLVI-M-2-2022-197-2022 Author(s) 2022. CC BY 4.0 License.197
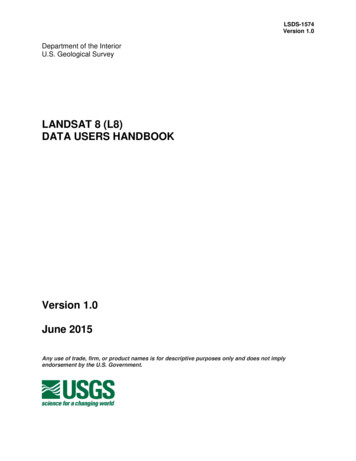
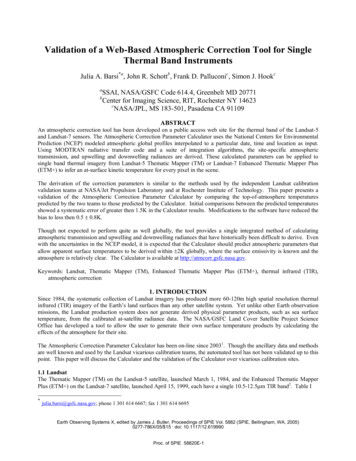
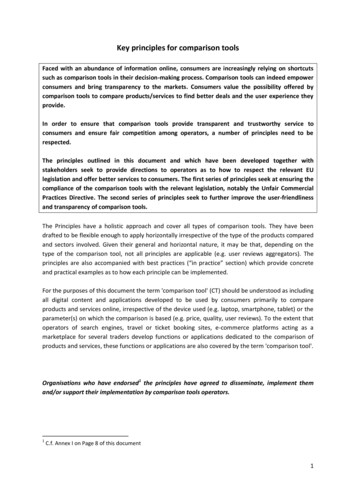
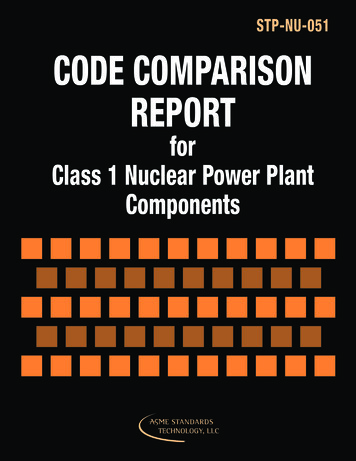
The International Archives of the Photogrammetry, Remote Sensing and Spatial Information Sciences, Volume XLVI-M-2-2022ASPRS 2022 Annual Conference, 6–8 February & 21–25 March 2022, Denver, Colorado, USA & virtualFor this purpose, hyperparameters of the Radial Basis Function(RBF) kernel were tuned and pixel- based support vectormachine (SVM) which is a machine learning classifier, wasapplied. In addition to qualitative accuracy assessment,quantitative analysis was also conducted based on error matrices,and accuracy metrics were calculated.2. DATA AND METHODOLOGYSwath Width (km)185Ground Sample Distance (m) Multispectral : 30PAN : 15Spectral Coverage (nm)430 - 2290Spectral Resolution9 bands(bandwidth: 20-180 nm)Temporal Resolution16 daysTable 2. Data specifications of the Landsat-9 Operational LandImager 2 (OLI-2) Instrument (Url-1; Url-3; Url-4).2.1. Study AreaThe pilot area of approximately 125.85 km2 is located inÇanakkale Province (Turkey) was selected as the study area anddepicted in Figure 1. The reason for selecting the pilot area wasthat it consists diverse LU/LC classes like industrial area, roads,residential area, airport, sea, forest, vegetation and barren land.The secondary reason of that selection is that acquisition ofLandsat-9 and PRISMA satellite images on the same day.2.3 MethodologyThis research consists of several steps, which are presented in aflow chart. (Figure 2). The details of the methods are explainedin this section.Figure 1. Upper left image belongs the map of Turkey, lowerleft image belongs to the map of Çanakkale Province, rightimage belongs to the Landsat-9 image true color composite,which was acquired on 18.01.2022, of the geographical locationof the study area.2.2 Data UsedThe study was based on two different types of satellite data forassessing the contribution of the spectral resolution on theaccuracy of LU/LC classification results. Hence, as satelliteimages which were acquired on the same day and have the samespatial resolution were selected. Landsat-9 and PRISMA satelliteimages were acquired on 18.01.2022 and included 11 and 235spectral bands with 30-m spatial resolution, respectively.Technical specifications of the PRISMA and Landsat-9 satelliteimages are shown in Table 1 (Url-2) and Table 2 (Url-1; Url-3;Url-4), respectively.Swath Width (km)30Hyperspectral : 30Ground Sample Distance (m)PAN : 5VNIR: 400 – 1010Spectral Coverage (nm)SWIR: 920 – 2500PAN: 400 – 700 nm240 bandsSpectral Resolution(bandwidth: 12 nm)Temporal ResolutionApproximately 29 daysTable 1. Data specifications of the PRISMA satellite images(Url-2).Figure 2. The flow chart of the methodology used.Since, Landsat-9 Level-2 satellite image and PRISMA Level 2Dsatellite images that have been atmospherically corrected wereused, no further atmospheric correction was applied to thesatellite images. Some of the spectral bands (1-5, 13-15, 20-21,35-37, 56-63 of VNIR Bands; 42-49, 168-173 of SWIR Bands)of PRISMA satellite image that included high level of noise wereeliminated. The composite image was generated from theselected proper spectral bands and defined as input data at thePRISMA image classification stage. On the other hand, coastal,blue, green, red, near infrared, shortwave infrared 1 andshortwave infrared 2 of Landsat-9 image were defined as inputdata at the Landsat-9 image classification stage. Ships and cloudswere masked in the satellite images. Radial Basis Function kernelSVM (Vapnik, 1979; Vapnik, 2013) that is a supervised machinelearning algorithm and also a powerful classifier (Khatami andMountrakis, 2012; Rana and Suryanarayana, 2020) was preferredto discriminate the complex classes. As a first step trainingdataset was collected in the classification stage. In the next step,This contribution has been es-XLVI-M-2-2022-197-2022 Author(s) 2022. CC BY 4.0 License.198
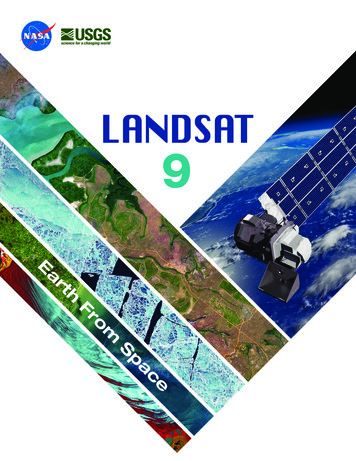
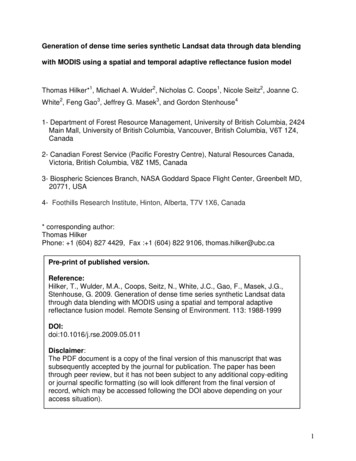
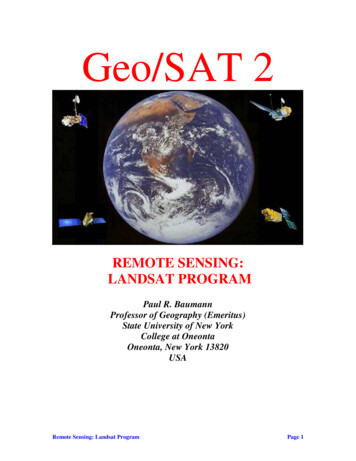
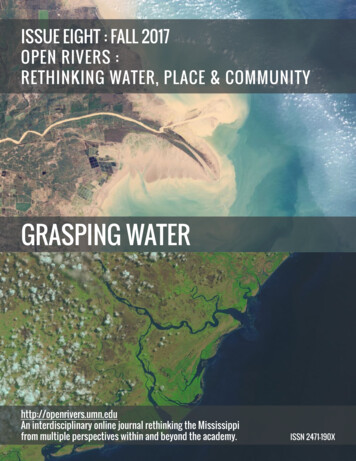
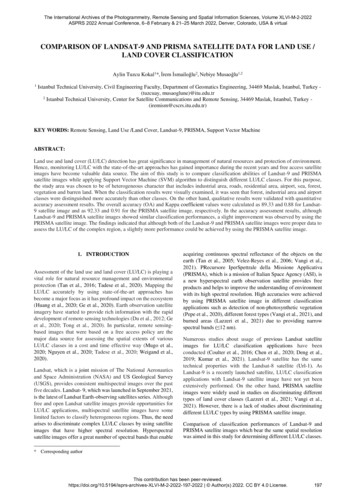
The International Archives of the Photogrammetry, Remote Sensing and Spatial Information Sciences, Volume XLVI-M-2-2022ASPRS 2022 Annual Conference, 6–8 February & 21–25 March 2022, Denver, Colorado, USA & virtualhyperparameters of the SVM classifier, which are cost andgamma parameters, were optimized (Mountrakis et al., 2011) byusing grid search method (Pedregosa et al., 2011). By usingoptimized hyperparameters, SVM algorithm was applied to thesemultispectral and hyperspectral satellite images to discriminatedifferent LU/LC classes.In assessing the accuracies of the results that were obtained byusing PRISMA and Landsat-9 satellite images, quantitative andqualitative analysis were performed. Error matrices weregenerated based on 300 test points to calculate accuracyassessment metrics of OA, kappa coefficient, producer’s anduser’s accuracy, and the classification results were evaluatedquantitatively. Error matrices of the classification results thatwere obtained by using Landsat-9 and PRISMA satellite imagesare shown in Table 3 and Table 4, respectively.Reference DataClassified DataClassIDV.A.F.S.I.A.R.R.A.B.L.V. A. F. S. I.A. R. R.A. B.L.41 0 0 0 0 0 0 30 30 0 0 6 1 0 01 0 36 0 0 0 0 00 0 3 33 0 0 0 00 2 0 0 28 3 1 00 0 0 0 1 31 1 00 0 0 0 0 1 31 01 0 0 0 0 1 7 38Figure 3. The LU/LC map that was produced by applying SVMto Landsat-9 satellite image.Table 3. The error matrix of the classification result that wasobtained by using Landsat-9 satellite image (V: Vegetation, A:Airport, F: Forest, S: Sea, I.A.: Industrial Area, R: Road, R. A.:Residential Area, B. L.: Barren Land).Reference DataClassified DataClassIDV.A.F.S.I.A.R.R.A.B.L.V. A. F. S. I.A. R. R.A. B.L.4100002000310010000038100000003300000500282000 10 01 00 02 032 22 370 0300000137Table 4. The error matrix of the classification result that wasobtained by using PRISMA satellite image (V: Vegetation, A:Airport, F: Forest, S: Sea, I.A.: Industrial Area, R: Road, R. A.:Residential Area, B. L.: Barren Land).3. RESULTS AND CONCLUSIONSThe LU/LC maps that were produced by applying SVM toLandsat-9 and PRISMA satellite images were shown in Figure 3and Figure 4, respectively.Figure 4. The LU/LC map that was produced by applying SVMto PRISMA satellite image.In the visual analysis (Figure 5), Google Earth images (Figure5.a, 5.d, 5.g) were used as reference data. It was observed thatthe airport was discriminated more accurately in the classificationresult (Figure 5.b), which was retrieved from the PRISMAsatellite image, than the classification result (Figure 5.c) whichwas retrieved from the Landsat-9 satellite image. Similarly,industrial area was distinguished more accurately by usingPRISMA image (Figure 5.h), (Figure 5.i). On the other hand,roads were classified more accurately with Landsat-9 satelliteimage as shown in Figure 5.f, compared to PRISMAclassification result that is shown in Figure 5.e.This contribution has been es-XLVI-M-2-2022-197-2022 Author(s) 2022. CC BY 4.0 License.199
The International Archives of the Photogrammetry, Remote Sensing and Spatial Information Sciences, Volume XLVI-M-2-2022ASPRS 2022 Annual Conference, 6–8 February & 21–25 March 2022, Denver, Colorado, USA & virtualREFERENCESChen, C., Chen, H., Liao, W., Sui, X., Wang, L., Chen, J., Chu,Y., 2020. Dynamic monitoring and analysis of land-use and landcover change using Landsat multitemporal data in the ZhoushanArchipelago, China. IEEE Access, 8, pp. 210360-210369.Coulter, L. L., Stow, D. A., Tsai, Y. H., Ibanez, N., Shih, H. C.,Kerr, A., Benza, M., Weeks, J.R., Mensah, F., 2016.Classification and assessment of land cover and land use changein southern Ghana using dense stacks of Landsat 7 ETM imagery. Remote Sensing of Environment, 184, pp. 396-409.Deng, Z., Zhu, X., He, Q., Tang, L., 2019. Land use/land coverclassification using time series Landsat 8 images in a heavilyurbanized area. Advances in Space Research, 63(7), pp. 21442154.Figure 5. Magnified images of a, d, g reference maps; b, e, h theclassification results that were obtained by PRISMA satelliteimage; c, f, i the classification results that were obtained byLandsat-9 satellite image.Kappa coefficient values of the SVM classification resultsobtained from Landsat-9 and PRISMA were calculated as 0.88and 0.91, OAs were calculated as 89.33% and 92.33%respectively. The accuracy assessment results are given in Table5.ClassesVegetationAirportForestSeaIndustrial AreaRoadResidential AreaBarren LandOA 100.0090.2492.330.91Table 5. The results of the accuracy assessment metrics.In the accuracy assessment results, similar results were obtainedfrom these two different classifications. However, due its higherspectral resolution, the classification capability of the PRISMAsatellite image was observed as slightly higher than the Landsat9 satellite image.ACKNOWLEDGEMENTSThis study was carried out using PRISMA Products, of theItalian Space Agency (ASI), delivered under an ASI License touse. The authors would like to acknowledge the financial supportof Istanbul Technical University Scientific Projects Office (BAP)under project number MDK-2021-43054 and also to TheScientific and Technological Research Council of Turkey(TÜBİTAK) Project under project number 121G142.Du, P., Xia, J., Zhang, W., Tan, K., Liu, Y., Liu, S., 2012.Multiple classifier system for remote sensing imageclassification: A review. Sensors, 12(4), pp. 4764-4792.Ge, G., Shi, Z., Zhu, Y., Yang, X., Hao, Y., 2020. Land use/coverclassification in an arid desert-oasis mosaic landscape of Chinausing remote sensed imagery: Performance assessment of fourmachine learning algorithms. Global Ecology and Conservation,22, e00971.Huang, Z., Qi, H., Kang, C., Su, Y., Liu, Y., 2020. An ensemblelearning approach for urban land use mapping based on remotesensing imagery and social sensing data. Remote Sensing, 12(19),3254.Khatami, R., Mountrakis, G., 2012. Implications of classificationof methodological decisions in flooding analysis from hurricaneKatrina. Remote Sensing, 4(12), pp. 3877–3891.Kumar, P., Dobriyal, M., Kale, A., Pandey, A.K., 2021.Temporal dynamics change of land use/land cover in Jhansidistrict of Uttar Pradesh over past 20 years using Landsat TM,ETM and OLI sensors. Remote Sensing Applications: Societyand Environment, 23, 100579.Lazzeri, G., Frodella, W., Rossi, G., Moretti, S., 2021.Multitemporal mapping of post-fire land cover usingmultiplatform PRISMA Hyperspectral and Sentinel-UAVmultispectral data: Insights from case studies in Portugal andItaly. Sensors, 21(12), 3982.Mountrakis, G., Im, J., Ogole, C., 2011. Support vector machinesin remote sensing: A review. ISPRS Journal of Photogrammetryand Remote Sensing, 66(3), pp. 247-259.Mugo, R., Waswa, R., Nyaga, J. W., Ndubi, A., Adams, E. C.,Flores-Anderson, A. I., 2020. Quantifying land use land coverchanges in the Lake Victoria basin using satellite remote sensing:The trends and drivers between 1985 and 2014. Remote Sensing,12(17), 2829.This contribution has been es-XLVI-M-2-2022-197-2022 Author(s) 2022. CC BY 4.0 License.200
The International Archives of the Photogrammetry, Remote Sensing and Spatial Information Sciences, Volume XLVI-M-2-2022ASPRS 2022 Annual Conference, 6–8 February & 21–25 March 2022, Denver, Colorado, USA & virtualNguyen, L. H., Joshi, D. R., Clay, D. E., Henebry, G. M., 2020.Characterizing land cover/land use from multiple years ofLandsat and MODIS time series: A novel approach using landsurface phenology modeling and random forest classifier.Remote Sensing of Environment, 238, /landsat-9,retrieved date 19 March /PRISMA%20Product%20Specifications Is2 3.pdf, retrieved date 14 April les/LSDS-2082 L9-Data-UsersHandbook v1.pdf, retrieved date 14 April 2022.Url-4: iant.pdf, retrieved date 14 April 2022.Vapnik, V., 1979. Estimation of dependences Based onEmpirical Data. [in Russian]. Nauka, Moscow. (Englishtranslation: Springer-Verlag, New York).Vapnik, V., 2013. The Nature of Statistical Learning Theory.Springer Science & Business Media, New York.Velez-Reyes, M., Goodman, J.A., Castrodad-Carrau, A.,Jiménez-Rodriguez, L.O., Hunt, S.D., Armstrong, R., 2006.Benthic habitat mapping using hyperspectral remote sensing.Remote Sensing of the Ocean, Sea Ice, and Large Water Regions,Stockholm, Sweden, 6360, 63600C1-63600C11. doi:10.1117/12.692996Weigand, M., Staab, J., Wurm, M., Taubenböck, H., 2020.Spatial and semantic effects of LUCAS samples on fullyautomated land use/land cover classification in high-resolutionSentinel-2 data. International Journal of Applied EarthObservation and Geoinformation, 88, 102065.Pedregosa, F., Varoquaux, G., Gramfort, A., Michel, V., Thirion,B., Grisel, O., Blondel, M., Prettenhofer, P., Weiss, R., Dubourg,V., Vanderplas, J., Passos, A., Cournapeau, D., Brucher , M.,Perrot, M., Duchesnay, E., 2011. Scikit-learn: Machine learningin Python. The Journal of Machine Learning Research, 12, pp.2825-2830.Pepe, M., Pompilio, L., Gioli, B., Busetto, L., Boschetti, M.,2020. Detection and classification of non-photosyntheticvegetation from PRISMA hyperspectral data in croplands.Remote Sensing, 12(23), 3903.Rana, V.K., Suryanarayana, T.M.V., 2020. Performanceevaluation of MLE, RF and SVM classification algorithms forwatershed scale land use/land cover mapping using sentinel 2bands. Remote Sensing Applications: Society and Environment,19, 100351.Tadese, M., Kumar, L., Koech, R., Kogo, B. K., 2020. Mappingof land-use/land-cover changes and its dynamics in Awash RiverBasin using remote sensing and GIS. Remote SensingApplications: Society and Environment, 19, 100352.Tan, K., Wan, Y., Yang, Y., Duan, Q., 2005. Study ofhyperspectral remote sensing for archaeology. Journal ofInfrared and Millimeter Waves, [in Chinese], 24(6), 437-440.Tan, Y., Bai, B., Mohammad, M. S., 2016. Time series remotesensing based dynamic monitoring of land use and land coverchange. In: 2016 4th International Workshop on EarthObservation and Remote Sensing Applications SA.2016.7552797.Tong, X. Y., Xia, G. S., Lu, Q., Shen, H., Li, S., You, S., Zhang,L., 2020. Land-cover classification with high-resolution remotesensing images using transferable deep models. Remote Sensingof Environment, 237, 111322.Vangi, E., D’Amico, G., Francini, S., Giannetti, F., Lasserre, B.,Marchetti, M., Chirici, G., 2021. The new hyperspectral satellitePRISMA: Imagery for forest types discrimination. Sensors,21(4), 1182.This contribution has been es-XLVI-M-2-2022-197-2022 Author(s) 2022. CC BY 4.0 License.201
COMPARISON OF LANDSAT-9 AND PRISMA SATELLITE DATA FOR LAND USE / LAND COVER CLASSIFICATION Aylin Tuzcu Kokal1*, İrem İsmailoğlu2, Nebiye Musaoğlu1,2 1 Istanbul Technical University, Civil Engineering Faculty, Department of Geomatics Engineering, 34469 Maslak, Istanbul, Turkey - (tuzcuay, musaoglune)@itu.edu.tr