Transcription
An In-Depth Look at DeleveragingsRay DalioFebruary, 2012The purpose of this paper is to show the compositions of past deleveragings and, through this process, to conveyin-depth, how the deleveraging process works.The deleveraging process reduces debt/income ratios. When debt burdens become too large, deleveragingsmust happen. These deleveragings can be well managed or badly managed. Some have been very ugly (causinggreat economic pain, social upheaval and sometimes wars, while failing to bring down the debt/income ratio),while others have been quite beautiful (causing orderly adjustments to healthy production-consumptionbalances in debt/income ratios). In this study, we are going to review the mechanics of deleveragings byshowing how a number of past deleveragings transpired in order to convey that some are ugly and some arebeautiful. What you will see is that beautiful deleveragings are well balanced and ugly ones are badlyimbalanced. The differences between how deleveragings are resolved depend on the amounts and paces of 1)debt reduction, 2) austerity, 3) transferring wealth from the haves to the have-nots and 4) debt monetization.What we are saying is that beautiful ones balance these well and ugly ones don’t and what we will show below ishow.Before we examine these, we will review the typical deleveraging process.The Typical Deleveraging ProcessTypically, deleveragings are badly managed because they come along about once in every lifetime and policymakers haven't studied them. As a result, they usually set policies like blind men trying to cook on a hot stove,through a painful trial and error process in which the pain of their mistakes drives them away from the badmoves toward the right moves. Since everyone eventually gets through the deleveraging process, the onlyquestion is how much pain they endure in the process. Because there have been many deleveragings throughouthistory to learn from, and because the economic machine is a relatively simple thing, a lot of pain can be avoidedif they understand how this process works and how it has played out in past times. That is the purpose of thisstudy.As previously explained, the differences between deleveragings depend on the amounts and paces of 1) debtreduction, 2) austerity, 3) transferring wealth from the haves to the have-nots, and 4) debt monetization. Eachone of these four paths reduces debt/income ratios, but they have different effects on inflation and growth. Debtreduction (i.e., defaults and restructurings) and austerity are both deflationary and depressing while debtmonetization is inflationary and stimulative. Ugly deleveragings get these out of balance while beautiful onesproperly balance them. In other words, the key is in getting the mix right. 2012 Bridgewater Associates, LP1
Typically, in response to a debt crisis the going to these four steps takes place in the following order:1)At first, problems servicing debt and the associated fall off in debt growth cause an economiccontraction in which the debt/income ratios rise at the same time as economic activity andfinancial asset prices fall. We will call this phase an “ugly deflationary deleveraging”. Debtreduction (i.e., defaults and restructurings) and austerity without material debt monetizationcharacterize this phase. During this period, the fall in private sector credit growth and the tightnessof liquidity lead to declines in demand for goods, services and financial assets. The financial bubblebursts when there is not enough money to service the debt and debt defaults and restructurings hitpeople, especially leveraged lenders (banks), like an avalanche that causes fears. These justifiedfears feed on themselves and lead to a liquidity crisis. As a result, policy makers find themselves in amad scramble to contain the defaults before they spin out of control. This path to reducing debtburdens (i.e., debt defaults and restructurings) must be limited because it would otherwise lead to aself-reinforcing downward spiral in which defaults and restructurings can be so damaging toconfidence that, if let go, they might prevent faith and recoveries from germinating for years.Defaults and restructurings cannot be too large or too fast because one man's debts are anotherman's assets, so the wealth effect of cutting the value of these assets aggressively can be devastatingon the demands for goods, services and investment assets. Since in order to reduce debt servicepayments to sustainable levels the amount of write-down must equal what is required so the debtorwill be able to pay (e.g., let's say it’s 30% less), a write-down will reduce the creditor's asset value bythat amount (e.g. 30%). While 30% sounds like a lot, since many entities are leveraged, the impactson their net worths can be much greater. For example, the creditor who is leveraged 2:1 wouldexperience a 60% decline in his net worth. Since banks are typically leveraged about 12 or 15:1, thatpicture is obviously devastating for them. This is usually apparent from the outset of thedeleveragings. Since the devastating forcefulness of the wave of defaults that occurs in adeleveraging is apparent from the outset, policy makers are typically immediately motivated tocontain the rate of defaults, though they typically don't know the best ways to do that.In reaction to the shock of the debt crisis, policy makers typically try austerity because that's theobvious thing to do. Since it is difficult for the debtor to borrow more, and since it’s clear that healready has too much debt, it’s obvious that he has to cut his spending to bring it back in line with hisincome. The problem is that one man's spending is another man's income, so when spending is cut,incomes are also cut, so it takes an awful lot of painful spending cuts to make significant reductionsto debt/income ratios. Normally policy makers play around with this path for a couple of years, getburned by the results, and eventually realize that more must be done because the deflationary anddepressing effects of both debt reduction and austerity are too painful. That leads them to go to thenext phase in which “printing money” plays a bigger role. We don’t mean to convey that debtreductions and austerity don’t play beneficial roles in the deleveraging process because they do – justnot big enough roles to make much of a difference and with too painful results unless balanced with“printing money/monetization”.2) In the second phase of the typical deleveraging the debt/income ratios decline at the sametime as economic activity and financial asset prices improve. This happens because there isenough “printing of money/debt monetization” to bring the nominal growth rate above thenominal interest rate and a currency devaluation to offset the deflationary forces. This createsa “beautiful deleveraging”. The best way of negating the deflationary depression is for the centralbank to provide adequate liquidity and credit support and, depending on different key entities’ needfor capital, for the central government to provide that too. This takes the form of the central bankboth lending against a wider range of collateral (both lower quality and longer maturity) and buying(monetizing) lower-quality and/or longer-term debt. This produces relief and, if done in the rightamounts, allows a deleveraging to occur with positive growth. The right amounts are those that a)neutralize what would otherwise be a deflationary credit market collapse and b) get the nominalgrowth rate marginally above the nominal interest rate to tolerably spread out the deleveragingprocess. At such times of reflation, there is typically currency weakness, especially against gold, but 2012 Bridgewater Associates, LP2
this will not produce unacceptably high inflation because the reflation is simply negating thedeflation. History has shown that those who have done it quickly and well (like the US in 2008/9)have derived much better results than those who did it late (like the US in 1930-33). However, thereis such a thing as abusive use of stimulants. Because stimulants work so well relative to thealternatives, there is a real risk that they can be abused, causing an “ugly inflationary deleveraging”.3) When there is too much “printing of money/monetization” and too severe a currencydevaluation (which are reflationary) relative to the amounts of the other three alternatives“ugly inflationary deleveragings” can occur. When these happen a) they either occur quickly incountries that don’t have reserve currencies, that have significant foreign currency denominateddebts and in which the inflation rate is measured in their rapidly depreciating local currency, and b)they can occur slowly and late in the deleveraging process of reserve currency countries, after a longtime and a lot of stimulation that is used to reverse a deflationary deleveraging.By the way, transfers of wealth from the have to the have-nots typically occur in many forms (e.g.,increased taxes on the wealthy, financial support programs such as those the "rich” European countriesare providing to the overly indebted ones, etc.) throughout the process, but they rarely occur in amountsthat contribute meaningfully to the deleveraging (unless there are "revolutions").Now let's take a look at some past deleveragings so we can see these things happening.Past DeleveragingsWhile there are dozens of deleveragings that we could have picked, we chose six – 1) the US in the 1930s, 2) theUK in the '50s and '60s, 3) Japan over the past two decades, 4) the US 2008-now, 5) Spain now and 6) theWeimar Republic in the 1920s – because they are both important and different in interesting ways. As you willsee, while they are different because the amounts and paces of the four paths to deleveraging were different,“the economic machines” that drove the outcomes were basically the same.We are going to begin by looking at the first five and then turn our attention to the Weimar Republic’sinflationary deleveraging.We will break these down into three groups, which we will call:1)“ugly deflationary deleveragings” (which occurred before enough money was “printed” anddeflationary contractions existed and when nominal interest rates were above nominal growth rates),2) “beautiful deleveragings” (those in which enough “printing” occurred to balance the deflationaryforces of debt reduction and austerity in a manner in which there is positive growth, a fallingdebt/income ratio and nominal GDP growth above nominal interest rates), and3) “ugly inflationary deleveragings” (in which the “printing” is large relative to the deflationary forcesand nominal growth through monetary inflation and interest rates are in a self-reinforcing upwardspiral). 2012 Bridgewater Associates, LP3
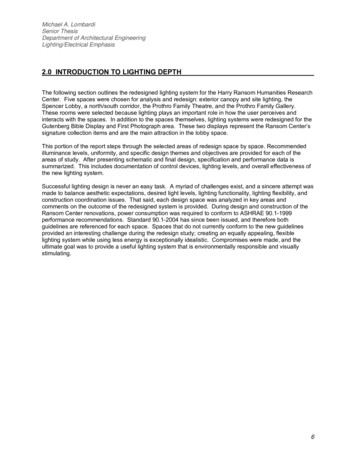
The Ugly Deflationary Deleveragings (i.e., when the economy was bad while the debt/incomeratio rose)As shown below, in all of these cases, a) money printing was limited, b) nominal growth was below nominalrates, c) the currency was generally strong, and d) the debt/income ratios rose because of the combination ofinterest payment costs and nominal incomes falling or stagnating.US Depression:1930-1932Monetary Policy in DeleveragingsNominal GDP Growth - Gov't Bond Yield-20.4%Nominal GDP Growth-17.0%GDP Deflator-8.0%Real-9.0%Gov't Bond Yield, Avg.3.4%M0 Growth % GDP, Avg. Ann.0.4%Central Bank Asset Purchases & Lending, 10yr Dur., Ann.0.4%FX v. Price of Gold ( means rally v. gold), Ann0.0%FX v. USD (TWI for USA), Ann2.9%Total Debt level as % GDP: Starting Point155%Total Debt level as % GDP: Ending Point252%Change in Total Debt (% GDP)96%Change in Total Debt (% GDP), Ann.32%*For ESP, showing ECB lending to ESP, not duration .7%0.1%-3.5%2.9%403%498%95%4%US:July 2008-Feb s: Global Financial Data & BW EstimatesThe following charts attribute the changes in debt/GDP. More specifically, a black dot conveys the totalannualized change in debt/GDP. Each bar breaks up the attribution of this change into the following pieces:changes in GDP (i.e., income) and changes in the nominal value of the debt stock. Income changes are brokeninto (1) real income changes and (2) inflation. A decline in real GDP shows up as a positive contribution todebt/GDP in the shaded region, while an increase in inflation shows up as a negative contribution. Changes innominal debt levels are broken into (3) defaults, (4) the amount of new borrowing required just to make interestpayments, and (5) whatever increases or decreases in borrowing that occur beyond that. So, defaults show upas negatives, while interest payments show up as positives and new borrowing beyond interest payments aspositives or negatives (depending on whether new debt was created or paid down).Periods Where Debt / GDP Rose: Attribution of Change in Debt Burdens (Annual)Real GrowthInflationInterest PaymentsNew Borrow. Above Int. PaymentsDefaultsTotal Change in Debt60%Change in Debt % GDP50%40%30%20%10%0%-10%-20%-30%US Depression:1930-1932 2012 Bridgewater Associates, LPJapan:1990-PresentUS:July 2008Feb 2009(Pre-QE)4Spain
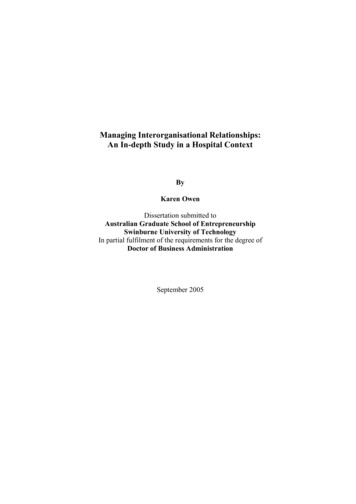
The Beautiful Deleveragings (i.e., when the economy was growing in a balanced way with thedebt/income ratio declining)As shown below, in all of these cases, money printing and currency devaluations were sizable, nominal growthrates were pushed above nominal interest rates and the debt/income ratios fell. During the reflation periods, arecovery in nominal incomes lessened the debt/income burdens. Naturally, in cases in which the downturns thatpreceded these periods were very deep (e.g., 1930-32 in the US) the rebounds were greater.US .0%-1.6%252%168%-84%-17%Monetary Policy in DeleveragingsNominal GDP Growth - Gov't Bond YieldNominal GDP GrowthGDP DeflatorRealGov't Bond Yi
Ray Dalio February, 2012 The purpose of this paper is to show the compositions of past deleveragings and, through this process, to convey in-depth, how the deleveraging process works. The deleveraging process reduces debt/income ratios. When debt burdens become too large, deleveragings must happen. These deleveragings can be well managed or badly managed. Some have been very ugly (causing .