Transcription
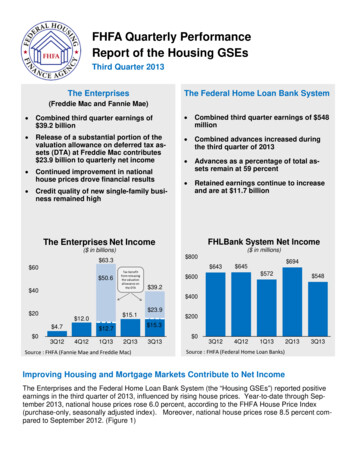
FHFA Quarterly PerformanceReport of the Housing GSEsThird Quarter 2013The Federal Home Loan Bank SystemThe Enterprises(Freddie Mac and Fannie Mae) Combined third quarter earnings of 39.2 billion Combined third quarter earnings of 548million Release of a substantial portion of thevaluation allowance on deferred tax assets (DTA) at Freddie Mac contributes 23.9 billion to quarterly net income Combined advances increased duringthe third quarter of 2013 Continued improvement in nationalhouse prices drove financial results Credit quality of new single-family business remained high Advances as a percentage of total assets remain at 59 percent Retained earnings continue to increaseand are at 11.7 billionFHLBank System Net IncomeThe Enterprises Net Income( in millions)( in billions) 800 63.3 643 60 50.6 40Tax benefitfrom releasingthe valuationallowance onthe DTA 694 645 572 600 548 39.2 400 20 12.0 4.7 0 15.13Q121Q13 200 15.3 12.74Q12 23.92Q13Source : FHFA (Fannie Mae and Freddie Mac)3Q13 03Q124Q121Q132Q133Q13Source : FHFA (Federal Home Loan Banks)Improving Housing and Mortgage Markets Contribute to Net IncomeThe Enterprises and the Federal Home Loan Bank System (the “Housing GSEs”) reported positiveearnings in the third quarter of 2013, influenced by rising house prices. Year-to-date through September 2013, national house prices rose 6.0 percent, according to the FHFA House Price Index(purchase-only, seasonally adjusted index). Moreover, national house prices rose 8.5 percent compared to September 2012. (Figure 1)
FHFA Quarterly Performance Report of the Housing GSEs, Third Quarter 2013Key Market DriversFigure 130%FHFA House Price Index (through September 2013)Year to Date Price Change25%Twelve-Month Price %10%11.5%6.0%5%0%Source: FHFAU.S.ArizonaCaliforniaFigure 2FloridaNevadaAverage Interest Rate on a 30 Year 4.073.473.0Source: Freddie Mac Primary Mortgage Market Survey, monthly averageFigure 34.0Swap Rates3.010-Yr2.05-Yr1.01-Yr0.0Swap rates charted are for a fixed rate payer in return for receiving three-month LIBOR .Source: Federal ReserveFederal Housing Finance Agency2
FHFA Quarterly Performance Report of the Housing GSEs, Third Quarter 2013The EnterprisesDeferred Tax Assets Valuation Allowance Releases Boost EarningsIn the third quarter of 2013, combined net income at the Enterprises totaled 39.2 billion,driven by rising house prices, albeit to a lesserextent compared to the prior quarter, coupledwith the continued decline in the number of delinquent loans guaranteed by the Enterprises.The Enterprises also benefited from recoverieson counterparty settlement agreements with anumber of financial institutions during the quarter. In addition, Freddie Mac released a substantial portion of its valuation allowance on deferred tax assets (DTA), resulting in the recognition of a 23.9 billion tax benefit.Over the first three quarters of 2013, the Enterprises reported combined net income of 117.6billion, buoyed by each Enterprise releasing asubstantial portion of its DTA valuation allowance in 2013. The release of the DTA valuationallowance at Fannie Mae and Freddie Mac contributed 50.6 billion and 23.9 billion, respectively, to year-to-date net income.Loan Loss Reserves Continue to Fallduring the third quarter of 2013. (Figure 4) Thereduction in loan loss reserves led to the Enterprises reporting a benefit for credit losses (i.e., anegative provision for credit losses) of 3.7 billion. This marks the fourth consecutive quarterthat both Enterprises reported a benefit for credit losses.Since December 31, 2012, combined loan lossreserves at the Enterprises declined 21% or 20.1 billion to 73.4 billion.Further Decline in Delinquent LoanCountsThe Enterprises’ seriously delinquent loan countdeclined by 8 percent to approximately 724,000loans as of September 30, 2013 compared toapproximately 783,000 loans as of June 30,2013. Since September 30, 2012, the numberof seriously delinquent loans at the Enterprisesdeclined by 25 percent or approximately245,000 loans. (Figure 5)Credit Quality of New Single-FamilyBusiness Remains HighFurthermore, the number of delinquent loanscontinues to trend downward at the Enterprises,and this, coupled with stronger credit characteristics of newly acquired loans, has improvedportfolio quality at the Enterprises.The credit quality of new Single-Family businessremained high in the first nine months of 2013.The average credit score for new single-familybusiness volume was 754 for Fannie Mae and750 for Freddie Mac, down from the scores reported at the end of 2012 of 761 and 756, respectively. The decline in the average creditscores at the Enterprises has been driven bythe reduction in refinance activity and increasein home purchases. Purchases of nontraditional and higher-risk mortgages continuedto be minimal, and the average loan to value(LTV) ratio for new business remained unchanged as borrowers continued to use the Enterprises’ refinance programs, including theHome Affordable Refinance Program (HARP),targeting deeply underwater borrowers.These factors resulted in a 6.1 billion decreasein the Enterprises’ combined loan loss reservesThe post-conservatorship business (2009 topresent) continues to become a larger piece ofRising house prices during the quarter continued to reduce expected defaults and the level ofcredit losses associated with defaults on mortgages guaranteed by the Enterprises, particularly in those states with the highest severity levelsin recent years, such as Arizona, California, Nevada, and Florida. The considerable improvement in house prices over the past year has resulted in lower severity of credit losses on thedisposition of REO properties by the Enterprises. (Figure 1)Federal Housing Finance Agency3
FHFA Quarterly Performance Report of the Housing GSEs, Third Quarter 2013the total single-family portfolios as new business is added and homeowners take advantage of low interest rates to refinance existing loans. This post-conservatorship businessnow accounts for approximately 74 percent ofthe total single-family portfolio at both Enterprises. Serious delinquency rates for thesenewer vintages remain at or below one percent.However, serious delinquency rates remain at aheightened level for loans originated between2005 and 2008, which account for approximately 16 percent of the single-family portfolio.Rise in Interest Rates Contributes toNet IncomeProceeds from Recoveries on Counterparty Settlement Agreements Contributes to Net IncomeIncrease in the Sale of Non-AgencySecuritiesIn the third quarter of 2013, FHFA, as conservator of the Enterprises, reached a settlementwith UBS Americas, Inc. (UBS) to cover claimsin connection with the purchase of private-labelsecurities. The earnings impact of this settlement was 885 million of additional income(Fannie Mae— 415 million, Freddie Mac— 470 million) during the quarter.Freddie Mac also announced settlements related to recoveries from repurchase agreementswith Wells Fargo, Citigroup, and SunTrust.These banks agreed to pay Freddie Mac an aggregate of approximately 1.3 billion to settleFreddie Mac’s claims related to representationsand warranties on single-family loans funded byFreddie Mac between 2000 and 2012. Thesesettlements contributed 0.9 billion to FreddieMac’s benefit for credit losses.Additionally, Fannie Mae entered into a resolution agreement related to repurchase requestswith CitiMortgage. Under the resolution agreement, CitiMortgage agreed to pay Fannie Maeapproximately 1 billion to resolve substantiallyall of Fannie Mae’s outstanding repurchase requests with CitiMortgage.The Enterprises reported combined fair valuegains on derivatives, which are used to hedgeinterest rate risk, of 0.5 billion in the third quarter of 2013 and 4.0 billion for the first ninemonths of 2013. The increase in swap ratesdrove the increase in the fair value of pay-fixedderivatives, during the respective periods.(Figure 3)In the third quarter of 2013, the Enterprises reported combined sales of non-Agency securities totaling 23.7 billion, resulting in gains ofapproximately 1.1 billion. Fannie Mae sold 15.9 billion of non-Agency securities, or 88%of its year-to-date total, and Freddie Macsold 7.8 billion of non-Agency securities, or67% of its year-to-date total.Refinance Activity Declines But Continues To Drive Total New BusinessVolumeIn the first nine months of 2013, refinances accounted for 74 percent and 76 percent, respectively, of single-family new business volume atFannie Mae and Freddie Mac. Refinance activity decreased in the third quarter as mortgagerates rose. (Figure 2) Similarly, HARP volumedecreased to approximately 204,000 refinancesin the third quarter, compared to approximately280,000 refinances in the second quarter of2013. However, HARP volume as a percentage of total refinance volume remained relatively constant at 23% during the quarter.The Enterprises and Ginnie Mae continue toaccount for essentially all issuances of mortgage-backed securities (MBS). In the first ninemonths of 2013, the Enterprises accounted for 1,027 billion or 77 percent of MBS issuances.(Figure 6)Federal Housing Finance Agency4
FHFA Quarterly Performance Report of the Housing GSEs, Third Quarter 2013EnterprisesFigure 4Figure 5 Seriously Delinquent LoansLoan Loss Reserves( in billions)(count in thousands) 116.4 120 105.21600 1511 100.7 100 80 79.51200 73.4 60800969783724 40400 200 0Source: FHFA (Fannie Mae and Freddie Mac)Source: FHFA (Fannie Mae and Freddie Mac)MBS Issuance VolumeFigure 6( in billions)90% 1,00082%71%Enterprise Issuance Volumeas % of Total Issuances75% 81080%70% 75060%50% 50040% 398 344 25030%20%Total MBS Issuance(Enterprises, Ginnie Mae and Other)10%Issuance figures exclude MBS issued backed by assets previously held in the Enterprises’ portfolios.0% 0Source: Inside Mortgage Finance, Inside MBS & ABS, Enterprises' Monthly Volume Summaries.REO InventoryFigure 7242250(Count in thousands)200164158150142148100500Source: FHFA (Fannie Mae and Freddie Mac)Federal Housing Finance Agency5
FHFA Quarterly Performance Report of the Housing GSEs, Third Quarter 2013Conservator’s Update on Fannie Mae and Freddie MacAt the end of 2007, the Enterprises had 71 billion of combined capital. From the end of 2007through the third quarter of 2013, the Enterprises’ combined charges against capital totaled 221 billion, requiring Treasury support of 187.5 billion through draws under the SeniorPreferred Stock Purchase Agreements. Neither Enterprise has required funding from theTreasury over the past six quarters.The Single-Family Credit Guarantee segmentcontinues to be the largest contributor to charges against capital, accounting for 158 billion,or 71 percent of the cumulative change in capital since 2007.Senior preferred dividends on Treasury drawsaccounted for 146 billion, or 66 percent of thecumulative change in capital, which will increase in the next quarter as income generatedin the third quarter is paid out as dividends.Combined net worth totaled 45.0 billion as ofSeptember 30, 2013, 39.0 billion of which willbe paid out as dividends by December 31,2013.The Enterprises generated 51 billion in totalcomprehensive income from the Single-FamilyGuarantee Segment in the first nine months of2013. At Fannie Mae, the bulk of net incomewas the result of a tax benefit of 32 billion, reported in the first quarter, due to the release ofa substantial portion of its valuation allowanceagainst deferred tax assets (DTA).Credit losses from non-traditional and higherrisk mortgages acquired in 2006 and 2007 continue to account for a disproportionate share ofcredit losses.Press ReleasesNOV05 2013FHFA announced that it has directedFannie Mae and Freddie Mac to restrictlender-placed insurance practices including prohibiting servicers from being reimbursed for expenses associated withcaptive reinsurance arrangements.OCT25 2013FHFA announced it reached a settlementwith J.P. Morgan Chase & Co. and related companies for 4 billion to addressclaims of alleged violations of federal andstate securities laws in connection withprivate-label, residential mortgagebacked securities (PLS) purchased byFannie Mae and Freddie Mac. In separate settlements totaling approximately 1.1 billion, J.P. Morgan Chase & Co.also resolved representation and warranty claims with Fannie Mae and FreddieMac related to single-family mortgagepurchases by the two companies.OCT07 2013FHFA announced significant steps in theorganization of a joint venture betweenFannie Mae and Freddie Mac to establish a common securitization platform.OCT07 2013FHFA announced that Fannie Mae andFreddie Mac have completed more than2.9 million foreclosure prevention actionssince the start of conservatorship in2008. These actions have helped approximately 2.4 million borrowers stay intheir homes, including more than 1.4 million who received permanent loan modifications. During the first half of 2013,Fannie Mae and Freddie Mac completedmore than 247,000 foreclosure prevention actions, 117,000 of these in the second quarter.SEP23 2013FHFA launched a nationwide campaignto inform homeowners about the HomeAffordable Refinance Program (HARP).As part of this campaign, FHFA haslaunched a new website, www.HARP.govand is working with mortgage companiesacross the U.S. to help reach homeowners who may qualify.The Investments and Capital Markets segments generated 36 billion in total comprehensive income in the first nine months of 2013 asboth Enterprises continued to benefit from lowfunding costs driven by the low interest rate environment.Federal Housing Finance Agency6
FHFA Quarterly Performance Report of the Housing GSEs, Third Quarter 2013Capital Changes - EnterprisesFannie Mae( in billions)Beginning Capital120082010 442011 0YTD2012 3Q13 0 72008 3Q13 44Equity Issuance2Available CapitalCapital ChangeSingle-Family Comprehensive Income (Loss)3Multifamily Comprehensive Income (Loss)3,4Investments Comprehensive Income (Loss)3,4OtherSenior Preferred dividends5Total Capital Change67 51 0 0 7-7 51( 117)(6)(0)(8)(10)( 141)( 24)110(3)(10)( 26) 6216(5)(12) 7 46924(1)(74) 4( 89)549(16)(105)( 156)Capital surplus (deficit)Treasury Senior Preferred draw7( 90) 90.2( 26) 25.920082010 272011 0-- 7 0.0 12 0.0( 105) 116.1YTD2012 3Q13 0 92008 3Q13 27Freddie Mac( in billions)Beginning Capital1Equity Issuance2Available CapitalCapital ChangeSingle-Family Comprehensive Income (Loss)3Multifamily Comprehensive Income (Loss)3,4Investments Comprehensive Income (Loss)3,4OtherSenior Preferred dividends5Total Capital Change6Capital surplus (deficit)Treasury Senior Preferred draw7----- 27 0 0 9 27( 64)12(14)(15)(10)( 91)( 10)260(6)( 8)( 0)4111(7) 9 511224(17) 25( 69)191610(41)( 65)( 64) 63.7( 8) 7.6 9 0.0 33 0.0( 38) 71.320082010 712011 0YTD2012 3Q13 0 162008 3Q13 71Enterprises Combined( in billions)Beginning Capital1Equity Issuance2Available Capital (Pre-Conservatorship)Capital ChangeSingle-Family Comprehensive Income (Loss)3Multifamily Comprehensive Income (Loss)3,4Investments Comprehensive Income (Loss)3,4OtherSenior Preferred dividends5Total Capital Change6Capital surplus (deficit)Treasury Senior Preferred draw77--- 78 0 0 16( 181)6(14)(22)(20)( 232)( 34)316(3)(16)( 34) 6627(4)(19) 16 51113623(91) 29( 154) 153.9( 34) 33.6 16 0.0 45 0.0Federal Housing Finance Agency7 78( 158)2565(6)(146)( 221)NotesTotals may not sum due to rounding.1 Capital is defined as stockholders'equity. In 2011 and 2012, beginningcapital includes requested Treasurydraws pertaining to the fourth quarterof the prior year.2 Fannie Mae's figure includescommon and preferred stock issuancepre-conservatorship.3 Segment comprehensive income(loss) represents net income (loss)plus total other comprehensiveincome (loss) by segment.4 Freddie Mac includes net interestincome on investments in multifamilyloans, net interest income oncommercial mortgage-backedsecurities, and non-interest rate riskrelated unrealized gains (losses) oncommercial mortgage-backedsecurities and held-for-sale loans inMultifamily Comprehensive Income(Loss), while Fannie Mae includessimilar items in Investmentscomprehensive income. Investmentscomprehensive income includes theimpact of accounting changes forsecurity impairments.5 Senior Preferred Dividends from2008 - 2012 were calculated byapplying an annual dividend rate of10% to the aggregate liquidationpreference of the senior preferredstock. Effective January 1, 2013,dividends payable are determinedbased on the Enterprises' net worthas of the end of the immediatelypreceding fiscal quarter less theapplicable capital reserve.6 Included in total capital change forboth Enterprises are lossesattributable to the writedown of lowincome housing tax credits (LIHTC)investments to zero in the fourthquarter of 2009. The writedown ofthese LIHTC losses for Fannie Maeand Freddie Mac were 5 billion and 3 billion, respectively, and areincluded in Other. The establishmentof a deferred tax asset valuationallowance, which reduced capital by 21 billion for Fannie Mae and 14billion for Freddie Mac in 2008 is alsocontributing to the total capital change(valuation allowance and releaseshave been allocated across segmentsat Fannie Mae and in Other at FreddieMac). In the first quarter of 2013,Fannie Mae released the substantialmajority of the valuation allowanceagainst its deferred tax assets,resulting in a benefit for federalincome taxes of 50.6 billion. In thethird quarter of 2013, Freddie Macreleased a substantial portion of thevaluation allowance against itsdeferred tax assets, resulting in abenefit for federal income taxes of 23.9 billion.7 Amounts represent the total drawsrequested based on quarterly netdeficits for the periods presented.( 142) 187.57
FHFA Quarterly Performance Report of the Housing GSEs, Third Quarter 2013Single-Family Credit Guarantee Segment - EnterprisesSingle-Family Credit Guarantee Segment ResultsFannie MaeFreddie Mac2008 YTD 2008 2010 2011 2012 3Q13 3Q13( in billions)1Revenue2(Provision) benefit for credit losses3Other expenses(Provision) benefit for taxesComprehensive Income (Loss)4 20(100)(34)(3) 6(26)(3)0( 118) ( 24) 81(3)(0) 6 89(1)302008 YTD 2008 2010 2011 2012 3Q13 3Q13 43(117)(41)26 46Combined 14 5(64) (12)(13) (3)(1) (0)( 89) 5(3)(2)0( 64) ( 10) ( 0)2008 3Q13 51(2)(0) 29(78)(19)(1) 72(196)(60)25 5( 69)( 158)Source: FHFA (Fannie Mae and Freddie Mac)1 Consists of guarantee fee income, trust management income, net interest income, and other income.2 The provision for credit losses is the recognition of estimated incurred losses and increases the loan loss reserve. Fannie Mae's figures have been adjusted to excludelosses on credit‐impaired loans acquired from MBS trusts.3 Consists of investment gains (losses), fair value losses (Fannie Mae), administrative expenses, foreclosed property income (expense), other expenses, losses on credit‐impaired loans acquired from MBS/PC Trusts, and at Freddie Mac, segment adjustments.4 Represents segment earnings (loss) and, for periods after 2008, total comprehensive income (loss), net of taxes, for the Single‐Family Credit Guarantee segment.Totals may not sum due to rounding.Single-Family Loan Loss Reserves( in billions)1Beginning balance2,3Provision (benefit) for credit losses3Charge-offs, netOther1Ending balanceFannie MaeFreddie Mac2008 YTD 2008 2010 2011 2012 3Q13 3Q132008 YTD 2008 2010 2011 2012 3Q13 3Q13 3 60 7210026(1)(39) (18) (15)(5)33 59(9)(6)1 60 72 59 46 394 181 15(0) 6(2) 43 18 14 4 3 39 3964123(22) (12) (11)(5)(1)(0) 31(1)(4)0 39 39 31 25 773 2212 1201 1100 4(0)0 5023 80 26 13 12 4 55117(77)78(50)Credit Losses - Single-Family3Charge-offs4OtherForeclosed Property ExpenseTotal3Source: FHFA (Fannie Mae and Freddie Mac)1 Fannie Mae's loanloss reserve excludes amounts related to the allowance for accrued interest receivable and allowance for pre‐foreclosure property taxes and insurancereceivable. Freddie Mac's loan loss reserve excludes amounts related to the allowance for accrued interest receivable and forgone interest on loans placed on non‐accrualstatus.2 Freddie Mac's figures represent Segment Earnings provision for credit losses, which is generally higher than that recorded under GAAP, primarily due to recognizedprovision associated with forgone interest income on loans placed on non‐accrual status, which is not recognized under GAAP.3 Fannie Mae's provision for credit losses has been adjusted to exclude losses on credit‐impaired loans acquired from MBS trusts. Additionally, the effect of losses fromcredit‐impaired loans acquired from MBS trusts on charge‐offs and foreclosed property expense has been reflected as an adjustment to total credit losses and charge‐offs,net.4 Freddie Mac's figures include charge‐offs related to certain loans purchased under financial guarantees.Totals may not sum due to rounding.Federal Housing Finance Agency8
FHFA Quarterly Performance Report of the Housing GSEs, Third Quarter 2013Single-Family Credit Guarantee Segment - EnterprisesCredit Losses (Percent of Total Credit Losses)Fannie MaeFreddie Mac% of UPB asof Dec 31,% of UPB asof Dec 31,1by 7%3%1%4%YTD2008 3Q1325%11%8%5%3%6%29%2%4%13%2by ProductAlt-AInterest-Onlyby Vintage20062007200820092010201120121by 2008 AN/A35%28%1%N/AN/AN/AN/A25%32%7%3%3%2%1%by ProductAlt-AInterest-Onlyby Vintage2006200720082009201020112012Source: FHFA (Fannie Mae and Freddie Mac)1 Represents each category's share of the respective Enterprises' single‐family book of business, which is based on the unpaidprincipal balance of all single‐family unsecuritized mortgages held by the Enterprises and those underlying Freddie Mac mortgage‐related securities, or covered by the Enterprises' other guarantee commitments.2 Product categories overlap.Federal Housing Finance Agency9
FHFA Quarterly Performance Report of the Housing GSEs, Third Quarter 2013Investments and Capital Markets Segments - EnterprisesInvestments and Capital Markets Segment ResultsFannie Mae2008 20102011 2012( in billions)1,2 34(25)(0)(18)RevenueDerivatives gains (losses)Trading gains (losses)Security impairments3Other 13(7)0(0)5(Provision) benefit for taxesNet income (loss)43(9)( 12)5Unrealized gains (losses) on AFSAccounting change for ImpairmentsTotal Comprehensive Income (Loss)0 9931( 0)Freddie Mac2008 3Q132008 201020112012 82(0)(0) 68(33)0(19) 17(10)4(31) 7(4)(1)(2) 62(2)(2)41729 230 340 3YTD3Q13 13(4)1(1)5(0) 141-2-1-123 10 16 24 491(2)( 20)15( 14)CombinedYTD3Q132008 3Q132008 3Q13 35(1)0 33(7)0(34) 100(40)1(53)3310271 80 10(1) 1(1) 353-3-2-105228 6 11 12 16 65Source: FHFA (Fannie Mae and Freddie Mac)1 Freddie Mac includes net interest income on investments in multifamily loans, net interest income on commercial mortgage‐backed securities, and non‐interest rate risk‐related unrealized gains(losses) on commercial mortgage‐backed securities and held‐for‐sale loans in Multifamily Comprehensive Income (Loss), while Fannie Mae includes similar items in Investments comprehensive income.Investments comprehensive income includes the impact of accounting changes for security impairments.2 Consists of guarantee fee expense, trust management income, net interest income, and other income.3 Figures consist of debt extinguishment losses, debt foreign exchange gains (losses), debt fair‐value gains ( losses), investment gains (losses), hedged mortgage assets gains, net, administrativeexpenses, other expenses, and at Freddie Mac, segment adjustments.4 Includes extraordinary losses /noncontrolling interest.5 Amount for 2008 includes consolidated changes in unrealized gains (losses) on available for sale securities, net of taxes. Effective April 2009, includes adjustments for other‐than‐temporaryimpairments, net of taxes, included in accumulated other comprehensive income due to a change in accounting standards for impairments. At Freddie Mac, amount also includes the change inunrealized gains (losses), net of taxes, related to cash flow hedge relationships.Totals may not sum due to rounding.Security ImpairmentsFannie Mae( in billions)Alt-A/OptionSubprimeOtherTotal1Freddie Mac2008 20102011YTD2012 3Q132008 3Q13 9.18.0 0.6(0.3) 0.40.3 0.00.0 10.18.00.50.00.00.00.6 17.6 0.3 0.7 0.0 18.62008 2010Alt-ASubprimeCMBSOption ARMOtherTotal12008 3Q132011YTD2012 3Q13 6.411.9 0.21.3 0.21.3 0.10.1 02.7 31.9 2.3 2.2 0.2 36.5Source: FHFA (Fannie Mae and Freddie Mac)1 The adoption of an accounting standard for impairments in April 2009 required the Enterprises to begin recognizing only the credit portion of impairments in theirstatements of income and comprehensive income. This accounting standard did not require the Enterprises to revise previously recorded amounts in their statements ofincome and comprehensive income but did result in an equity increase of 5 billion and 3 billion for Freddie Mac and Fannie Mae, respectively, which is not reflected in thetable above. For the full year of 2008 and a portion of 2009, amounts include both credit and non‐credit‐related security impairments.Totals may not sum due to rounding.Federal Housing Finance Agency10
FHFA Quarterly Performance Report of the Housing GSEs, Third Quarter 2013The Federal Home Loan Bank SystemCombined System Earnings RemainRobustDuring the third quarter 2013, the Banks generated 857 million of net interest income and 548 million of net income. Compared to thesecond quarter, net interest income increasedby 40 million and net income fell by 146 million. Current net income fell primarily due to increased losses on derivatives and hedging, partially offset by a decline in the unrealized losson the change in value of trading securities.Over the past nine months, the Banks earned 2.5 billion of net interest income and 1.8 billion of net income compared to the net interestincome of 3.0 billion and net income of 1.9billion earned during the nine months endedSeptember 2012. Despite the decrease relativeto 2012, these figures compare favorably toquarterly income generated over the prior 10years. (Figure 8)Profitability metrics remain strong. Due to theincrease in net interest income during the quarter, the average third quarter net interest spreadincreased by 3 basis points to 40 basis points -higher than the 10-year quarterly average of 33basis points. The decrease in third quarter netincome resulted in a decline in average returnon assets to 28 basis points from 36 basispoints in the previous quarter and a return onequity of 5.07 percent, down from 6.60 percentin the second quarter. However, both net income metrics are higher than their 10-yearquarterly averages of 23 basis points and 4.90percent.Combined Advances IncreasedAs of September 30, 2013, the Banks held combined assets of 789.4 billion made up of 465.1 billion of advances (59 percent of totalassets), 276.8 billion of investments (35 percent of total assets), and 45.2 billion of mortgages (6 percent of total assets). During thethird quarter, total assets increased by 14.2billion -- advances grew by 6.6 billion, investments increased by 9.0 billion, and mortgageholdings fell by 1.5 billion. As a result of theproportional increase of advances and assets,the combined advances-to-assets ratio of 59percent remained unchanged from the previousquarter. Since the beginning of the 2013, totalassets grew by 26.4 billion while advances increased by 39.4 billion. As a result, the average ratio of advances as a percentage of assetsincreased three percent, from 56 percent at thebeginning of the year (Figure 9).Third quarter 2013 and year-to-date advancegrowth at the Banks was driven by a few largemembers. Currently, the 10 largest borrowers atthe combined Banks, aggregated to the holdingcompany level, hold 184.0 billion or 40 percentof outstanding advances. These 10 borrowersincreased their advance holdings by 9.3 billionduring the third quarter and by 59.4 billion2013 year-to-date. Advance growth by the 10largest borrowers was faster than combinedBank advance growth, as advances demand bysmall local and regional members declined by 2.6 billion during the quarter and 6.5 billionduring the first nine months of 2013. Overall, 57percent of the 7,541 members have advancesoutstanding.At the end of the third quarter, the Banksranged in size from 31.3 billion to 121.4 billion. Asset composition also varies among individual Banks. Advances make up two-thirds ormore of assets at FHLBanks of New York, Atlanta, Cincinnati, and Des Moines – all experienced advance growth during 2013 from largebank holding companies. Generally, Banks witha lower proportion of advances-to-assets, suchas the FHLBanks of Chicago and Seattle, experienced little advance demand from large bankholding companies during the year. Investmentsare more than 60 percent of total assets at twoBanks, and four Banks have whole mortgageholdings greater than 10 percent of assets.Federal Housing Finance Agency11
FHFA Quarterly Performance Report of the Housing GSEs, Third Quarter 2013Federal Home Loan BanksCapital Remains StrongAs of September 30, 2013, the Banks held 49.8 billion of regulatory capital and 43.1 billion of GAAP capital. Regulatory capital equalstotal capital stock ( 38.1 billion) plus retainedearnings ( 11.7 billion) while GAAP capitalequals regulatory capital less mandatorily redeemable capital stock ( 5.8 billion) plus accumulated other comprehensive income (- 804million). The current average Bank regulatorycapital ratio is 6.30 percent and the averageGAAP capital ratio is 5.47 percent. As a result,all Banks exceed the minimum l
The Enterprises and the Federal Home Loan Bank System (the "Housing GSEs") reported positive earnings in the third quarter of 2013, influenced by rising house prices. Year-to-date through Sep-tember 2013, national house prices rose 6.0 percent, according to the FHFA House Price Index (purchase-only, seasonally adjusted index).