Transcription
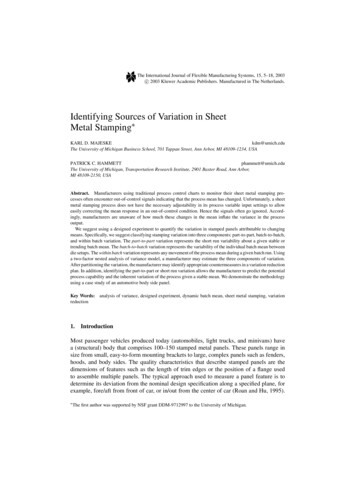
The International Journal of Flexible Manufacturing Systems, 15, 5–18, 2003c 2003 Kluwer Academic Publishers. Manufactured in The Netherlands. Identifying Sources of Variation in SheetMetal Stamping KARL D. MAJESKEkdm@umich.eduThe University of Michigan Business School, 701 Tappan Street, Ann Arbor, MI 48109-1234, USAPATRICK C. HAMMETTphammett@umich.eduThe University of Michigan, Transportation Research Institute, 2901 Baxter Road, Ann Arbor,MI 48109-2150, USAAbstract. Manufacturers using traditional process control charts to monitor their sheet metal stamping processes often encounter out-of-control signals indicating that the process mean has changed. Unfortunately, a sheetmetal stamping process does not have the necessary adjustability in its process variable input settings to alloweasily correcting the mean response in an out-of-control condition. Hence the signals often go ignored. Accordingly, manufacturers are unaware of how much these changes in the mean inflate the variance in the processoutput.We suggest using a designed experiment to quantify the variation in stamped panels attributable to changingmeans. Specifically, we suggest classifying stamping variation into three components: part-to-part, batch-to-batch,and within batch variation. The part-to-part variation represents the short run variability about a given stable ortrending batch mean. The batch-to-batch variation represents the variability of the individual batch mean betweendie setups. The within batch variation represents any movement of the process mean during a given batch run. Usinga two-factor nested analysis of variance model, a manufacturer may estimate the three components of variation.After partitioning the variation, the manufacturer may identify appropriate countermeasures in a variation reductionplan. In addition, identifying the part-to-part or short run variation allows the manufacturer to predict the potentialprocess capability and the inherent variation of the process given a stable mean. We demonstrate the methodologyusing a case study of an automotive body side panel.Key Words: analysis of variance, designed experiment, dynamic batch mean, sheet metal stamping, variationreduction1.IntroductionMost passenger vehicles produced today (automobiles, light trucks, and minivans) havea (structural) body that comprises 100–150 stamped metal panels. These panels range insize from small, easy-to-form mounting brackets to large, complex panels such as fenders,hoods, and body sides. The quality characteristics that describe stamped panels are thedimensions of features such as the length of trim edges or the position of a flange usedto assemble multiple panels. The typical approach used to measure a panel feature is todetermine its deviation from the nominal design specification along a specified plane, forexample, fore/aft from front of car, or in/out from the center of car (Roan and Hu, 1995). Thefirst author was supported by NSF grant DDM-9712997 to the University of Michigan.
6MAJESKE AND HAMMETTThis research provides an analysis methodology to quantify the components of variation forthese panel quality features, given the particular characteristics of the sheet metal stampingprocess.For each automotive body panel, the sheet metal stamping process requires two distincttypes of equipment: the stamping press and a set of stamping dies. The set of stamping diesrepresents custom manufacturing equipment used to make specific product geometry. Thestamping press represents flexible manufacturing equipment, capable of producing manydifferent automotive body panels (hood, door, fender, etc.) simply by changing the stampingdies. Thus, a particular stamping press produces an individual panel in batches, making thesetup of the dies critical to controlling the process mean.To monitor the quality of automotive body panels, most manufacturers apply statisticalanalysis methods (Montgomery, 1996) such as statistical process control (SPC). In SPCterminology, manufacturing processes contain two types of variation: common cause andspecial cause. Common cause variation is the natural inherent variation in the process outputwhen all input variables remain stable, that is, independent and identically distributed.Special cause variation represents any increase in product variability above the level ofcommon cause variation. Manufacturers detect special case variation by identifying out-ofcontrol signals on control charts. To correct these out-of-control conditions, and eliminatethe associated special cause variation, the manufacturer must have the ability to adjust theprocess mean.Many North American (NA) automotive stamping facilities lack the attention to detail in their die setup procedures to control mean shifts after changing the stamping dies.When beginning a panel batch, the manufacturer measures a sample of panels to createan SPC subgroup. If this subgroup plots out-of-control, the stamping processes have nosimple adjustment mechanisms to change feature dimensions. This inability to adjust theprocess mean has frustrated NA automotive manufacturers applying SPC to their stampingprocesses. Thus, these manufacturers must continually adjust downstream processes (weldfixtures or weld robots) to compensate for changes in the dimensional geometry of stampedpanels. However, many Japanese stamping facilities have eliminated out-of-control conditions at die setup by following well-structured die change procedures. By eliminatingthese out-of-control setup conditions, these Japanese manufacturers have also been able toremove traditional control charts.2.Measures of stamped panel quality and quality improvementManufacturers use control charts to assess stability in the process output. The X-bar andR charts are methods recommended by the Automotive Industries Action Group (AIAG,1992) for charting a product described with a continuous, random quality characteristicsuch as panel feature deviation from its nominal measurement. The X-bar chart graphicallytracks the sample averages over time to look for changes in the process mean, while the Rchart tracks the sample range as a measure of process variability.While a majority of statistical techniques assume a stable mean over time, some authorshave addressed the issue of a nonstable process. Woodall and Thomas (1995) suggest anX-bar chart to track the mean of a process that has two sources of common cause variation
IDENTIFYING SOURCES OF VARIATION IN SHEET METAL STAMPING7(e.g., within batch variation about the mean and batch-to-batch variability in the mean).They also present a model that captures a third component of variation, measurementerror. Woodall and Thomas caution against using their techniques “. until every realisticeffort is made to remove each of the various sources of what is to be treated as commoncause variability.” Sullo and Vandeven (1999) also have studied processes with run-to-runvariation. They developed an analytic approach for approving a process setup (run) forproduction, assuming a quadratic loss function and a 0-1 loss function.The quality assessment of a panel feature also involves measuring its process capability,the ability to produce products between the upper specification limit (USL) and the lowerspecification limit (LSL), that is, the design tolerance. Breyfogle (1999) discusses C p andPp , two measures of process potential—their values are independent of the proportion ofparts within design specification—that share the theoretical definitionC p Pp USL LSL.6σx(1)The difference between these two indices lies in the assumption regarding process stabilityand the method(s) used to estimate process standard deviation. The index C p assumes anin-control process while the measure Pp is considered a “long run” capability index anddoes not require the standard stability assumption. For C p , the manufacturer can estimatethe process standard deviation with the sample standard deviation as σ̂x S or from therange chart with σ̂x R̄/d2 . To estimate Pp , the manufacturer should take a sample thatcaptures long run process variation and estimate the process standard deviation with thesample standard deviation as σ̂x S.3.Sheet metal stamping process characteristicsSheet metal panels require multiple die operations using either a single press or a series ofpresses in a press line. Stamping dies and presses have numerous input variables (tonnage,shut height, press parallelism, counterbalance pressure, nitrogen pressure in dies, pressspeed, etc.) that can influence stamping panel quality, especially during die setup. Theresultant geometry of the sheet metal panels depends, in part, on these settings.Using the same press settings each time a particular die is set would help reduce longrun variation in the associated panels. Unfortunately, the relationship of the numerouspress settings and other process input factors (incoming material, blank size, etc.) on panelgeometry is not well documented or understood by manufacturers. For example, many ofthe input variable settings use a single value for the entire panel. Individual panels, however,have multiple features in different areas that are not necessarily controlled by the same set ofinput variable settings. This situation limits the ability to bring the process back to the targetvalue when SPC charts exhibit out-of-control conditions for certain features, especially ifother features do not change. In addition, none of the process input variables possess a directcause-and-effect relationship with a panel feature. For example, increasing the tonnage bysome amount will not cause a predictable change in a panel feature, as it does in machiningwhere adjusting the position of a cutting tool has a predictable impact on the process mean.
8MAJESKE AND HAMMETTHammett, Wahl, and Baron (1999) show how the difficulties resulting from a lack ofsimple, process input variable adjustments to shift the process mean have led many automotive body manufacturers to apply functional build concepts. Functional build (Majeskeand Hammett, 2000) involves delaying the decision to modify a stamping die until assessingthe impact of the variation on the downstream assembly process.The lack of easily adjustable input settings is complicated by the large number of potentialsignificant variables. Numerous case studies describe the complex relationship betweensheet metal stampings and their process input variables. Siekirk (1986) suggests “The sheetmetal process for high volume production is best described as an art. .” Using two designedexperiments to study the relationship between stamping process output quality and processinputs, Siekirk found significance in all five of the process variables studied: blank size,blank location, lubrication, binder force (outer tonnage), and metal thickness.Zhou and Cao (1994) examined the process of stamping a door inner, and identified twotypes of variation found in metal stamping: within run and run-to-run. They studied theimpact of three process variables (outer tonnage, inner tonnage, and punch speed) on withinrun variation. Using a designed experiment, they identified levels for these three variables,suggesting better control could reduce within run variation by 54%.Wang and Hancock (1997) also studied a door inner stamping process. They investigatedthe impact of 15 process variables on formability (split/no split) of the stamped panels.Using logistic regression, they concluded that three variables influenced the ability to forma panel without splits: surface roughness of the steel, outer tonnage of the press, and theamount of lubricant.Berry (1996) discussed the relationship between the composition of sheet steel (theraw material) and stamped panel quality. Berry suggests that, in general, Japanese manufacturers run their stamping processes in statistical control while their US counterpartsdo not. Noting that these manufacturers purchase steel from the same sources, he maintains that US manufacturers should focus quality improvement efforts on nonsteel relatedvariables.A general conclusion across these various case studies is the existence of a large potential number of significant input variables that are not well understood and hard to control.For example, the true cause-and-effect relationship of the various inputs often is unknown.Rather than exploring the relationship between stamping press parameters and panel geometry, this research develops a method for quantifying the variance in product output basedon typical variations observed in the input variable settings. This provides an analytic toolfor determining whether a variation reduction plan is necessary.4.Model developmentManufacturers produce many different panels in the same stamping press by removingone set of stamping dies and inserting another. Placing a die in a stamping press is oftenreferred to as die setup. Die setup involves setting the stamping process variables such asshut height and binder force (tonnage). Thus, die setup signifies a reconfiguration of thestamping process. The quantity of parts produced following a die setup is referred to as abatch.
9IDENTIFYING SOURCES OF VARIATION IN SHEET METAL STAMPINGBatch 1MeanLong roductionMean Bias0-0.5-1LowerSpecification.Figure 1.Stamping process data (note: horizontal lines represent batch means).Figure 1 conceptually shows data from a batch production process. While each batch hasits own mean, in the long run, the batch means vary randomly about some overall processmean. The difference between the overall process mean and the design nominal or targetvalue represents the mean bias in the manufacturing process. We define the variability aboutthe current or instantaneous process mean as the natural inherent variability (part-to-part)in the process.4.1.Total process: TPTP represents the long run output as seen by the customer. This variable captures all thesources of variation for the quality characteristic X. While not an assumption of this work,historical data shows that for many stamped panels, TP follows a normal distribution. Theexpected value of TP represents the long run process average for the quality characteristic,2E[TP] µTP µx . The variability of TP, Var[TP] σTP σx2 , represents the variationdelivered to downstream processes and customers. The total process variation represents thevariability one should use when assessing the capability of the stamping process to achieveengineering specifications or tolerances.4.2.Batch mean: BA large number of stamping process variables affect the mean of a single batch. Pressoperators and die setup personnel often do not consistently replicate stamping processsettings each time they set up the same panel. Several difficult to control input variables, suchas steel properties or lubrication levels, could also affect the mean of a batch. Therefore, we
10MAJESKE AND HAMMETTmodel process mean as a random variable where each batch mean, Bi , represents the batchaverage for the ith batch. Assuming equal batch sizes, the expected value of B, the batchmean, is equal to the long run process average E[B] E[TP]. The variance of B, thebatch mean variation, represents the panel variability associated with batch-to-batch mean2shifts or Var[B] σBB.4.3.Within batch mean: WBAlthough Bi represents the average or mean of panels stamped in the ith batch, this modelallows for instability of the mean within a batch. In other words, this model allows for anonconstant or dynamic batch mean. These changes within a batch are believed to be theresult of changes in input and process parameters such as differences in steel propertiesbetween incoming material lots, or changes in die pressures due to a nitrogen cylinder leak.We let WB represent the instantaneous average or mean of panels stamped in a batch as adeviation from the overall batch average Bi , that is, E[WB] 0. The WB variable capturesthe changes in batch mean, Bi , during a batch. Therefore, the within batch mean variance,2, represents the variability of the process mean within a batch.Var[WB] Var[Bi ] σWB4.4.Part-to-part: PPPP represents the inherent process variation about a given mean value. We assume thestamping process follows a conditional normal distribution, that is, for a given value of thecurrent batch mean, the process produces a normally distributed output. This part-to-partvariable is intended to capture any noise variable that would be expected as part of normalprocess operations. The part-to-part variable has an expected value of zero E[PP] 0 with2a variance of Var[PP] σPP. The part-to-part variation represents the potential for totalprocess variation or the level of total process variation that could be achieved by eliminatingwithin batch and batch-to-batch variation.4.5.Sources of variation modelThis model assumes that the variables are additive or that TP B WB PP. We furtherassume that the components are independent and derive the model by taking the variance2222σTP σBB σWB σPP. The part-to-part variation in this variation model represents theshort run process variation about the mean. If the manufacturer were to control the stampingprocess mean, then part-to-part variation would equal the total process variation. We suggestusing a statisticCPP USL LSL6σPP(2)in consort with Pp to assess stamping process capability. Cpp represents the potential capability or the level of C p the manufacturer would obtain by controlling the process mean.
IDENTIFYING SOURCES OF VARIATION IN SHEET METAL STAMPING5.11Estimating the model parametersWe suggest estimating the components of variation using a designed experiment or DOE(Box, Hunter, and Hunter, 1978). However, given the nature of the model, the samplingplan cannot be purely random in a statistical sense. The sampling plan should more closelyrepresent the rational sampling used in control charts, that is, taking consecutive parts fromthe process. While the model does not require observations within a sample to be consecutivepieces, they should be obtained from a relatively short window of parts, for example, everyother or every third piece. When conducting the designed experiment, one should allow theprocess to run the way it normally runs in production. A manufacturer should not attemptto influence any process or steel property variables differently from regular production.To estimate the parameters of the model we suggest taking observations from b batchesor die sets. Taking samples from multiple batches will allow estimating the batch-to-batchvariation. Within each batch or die set, a manufacturer should sample the process s differenttimes to estimate the within batch variation in the mean. Finally, a manufacturer should takea sample of size n each time the process is sampled. Taking replications per samplingallows estimating the part-to-part or pure error in the process. This approach results in atotal sample of size N , where N bsn. Using the response variable X , this approach willgenerate data of the form:X i jk ,i 1, . . . , b (batch),j 1, . . . , s (sample within batch), andk 1, . . . , n (observation in sample).Fitting the model outlined in this article requires three sample size decisions: the numberof batches, the samples per batch, and the replicates or the size of each individual sample.Sample size planning prior to conducting the experiment can assist the manufacturer withobtaining informative results at the lowest cost. To determine the three components of samplesize planning, the manufacturer can use a statistical power approach (see Montgomery,1991). For a random effects model, this requires specifying the magnitude of the variancecomponents the manufacturer would like to detect and the probability (statistical power)that they will detect this condition.Again, when conducting the designed experiment, one should allow the process to run theway it normally does during normal production. To estimate the components of variationfrom the experiment, one needs the mean squares batch (MSB), mean squares within batch(MSWB), and mean squares error (MSE). This can be accomplished with a statisticalsoftware package by having three variables: the values of the response X i jk , batch (thevalue of the subscript i), and sample number within the batch (the value of the subscript j).We recommend fitting a nested two-factor random effects analysis of variance (ANOVA)model to the data. One should not include an interaction term, but must nest the samplefactor under the batch factor. The software should provide the estimates of the mean squares.Next, we may estimate part-to-part variation with the mean squared error2σ̂PP MSE(3)
12MAJESKE AND HAMMETTand within batch variation, if it is significant, using2σ̂WB MSWB MSE.n(4)If within batch variation is significant, estimate batch-to-batch variation as2σ̂BB MSB MSWB.sn(5)However, if within batch variation is not significant, estimate batch-to-batch variation as2σ̂BB MSB MSE.sn(6)Factors that are not statistically significant may be removed from the model and the modelrefit prior to estimating variance components.6.Case study: Automotive body side panelTo demonstrate the technique, we utilize data obtained from an automotive body stampingfacility. These data represent measurements taken from a body side panel as shown inFigure 2. This particular panel has 16 output features, with the quality of individual featuresaffected by different operations and input variables in the die/press lineup. Thus, althoughthe features may not be truly independent, stamping manufacturers treat these features asindependent characteristics. In some cases, manufacturers eliminate significantly correlatedfeatures during manufacturing validation prior to the start of regular production. Thus, wefirst identify the sources of variation for an individual feature.To study the body side panel stamping process we designed the following sampling plan.To capture batch-to-batch shifts in the mean, we sampled b 6 nonconsecutive batchesduring a period of two months of production. The manufacturer also felt that this processFigure 2.Automobile body side panel.
IDENTIFYING SOURCES OF VARIATION IN SHEET METAL STAMPINGTable 1.Batch13Body side panel data.Within batch groupSample 1Sample 20.33Sample 3110.620.51120.400.180.36210.24 0.190.17220.260.280.4531 0.49 0.45 0.4032 0.54 0.64 0.2241 0.19 0.30 0.2442 0.050.15 0.04510.130.320.56520.460.480.4861 0.270.02 0.2062 0.310.23 0.13might have shifts in the mean within a batch due to differences in material properties resultingfrom changing coils of steel. Since the length of the individual runs is approximately4 hours, we had a limited time window to detect these within batch shifts. Therefore, weselected s 2 samples per batch taken at the beginning and at the end of the batch tomaximize the probability of trapping a mean shift between samples. The last component ofsample size planning was to determine the number of replicates. The manufacturer alreadytook samples of size n 3 at the beginning of the batch for SPC. For cost reasons, wechoose to augment these samples with an additional sample of n 3 at the end of the batch,rather than generate entirely incremental data for the study.Table 1 contains the dimensional data, in millimeters, for measurement location #3 onFigure 2 generated from the N 36 body side panels. The manufacturer measures thelocations on the body side panel as deviations from the design nominal or the center of thedesign specification. For example, the first panel in the first subgroup selected from batch 1deviated 0.62 mm from its target value, that is, the center of the design specification. We usethis raw data to construct control charts to assess the stability of the stamping process. Wealso fit the ANOVA model described in Section 5 to this data to estimate the componentsof variation.To assess long run process stability of this body side feature, we constructed controlcharts for individuals (moving range and individuals charts) as shown in Figure 3. Toprepare the charts in Figure 3, we used only the first observation from each sample of threeconsecutive parts. Here, both charts exhibit statistical control, suggesting that the processhas a stable mean and variance. In the context of the components of variation model, themoving range chart estimates the total process variation. Therefore, the individual chartsuggests process stability over the long run, rather than a constant mean from batch tobatch.To assess the batch to batch stability of this body side feature, we placed the data on X-barand R charts as shown in Figure 4. Looking first at the R chart, we see that the variance is
14MAJESKE AND HAMMETTFigure 3.Individual and moving range control charts for body side panel.Figure 4.X-bar and R charts for body side panel data.in statistical control. For the stamping process, this suggests that the part-to-part variationremains stable. Next, we look at the X-bar chart and see that the process mean runs out ofcontrol. The special cause variation on this control chart indicates a potential opportunityfor improvement.To quantify the contribution of the variation sources, we recommend fitting the nestedtwo-factor ANOVA model presented earlier. Fitting the ANOVA model (using a Type I errorof α .05) to these data allows estimating the mean squares for the batch and within batchfactors. Using equations (3) through (6), we estimate the components of variation as shownin Table 2. Note that the body side panel has an insignificant within batch effect, implyingTable 2.Components of variation for quality characteristic.ComponentVariancePercentage of total tch0.11679Total process0.146100
15IDENTIFYING SOURCES OF VARIATION IN SHEET METAL STAMPINGthat the mean remains stable within a batch (die set). For the batch factor, changes in themean between die setups account for 79% of the total process variation. This represents anopportunity to reduce variation and to benefit downstream processes.Finally, we use these data to assess process capability. Using traditional process capabilityindices with these data appears to violate the “stable process” assumption. However, givensome inherent variability in batch setup, we argue that a manufacturer may predict a certainlevel of mean shifts over the long run.Using the data from Table 1, we estimated the process mean as µ̂x X̄ 0.055 andthe sample standard deviation as σ̂x S 0.3540. We then used equation (1) to calculateC p 0.942. This value suggests that the width of the process output distribution is greaterthan the width of the design specification. In other words, no matter where the processis centered, it will produce panels outside of the design specification. In the automotiveindustry, a process with a C p 1.67 is considered incapable (AIAG, 1995) and is targetedfor quality improvement.To assess stamping process potential we used equation (5) to estimate Cpp as 1.92. Thisindex suggests that by controlling the process mean, the manufacturer could increase thevalue of C p from 0.942 to 1.92, which would be considered a capable process. For thisparticular feature, the manufacturer must improve the control of the setup operation toreduce the magnitude of the mean shifts between batches.Table 3.Components of variation for each of the 16 measurement locations.Components of al Average0.0220.0030.0490.07430466Percentage of total
167.MAJESKE AND HAMMETTOverall panel assessmentFor large complex panels such as the body side, automotive manufacturers measure aset of features (measurement points). These measurement features, though not necessarily purely independent, are selected to monitor different operations within a presslineup. For example, a manufacturer might select one feature in a particular area to monitor a trim die and another feature on a mating flange to reflect a flange die operation.For large complex panels, manufacturers may select multiple features impacted by thesame die operation if the process input variables do not have a consistent influence. Forexample, if a stamping press is not parallel, the tonnage generated during the formingoperation in one of the four corners may differ from another corner, resulting in the potential for nonuniform mean shifts across various panel features impacted by the same dieoperation.To analyze the entire panel, we fit the components of variation to each of the 16 measurement locations on the body side panel shown in Figure 2 (see Table 3). To providean overall assessment of the body side panel using the sources of variation model, we useaverage variance across the measurement points for each component source. The body sidehas an average total process variance of 0.074 mm. To assess the panel in terms of standarddeviation, we take the square root of the average total process variance or 0.272 mm. FromTable 3 we note that the instability in the mean accounts for about 70% of the total processvariation. Upon further examination of the location of the features, all the large mean shiftproblems occur in the windshield opening of the body side panel. By using the sources ofTable 4.Process capability of panel features.PpCppPass Pp 1.67Pass Cpp 802.
3. Sheet metal stamping process characteristics Sheet metal panels require multiple die operations using either a single press or a series of presses in a press line. Stamping dies and presses have numerous input variables (tonnage, shut height, press parallelism, counterbalance pressure, nitrogen pressure in dies, press