Transcription
New Mexico’sComprehensiveImpaired-Driving Program:Crash Data Analysis
DisclaimerThis publication is distributed by the U.S. Department of Transportation,National Highway Traffic Safety Administration, in the interest of informationexchange. The opinions, findings, and conclusions expressed in this publicationare those of the authors and not necessarily those of the Department ofTransportation or the National Highway Traffic Safety Administration. TheUnited States Government assumes no liability for its content or use thereof. Iftrade or manufacturers’ names or products are mentioned, it is because they areconsidered essential to the object of the publication and should not be construedas an endorsement. The United States Government does not endorse products ormanufacturers.Suggested APA Format Citation:Ramirez, A., Lacey, J. H., & Tippetts, A. S. (2014, March). New Mexico’s Comprehensive ImpairedDriving Program: Crash Data Analysis. (Report No. DOT HS 811 985). Washington, DC:National Highway Traffic Safety Administration.
Technical Report Documentation Page1.Report No.2. Government Accession No.3. Recipient’s Catalog No.DOT HS 811 9855. Report Date4. Title and SubtitleNew Mexico’s Comprehensive Impaired-Driving Program:Crash Data Analysis7. Author(s)March 20146. Performing Organization CodeNTI-1308. Performing Organization Report No.Anthony Ramirez, John H. Lacey, A. Scott Tippetts9. Performing Organization Name and Address10. Work Unit No. (TRAIS)Pacific Institute for Research and Evaluation11720 Beltsville Drive, Suite 900Calverton, Maryland 20705-316611. Contract or Grant No.DTNH22-06-D-0003512. Sponsoring Agency Name and Address13. Type of Report and Period CoveredNational Highway Traffic Safety AdministrationOffice of Behavioral Safety Research1200 New Jersey Avenue SE.Washington, DC 20590Final Report14. Sponsoring Agency Code15. Supplementary NotesAmy Berning served as the project manager on this project.16. AbstractIn late 2004, the National Highway Traffic Safety Administration provided funds through a CooperativeAgreement to the New Mexico Department of Transportation to demonstrate a process for implementing acomprehensive State impaired-driving system. NHTSA also contracted with the Pacific Institute for Researchand Evaluation to measure the effect of that system on various factors including driving-while-impaired (DWI)crash, injury, and fatality rates; DWI arrest rates; DWI conviction rates; blood alcohol concentration (BAC)rates; and public awareness. New Mexico’s core activities included high-visibility impaired-driving lawenforcement operations, increased paid and earned media concerning New Mexico’s law enforcement efforts,and prosecutorial and enforcement training in the five counties with the highest rates of alcohol-involvedfatalities. Other components of the comprehensive system include the creation of a Statewide DWI leadershipteam that provided support and direction to the system and the participation of a Traffic Safety ResourceProsecutor to assist on DWI and other traffic safety laws. The five counties initially participating in the projectwere Bernalillo, Doña Ana, McKinley, Rio Arriba, and San Juan. Santa Fe County joined that group in 2007.Alcohol-involved (those with BACs of .01 g/dL) fatal crashes decreased by 36.5% in the participating countiesduring the project period of 2005 to 2009. The rest of the State experienced a 31.6% reduction. Alcoholimpaired (those with a BAC of .08 g/dL or higher) fatal crashes decreased by 35.8% in the participatingcounties during the same period. The rest of the State experienced a 29% reduction. The decrease in theparticipating counties was not statistically significantly different from the decrease in the rest of the State. Thiswas likely because there were significant Statewide anti-DWI activities during that period as well. However,overall, New Mexico’s multi-faceted efforts appeared to have benefits for the State.17. Key Words18. Distribution StatementImpaired Driving, Driving WhileImpaired, Impaired Driving Enforcement,Traffic SafetyDocument is available to the public from the National TechnicalInformation Service www.ntis.gov, and free of charge atwww.nhtsa.gov index.shtm19 Security Classif. (of this report)20. Security Classif. (of this page)UnclassifiedUnclassified21 No. of Pages50Form DOT F 1700.7 (8/72)Reproduction of completed page authorizedi22. Price
ii
New Mexico’s Comprehensive Impaired-Driving Program: Crash Data AnalysisList of AcronymsAcronymMeaningADA . assistant district attorneyBAC. blood alcohol concentrationBAT Mobile . breath alcohol testing vehicleCDWI .Community Driving While Impaired ProgramCSIDS. New Mexico Comprehensive State Impaired-Driving SystemCTS New Mexico Citation Tracking SystemDWI . driving while impairedLDWI local driving while impaired programNHTSA. National Highway Traffic Safety AdministrationNMDOT . New Mexico Department of TransportationODWI . Operation DWIPDA personal digital assistantsPBT preliminary breath test deviceSFST Standard Field Sobriety TestingTSB. Traffic Safety Bureau (New Mexico’s)TSRP . traffic safety resource prosecutorii
New Mexico’s Comprehensive Impaired-Driving Program: Crash Data AnalysisTable of ContentsAcknowledgements . 1Executive Summary . 2Background . 2Program . 3Methodology and Limitations. 3Highlights. 4Alcohol-Involved Crashes and Fatalities . 4Blood Alcohol Concentration Levels at Arrest . 5Roadside Surveys . 5Introduction . 7New Mexico’s Comprehensive State Impaired Driving Program . 9Alcohol-Related Driving in New Mexico . 9Program Management . 9The DWI Leadership Team Statewide . 10Governor’s Leadership Statewide . 11High-Visibility Impaired-Driving Operations in Targeted Counties . 11Community Outreach in Targeted Counties. 13Adjudication Component Statewide . 13Media Overview in Targeted Counties. 13Methodology and Limitations. 15Alcohol-Involved Crashes and Fatalities . 15Blood Alcohol Concentration Levels at Arrest . 16Roadside Surveys . 16Challenges . 17Results. 18DWI Crashes and Fatalities . 18Alcohol-Involved Fatal Crashes ( .01 g/dL BAC) . 22Alcohol-Impaired Fatal Crashes ( .08 g/dL BAC) . 23iii
New Mexico’s Comprehensive Impaired-Driving Program: Crash Data AnalysisAll Crashes Including Non-Fatal . 24Alcohol-Involved Drivers in All Crashes . 25Alcohol-Involved Drivers in Injury Crashes . 25Drivers in Single-Vehicle Nighttime Crashes (Surrogate Measure of AlcoholInvolvement). 26Blood Alcohol Concentration Levels at Arrest . 28Roadside Survey Data . 30Conclusions . 35Tables:Table 1. Number of Paid and Bonus Media Public Service Announcements 2006 – 2008. 14Table 2. Raw Numbers of Motor Vehicle Fatalities, and Percent of Fatalities That Are AlcoholInvolved for Participating Counties. 19Table 3. Average BAC of DWI Offenders Arrested by Sheriffs’ Offices in Program Counties andRest of State, 2002-2008 . 28Table 4. Average BAC of DWI Arrestees Made by All Law Enforcement Agencies in ProgramCounties and Rest of State, 2002-2008. 29Table 5. 2005, 2007, and 2008 New Mexico DWI Roadside Survey Results. 30Table 6. Bernalillo County 2005, 2007, and 2008 DWI Roadside Survey Results . 31Table 7. Doña Ana County 2005, 2007, and 2008 DWI Roadside Survey Results . 31Table 8. McKinley County 2005, 2007, and 2008 DWI Roadside Survey Results. 32Table 9. Rio Arriba County 2005, 2007, and 2008 DWI Roadside Survey Results . 32Table 10. San Juan County 2005, 2007, and 2008 DWI Roadside Survey Results . 33Table 11. San Miguel County 2005, 2007, and 2008 DWI Roadside Survey Results . 33Table 12. Santa Fe County 2005, 2007, and 2008 DWI Roadside Survey Results . 34Figures:Figure 1. Percentage of Alcohol-Impaired Crash Fatalities in New Mexico and the United States,1998–2008 (Source: NHTSA FARS 2010) . 2Figure 2. Participating Counties in New Mexico. 12Figure 3. ARIMA Intervention Analyses of the Numbers of Alcohol-Involved (.01 g/dL BAC)Fatalities in New Mexico for the 6 Intervention Counties and “Rest of State.” . 22Figure 4. ARIMA Intervention Analyses of the Numbers of Alcohol-Impaired (.08 g/dL BAC)Fatalities in New Mexico for the 6 Intervention Counties and “Rest of State.” . 24Figure 5. Percentage of Drivers in Crashes Who Were Alcohol-involved . 25Figure 6. Percentage of Drivers in Injury Crashes That Were Alcohol-involved . 26iv
New Mexico’s Comprehensive Impaired-Driving Program: Crash Data AnalysisFigure 7. Percentage of Drivers in Crashes in Single-Vehicle Nighttime Crashes. 27Appendices:Appendix A: Activity Report . 39v
New Mexico’s Comprehensive Impaired-Driving Program: Crash Data AnalysisAcknowledgementsThe authors would like to acknowledge the extensive assistance we received from State and localofficials in the conduct of this project. The staff at the New Mexico Traffic Safety Bureauprovided invaluable support and information on this project. Specifically, we would like to thankMaria Martinez, Janet Dewey-Kollen, Michael Sandoval, and David Harris. At the Governor’sDWI czar’s office, we would like to thank Rachel O’Conner and Michelle Brown-Yazzie. Weare indebted to members of the DWI leadership team who shared information on DWI.We thank the many sheriffs’ deputies who shared information with us and allowed us to witnesstheir enforcement operations. These deputies include Sgt. Angel Torres, Bernalillo CountySheriff’s Office; Sgt. Michael Kinney, Doña Ana Sheriff’s Office; Sgt. Jackie Budd, San JuanSheriff’s Office; Sgt. Martin Trujillo, Rio Arriba Sheriff’s Office; Lt. Tom Mumford, McKinleyCounty Sheriff’s Office; Corporal Bill Ritch, Santa Fe County Sheriff’s Office; and Sgt. TaftTracy, Farmington Police Department.In addition, we would like to thank Donna Bevacqua-Young for sharing information related tothe adjudication process and the many prosecutors and judges who shared their insights.1
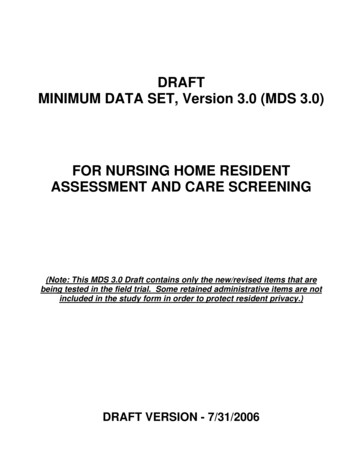
New Mexico’s Comprehensive Impaired-Driving Program: Crash Data AnalysisExecutive SummaryBackgroundSince the fall of 2004, New Mexico has been involved in implementing a number of enhancedactivities that contribute to its comprehensive impaired-driving system. This crash data analysisreport looks at the project’s impact on alcohol-involved crash, injury, and fatality rates to date.This report also looks at results of three roadside surveys that were conducted in New Mexicoand blood alcohol concentration rates at arrest.Figure 1 compares the percentage of crash fatalities that were alcohol-impaired 1 in New Mexicoand the United States between 1998 and 2008. In that period, the percentage of crash fatalitiesthat were alcohol-impaired in the United States stayed around 30%. In comparison, thepercentage of crash fatalities that were alcohol-impaired in New Mexico declined during thatperiod after hitting a peak in 2002. In 2002, 35% of crash fatalities in New Mexico were alcoholimpaired. In 2009, 32% of crash fatalities in New Mexico were alcohol-impaired. In 1998, NewMexico had the 9th highest alcohol related fatality rate in the country. In 2004, New Mexico’s rankinghad risen to seventh. By 2009, New Mexico’s alcohol related fatality rate had dropped to nineteenth.Figure 1. Percentage of Alcohol-Impaired Crash Fatalities in New Mexicoand the United States, 1998–2008(Source: NHTSA FARS 2010)1From the Fatality Analysis Reporting System, which defines alcohol-impaired crashes as those that have at least one driver ormotorcyclist who has a BAC of .08 g/dL or higher. Retrieved px. A BAC of .08 g/dL is the illegal level in New Mexico andall other U.S. States.2
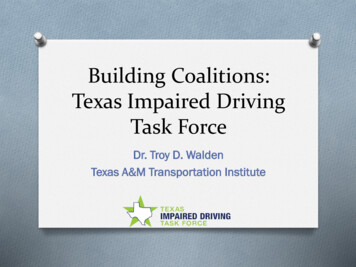
New Mexico’s Comprehensive Impaired-Driving Program: Crash Data AnalysisProgramIn September 2004, NHTSA entered into a cooperative agreement 2 with New Mexico toimplement a comprehensive alcohol-impaired driving reduction effort with a primary focus onincreasing high-visibility enforcement in five counties. Enforcement efforts were coordinated by2 (and later 4) deputies in each sheriff’s office in the five counties. These deputies were to focussolely on impaired-driving enforcement activities. The deputies were to conduct moreenforcement activities to combat alcohol-involved impaired driving, such as sobrietycheckpoints, saturation patrols, and inactive/phantom checkpoints. The deputies were to recordtheir daily activities (number of operations, arrests, etc.) into a Web-based database designed forthis project. The database was to be used to measure the amount of enforcement activity.New Mexico’s comprehensive program included media efforts in support of enforcementactivities and several coordinated media campaigns known as “Superblitzes.” New Mexico alsoestablished a leadership group known as the “DWI Leadership Team” that coordinated alldriving-while-impaired (DWI) efforts throughout the State. The team included key members ofboth governmental and nongovernmental entities and was facilitated by a “DWI czar,” a cabinetlevel position within the governor’s office. In addition, the program included efforts to bettertrain prosecutors on handling DWI cases and working with both the legislature and the judiciaryto address legal matters related to DWI.NHTSA awarded a cooperative agreement to the TSB in September 2004, and the projectcontinued through March 2009 (54 months), with funding flowing to the five target countiesduring different periods, in part due to the time it took for each Sheriff’s Office to negotiate andratify agreements with the TSB. The five counties were Bernalillo, Doña Ana, McKinley, RioArriba, and San Juan. Later, Santa Fe County joined the project 3.Methodology and LimitationsAlso in 2004, NHTSA awarded the Pacific Institute for Research and Evaluation a contract tomeasure the effects of the enhanced activities of New Mexico’s comprehensive alcohol-impaireddriving reduction efforts on rates of alcohol-related crashes, injuries, and fatalities. However,several limitations contributed to difficulties in evaluating the high-visibility enforcementactivities of New Mexico’s Comprehensive State Impaired-Driving System in the five (later six)targeted counties where the special emphasis was placed, including: Limited “pre-data” on enforcement activities which limited comparison of enforcementactivities prior to implementation of high-visibility enforcement to activities after programimplementation. Without knowing if the independent variable (enforcement activity)changed, we cannot know if it affected the number of crashes. County enforcement activities, including the hiring of law enforcement officers, started ondifferent dates.2Cooperative Agreement #DTNH22-04-H-05108.3Santa Fe was originally a control site for this project, but in early 2007, the Santa Fe County Sheriff’s Office was givenadditional funds by the New Mexico Traffic Safety Bureau, so it became the sixth and final target county. In this document, wewill refer to the six counties even though Santa Fe County came aboard at a later date than the original five counties.3
New Mexico’s Comprehensive Impaired-Driving Program: Crash Data Analysis Limited data entered in a Web-based reporting system developed for the target countiesrelated to their DWI enforcement activities. Information was not entered uniformly into theWeb database, and counties did not enter sufficient data to allow for statistical analyses. Funding for the CSIDS was in addition to funding given to the five (later six) participatingsheriffs’ offices from various State or Federal resources to conduct driving while impaired(DWI) operations and other traffic safety initiatives. These sheriffs’ offices typically did notseparate operations conducted under the CSIDS grant from the DWI operations conducted aspart of other funding sources. One DWI operation might have been reported on multiplereporting forms; thus, the same enforcement activity would then be counted more than once.Conversely, an operation might not have been reported to the appropriate funding authorityas it was reported elsewhere (thus, under-reported). Statewide efforts took place, including planning efforts, leadership initiatives, enforcement,public information, law changes and increased use of ignition interlocks, which may haveovershadowed effects due solely to the enhanced enforcement in the targeted counties.In light of these limitations, it was difficult to evaluate the effect of high-visibility enforcementin the targeted counties and to isolate their impact.HighlightsAlthough it was difficult to draw conclusive findings on the effect of the enhanced enforcementprogram in the intervention counties based on the crash and arrest data available, the reductionsexperienced in both the intervention counties and Statewide were significant and quiteimpressive. Some of the key findings of this study regarding New Mexico’s CSIDS arehighlighted below.Alcohol-Involved Crashes and Fatalities At the beginning of the project in 2004, the year before additional enforcement began, therewere 176 alcohol-involved (.01 g/dL BAC) fatal crashes in New Mexico (40% of all fatalcrashes) that resulted in 219 fatalities. At the end of the project in 2009, there were 147alcohol-involved fatal crashes (40.7% of all fatal crashes) that resulted in 152 fatalities inNew Mexico. For alcohol-involved fatal crashes between 2005 and 2009, the intervention countiesexperienced a reduction of 36.5%. The rest of the State (i.e., non-intervention counties)experienced a 31.6% reduction. For alcohol-impaired (.08 g/dL BAC) fatal crashes from 2005 to 2009, the interventioncounties experienced a reduction of 35.8%. The rest of the State experienced a 29%reduction. The decreases in alcohol-involved and alcohol-impaired fatal crashes were significant in boththe intervention counties and the rest of the State. However, the decreases in the interventioncounties were not significantly different from the decreases Statewide. When New Mexico’s intervention counties’ 36.5% reduction in alcohol-involved fatalcrashes was compared with five neighboring States’ 6.4% reduction, the effect for NewMexico’s intervention counties was statistically significant (t 3437; one-tailed p .001).4
New Mexico’s Comprehensive Impaired-Driving Program: Crash Data Analysis When New Mexico’s intervention counties’ 35.8% reduction in alcohol-impaired (.08 BAC) fatal crashes was compared with five neighboring States’ 6.9% reduction, the effectfor New Mexico’s intervention counties was statistically significant (t 2.75; one-tailedp .004). Between 2005 and 2008, a 25% reduction in alcohol-involved drivers in all crashes(including property-damage only) was found (t 10.17; p .001) for the five interventioncounties. For the rest of the State, there was no significant change, though the tendency wastowards a reduction of about 8.9% (t 1.21; p .229). For the five intervention counties, a 33.6% reduction in alcohol-involved (BAC .01 )driver in injury crashes was found (t 8.88; p .001). This equates to a reduction of 26.8alcohol-involved drivers in injury crashes per month. For the rest of the State, a 31.8%reduction was found (t 10.36; p .001) 4. Both reductions were statistically significant.Contrasting the reductions for the two geographical groups, the intervention counties' resultwould be a net decrease of about 2.6%, which is not statistically significant (t 0.44; p .330). When using single-vehicle nighttime crashes as a surrogate measure of alcohol-involvedcrashes between 2005 and 2008, the intervention counties had a reduction of 8.2% and thenon-intervention counties had a reduction of 15.2%. Both reductions were statisticallysignificant. However, the reduction in the intervention counties were significantly (p .001)smaller than seen in the non-intervention counties. At the beginning of the project in 2004, New Mexico had the seventh highest alcohol relatedfatality rate in the country. By the end of the project in 2009, New Mexico’s alcohol related fatalityrate had dropped to nineteenth. It is clear from these crash analyses that New Mexico experienced a dramatic reduction inalcohol-involved crashes during the period of this project. Probably because of the extensivestatewide efforts, it is difficult to discern a separate effect in the five (later six) programcounties. However, overall, New Mexico’s multi-faceted efforts appeared to have benefitsfor the State.Blood Alcohol Concentration Levels at Arrest In computing the average BAC of all DWI arrestees from the program counties and for therest of the State for the years 2002 through 2008, we see that there has been a decrease in themajority of program counties and for the rest of the State.Roadside Surveys 4PIRE conducted a series of DWI roadside surveys in New Mexico. All surveys wereconducted between 10 p.m. and 3 a.m. on Friday and Saturday nights. These were conductedfrom July to December 2005, alongside 20 sobriety checkpoints and 3,307 vehicles wereselected to participate in the surveys. Between September and December 2007, they wereconducted alongside 17 sobriety checkpoints and 3,622 vehicles were selected to participatein the survey. Between May and September 2008, there were 20 sobriety checkpoints and4,229 vehicles were selected to participate in the survey.2005-2008 vs. projected 2005-2008, based on extrapolating “trends” (models) beyond end of 2004.5
New Mexico’s Comprehensive Impaired-Driving Program: Crash Data AnalysisFor the 2005 roadside surveys, 95% of drivers were not alcohol-positive. In 2007,94.4% were not alcohol positive. In 2008, 94.9% were not alcohol-positive.The percentage of drivers who had BACs between .005 and .049 g/dL increasedslightly from 3.3% in 2005 to 4.1% in 2007 but decreased slightly to 3.7% in 2008.The percentage of drivers with BACs between .05 - .079 g/dL remained constant at.6% for all three years, while the percentage of drivers with BACs at or over .08 g/dLremained steady (1% in 2005 and .8% in 2007 and 2008).6
New Mexico’s Comprehensive Impaired-Driving Program: Crash Data AnalysisIntroductionIn late 2004, the National Highway Traffic Safety Administration provided funds to the NewMexico Department of Transportation through a competitive cooperative agreement todemonstrate a process for developing and implementing an enhanced comprehensive Stateimpaired-driving reduction system. Funds were given to the Pacific Institute for Research andEvaluation to measure the effect of that system on alcohol-involved crash, injury, and fatalityrates. Guided through a development, planning, and implementation process which occurred afew years earlier and involved outside assessments of the State’s anti-DWI efforts, the State TaskForce developed a strategic plan and recommended that the Governor appoint a DWI czar tocoordinate efforts among State agencies and across the State.In 2005, New Mexico created a DWI leadership team to assist in the implementation andrefinement of that plan. Activities called for under the plan included high-visibility impaireddriving law enforcement operations, increased paid and earned media concerning lawenforcement efforts, and prosecutorial training in the five counties with the highest rates ofalcohol-involved fatalities. The five counties that initially participated in the project wereBernalillo, Doña Ana, McKinley, Rio Arriba, and San Juan. 5Part of this comprehensive project was documenting and evaluating the enhanced impaireddriving countermeasures and determining their effectiveness in reducing DWI crashes andfatalities in New Mexico. This crash data analysis report provides those findings for the years1990-2008 and is presented in six sections.Section I, New Mexico’s Comprehensive State Impaired Driving Program: This section providesa brief history of impaired driving in the State and describes New Mexico’s comprehensiveefforts to reduce impaired driving. This section briefly describes the DWI leadership team thatwas created as part of this project, enforcement activities, judicial efforts, and media campaigns.Section II, Methodology and Limitations: In this section, we discuss how we obtained ourinformation and also provide a discussion of other analyses that would have been desirable butcould not be conducted. We also list which key data elements were difficult to obtain (thuspreventing a more in-depth analysis).Section III, Results: Here, we provide the results of our analysis of Fatality Analysis ReportingSystem data and New Mexico crash data and provide the results of an ARIMA analysis of bothfatal and non-fatal crashes to assess the potential impact of the project activities on alcoholinvolved crashes. All fatal crashes from the FARS database for New Mexico from 1990 through2009 are used. We also compare the FARS data of the five intervention counties to the rest ofNew Mexico covering data from 2000 through 2009. Comparisons are made also with fiveneighboring States.Section IV, Blood Alcohol Concentration Levels at Arrest: This section covers the average BAClevels at arrest made by the sheriff’s offices in the participating counties and those made by alllaw enforcement agencies in the participating counties.5Santa Fe and San Miguel Counties were initially chosen to be control communities but in 2007 Santa Fe
New Mexico's Comprehensive Impaired-Driving Program: Crash Data Analysis . 3 . Program . In September 2004, NHTSA entered into a cooperative agreement. 2. with New Mexico to implement a comprehensive alcohol-impaired driving reduction effort with a primary focus on increasing high-visibility enforcement in five counties.