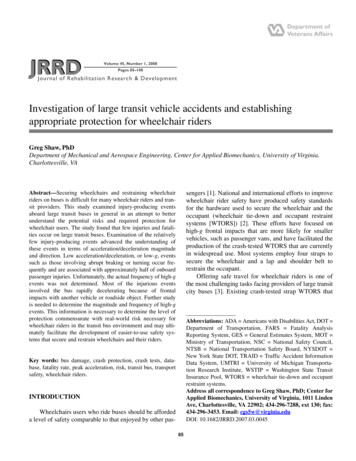
Transcription
JRRDVolume 45, Number 1, 2008Pages 85–108Journal of Rehabilitation Research & DevelopmentInvestigation of large transit vehicle accidents and establishingappropriate protection for wheelchair ridersGreg Shaw, PhDDepartment of Mechanical and Aerospace Engineering, Center for Applied Biomechanics, University of Virginia,Charlottesville, VAsengers [1]. National and international efforts to improvewheelchair rider safety have produced safety standardsfor the hardware used to secure the wheelchair and theoccupant (wheelchair tie-down and occupant restraintsystems [WTORS]) [2]. These efforts have focused onhigh-g frontal impacts that are more likely for smallervehicles, such as passenger vans, and have facilitated theproduction of the crash-tested WTORS that are currentlyin widespread use. Most systems employ four straps tosecure the wheelchair and a lap and shoulder belt torestrain the occupant.Offering safe travel for wheelchair riders is one ofthe most challenging tasks facing providers of large transitcity buses [3]. Existing crash-tested strap WTORS thatAbstract—Securing wheelchairs and restraining wheelchairriders on buses is difficult for many wheelchair riders and transit providers. This study examined injury-producing eventsaboard large transit buses in general in an attempt to betterunderstand the potential risks and required protection forwheelchair users. The study found that few injuries and fatalities occur on large transit buses. Examination of the relativelyfew injury-producing events advanced the understanding ofthese events in terms of acceleration/deceleration magnitudeand direction. Low acceleration/deceleration, or low-g, eventssuch as those involving abrupt braking or turning occur frequently and are associated with approximately half of onboardpassenger injuries. Unfortunately, the actual frequency of high-gevents was not determined. Most of the injurious eventsinvolved the bus rapidly decelerating because of frontalimpacts with another vehicle or roadside object. Further studyis needed to determine the magnitude and frequency of high-gevents. This information is necessary to determine the level ofprotection commensurate with real-world risk necessary forwheelchair riders in the transit bus environment and may ultimately facilitate the development of easier-to-use safety systems that secure and restrain wheelchairs and their riders.Abbreviations: ADA Americans with Disabilities Act, DOT Department of Transportation, FARS Fatality AnalysisReporting System, GES General Estimates System, MOT Ministry of Transportation, NSC National Safety Council,NTSB National Transportation Safety Board, NYSDOT New York State DOT, TRAID Traffic Accident InformationData System, UMTRI University of Michigan Transportation Research Institute, WSTIP Washington State TransitInsurance Pool, WTORS wheelchair tie-down and occupantrestraint systems.Address all correspondence to Greg Shaw, PhD; Center forApplied Biomechanics, University of Virginia, 1011 LindenAve, Charlottesville, VA 22902; 434-296-7288, ext 130; fax:434-296-3453. Email: cgs5w@virginia.eduDOI: 10.1682/JRRD.2007.03.0045Key words: bus damage, crash protection, crash tests, database, fatality rate, peak acceleration, risk, transit bus, transportsafety, wheelchair riders.INTRODUCTIONWheelchairs users who ride buses should be affordeda level of safety comparable to that enjoyed by other pas85
86JRRD, Volume 45, Number 1, 2008comply with U.S. Americans with Disabilities Act(ADA) and U.S. Department of Transportation (DOT)standards present problems for both wheelchair ridersand transit providers because they are both time-consumingand difficult to operate properly [4–5]. Often these systems are misused or considered too cumbersome to use[3,6]. No alternative to strap WTORS has yet emergedthat has been proven to satisfy the challenging ADAcrash protection standards without hindering the transitprocess.The ADA national standard for WTORS was developed without the benefit of adequate information concerning the risk of injury or death to wheelchair ridersand with virtually no information concerning the transitbus crash environment. The 1990 ADA that includesrequirements for U.S. public transit bus WTORS (architectural and transportation barriers) prescribes strengthrequirements for the wheelchair tie-downs that werederived from 32 km/h, 8 to 10 g frontal barrier crash testsof large transit buses [7–9]. This barrier crash velocitywas chosen to represent the average travel speed of atransit bus [10]. Evaluators of a prototype bus seat considered such a crash to be “very severe” [11]. In a recentstudy by the British Transportation Research LaboratoryLtd, the researchers adopted United Nations EconomicCommission for Europe Regulation 80 in their investigation of wheelchair rider protection on “M3” vehicles(vehicles with 8 seats and a total mass 4,500 kg) [12].This regulation, applicable to large transit buses, includesa test protocol for bus seats and seat anchorages thatinvolves a simulated impact with an 8 to 12 g peak deceleration. However, a previous British study indicated thata 10 g deceleration level was inappropriate for full-sizebuses [13].We have conducted two prior studies in which wereviewed the literature and conducted database searchesto determine the crash risk and crash environment for allvehicles that transport wheelchair riders and to determinewhether the 8 to 12 g deceleration crash protection levelwas appropriate relative to real-world incident data [14–15]. We found few studies and limited data collectionefforts because of both a lack of adequate data that identify wheelchair-seated occupants and the very low number of kilometers traveled by wheelchair users relative toother bus riders.Our initial study found few documented cases ofinjuries to wheelchair riders aboard buses of any kind. Ofthe estimated annual average of 53,000 wheelchair-related injuries in all settings between 1988 and 1996 [16],about 170 (0.3%) involved a wheelchair aboard a movingvehicle. Most of these incidents involved the rider fallingout of the wheelchair or the wheelchair tipping over ormoving during vehicle maneuvers, and only 6 percent ofthe incidents involved a collision. No wheelchair riderssustained injuries severe enough to require hospitaladmission [14]. We also found no documented wheelchair rider injuries in transit bus crashes and that transitbuses were, along with school buses, the safest form oftransportation for the general public.Our second study also documented the lack of information regarding wheelchair rider events and found verylittle published information regarding general transit bussafety and crash environments. Our results suggested thatwheelchair riders do not face undue risks aboard transitbuses. Most reported wheelchair incidents were noncollision events in which a rider was injured because he or shewas not restrained properly or the wheelchair was inappropriately secured. The lack of information for wheelchair rider crashes and injuries is likely because wheelchairriders comprise 0.3 percent of bus passengers and, presumably, a similarly low percentage of bus passengerkilometers traveled. Studies that span 30 years confirmthat the transit bus is an exceedingly safe form of transportation. We found no estimates of crash environmentseverity in terms of acceleration/deceleration (g level) inthe passenger compartment for incidents involving eitherwheelchair riders or other passengers. Although mostinjuries due to collisions have been minor, some areclassified as serious; only a few fatalities have beenreported. Crash conditions for the apparently rare severeevents are not adequately described. Much more information was available for more the commonly occurring noncollision incidents associated with vehicle motion duringnormal operation and evasive maneuvers. Reportedacceleration/deceleration levels for these events rangedfrom 0.3 to 0.75 g.Although the results of our second study indicatedthat protection up to the 0.75 g level is more justifiablethan the 8 to 12 g level, the study failed to characterizeevents 0.75 g. The frequency, severity, and principalimpact direction of these events was not established. Thisinformation is critical in establishing an appropriate levelof crash protection for wheelchair riders. Therefore, thisstudy attempts to characterize large transit bus injuryproducing events, especially crashes that involve deceleration levels 0.75 g.
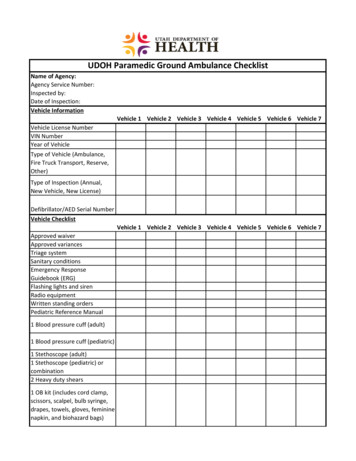
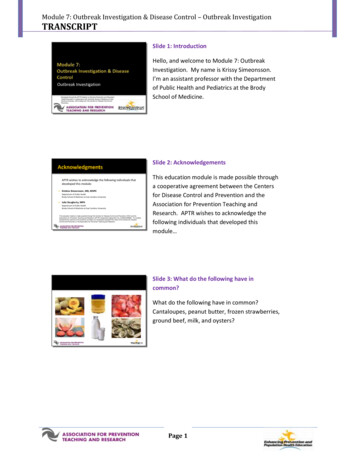
87SHAW. Large transit vehicle accidents and protection for wheelchair ridersMETHODSThe primary information sources for this study werefive U.S. and Canadian databases that contain information on transit bus events, most of which involved a crashor abrupt bus motion. Although the original research planincluded representative sampling of transit providers relative to geographic region and traffic density, because ofthe scarcity of accessible information, I selected databases based on the quality of the information regardinglarge bus incidents and the level of access I was provided. Figure 1 lists the information items targeted in thedatabases. Two national U.S. databases were explored:the National Automotive Sampling System General Estimates System (GES) and the Fatality Analysis ReportingSystem (FARS). The GES provides information on general motor vehicle events and the FARS records eventsinvolving a fatality. Three regional databases also wereinvestigated: the Ontario Ministry of Transportation(MOT), the Washington State Transit Insurance Pool(WSTIP), and the New York State DOT (NYSDOT).Because much of the data comprised small sample sizesfrom individual transit providers, I was unable to use statistical data analysis methods or validate assumptions thatFigure 1.Information targeted from database reviews on transit bus events.regional data was representative of the United States as awhole. I identified trends and relationships between factorsby visual inspection of the data from individual sources.I analyzed FARS and Ontario MOT database information to estimate transit bus fatality and injury rates,and investigated select FARS cases with crash reconstruction techniques to determine approximate crashseverity levels. The techniques used collision partnervehicle and effective fixed object masses, police-reportedtravel speeds, angles of impact, skid distances, and roadsurface conditions to calculate changes in bus velocity(Δ V), a measure of impact severity.RESULTSU.S. National DatabasesGeneral Estimates System: Transit Bus DamageThe GES provides information on buses involved incrashes in the United States [17]. Unfortunately, the GESdoes not uniquely identify transit buses but groups themin the “Other bus” vehicle category. In order to separate thedata collected for transit buses, I found a similar database,
88JRRD, Volume 45, Number 1, 2008the Canadian Traffic Accident Information Data System(TRAID), that does include data unique to transit buses.Note that this approach assumes that the ratio of transitbuses to intercity buses in the GES is similar to the ratioof transit buses to intercity buses in the Canadian TRAIDdatabase. Table 1 summarizes the number and type ofreported bus damage events in 1999 in Canada from theTRIAD and between 1999 and 2001 in the United Statesfrom the GES.Transit buses comprised 72.7 percent of the CanadianTRAID “Severe (repair) demolished” damage categorytotal (32/44 0.727) (Table 1). Assuming a similar proportion exists for the corresponding GES damage category yields an annual average of 430 severely damagedtransit buses (0.727 592) in the United States. Giventhe large number of buses with unknown damage, theactual number of severely damaged buses is likely higher.Another reported GES element, “Manner of leavingscene,” is also related to crash damage and has fewer datapoints coded as “Unknown;” for example, the GES database records that 24,480 buses were driven from thecrash scene, 1,308 were towed because of damage (inaddition to serious damage, buses may be towed becauseof minor problems, i.e., broken headlight or windshield),197 were towed but not because of damage, 117 wereabandoned, and 163 were unknown. Assuming the same0.727 ratio of transit buses to intercity buses for this dataelement yields an annual estimate of 951 (0.727 1,308)transit buses that were known to be towed because ofdamage in the United States. In summary, the GES dataelements “Damage severity” and “Manner of leavingscene” suggest that annually between 430 and 951 transitbuses were substantially damaged in crashes between1999 and 2001 in the United States.Fatality-Producing Events Aboard Transit BusesThe FARS attempts to record every U.S. motor vehicle event that involves a fatality of a vehicle occupant ornonmotorist [18]. Table 2 describes the crash and noncrash events fatal to transit bus drivers and passengersbetween 1997 and 2001.Tables 3 and 4 summarize the number of fatalitiesand the event types. A total of nine drivers and sevenonboard passengers were killed in 560 events. Becauseevery FARS case must involve a fatality, this findingindicates that the great majority of fatalities occurred inthe collision partner vehicle or involved a pedestrian.Drivers were more likely to die than passengersdespite the average estimated passenger-to-driver ratio of12:1. This ratio was not derived systematically, but itapproximates onboard counts in various transportationstudies [19]. The driver station is apparently more dangerous than the passenger area despite the common availability of occupant restraint belts (which were not alwaysused as evidenced by the four cases in which an unbelteddriver was ejected). In all but one case, the driver’s fatalinjuries occurred in a frontal or side crash. In five of eightcases, the damage to the bus was severe and required thatthe bus be towed from the scene. The percent of severelydamaged buses in crash events that involved a driverfatality (5/8 62.5%) is much higher than the 4.1 percentcalculated for general transit bus crashes (severe damage/[none minor moderate severe] 592/15,056 3.9%) (Table 1).Table 1.Number and severity of bus damage events in Canada in 1999 from Traffic Accident Information Data System (TRAID) database and UnitedStates from 1999 to 2001 from General Estimates System (GES) database.Year/Database1999 TRAID(Canada)1999–2001 GES(United States)†*TRAID†Bus ,111Damage Event Category (No.)*SevereSuperficial Moderate Unsafe(Repair) 167121,065238446,0685,285592Unknown Not 426,266categories collapsed to approximate corresponding GES categories, which are displayed in brackets.GES counts are U.S. national estimates based on sample of events (National Automotive Sampling System). Data presented as mean/year.
89SHAW. Large transit vehicle accidents and protection for wheelchair ridersTable 2.Fatality Analysis Reporting System database 1997 to 2001: Transit bus case event descriptions. Database was searched for all fatalities of eitherdrivers or passengers that occurred aboard transit bus in either crash or noncrash events.YearCase No.199728506011Driver or Passenger FatalityUnrestrained driver ejected after bus hit curb and rolled over. Severe bus deformation required towing.Unrestrained driver killed after bus hit on right side. Severe bus deformation required towing.Driver drowned.1998226142287-year-old female fell from stopped bus.87-year-old female fatally injured because of braking.1999385170973998611911184Driver killed when bus hit tree in frontal crash. Severe bus deformation required towing.Passenger fell or jumped from bus.Restrained driver died in head-on crash. Minor deformation but bus was towed.Unrestrained driver ejected in crash that caused moderate bus damage.Unrestrained driver ejected in oblique frontal collision. Severe bus deformation required towing. Driverrun over by bus.Passenger killed in frontal crash. Severe bus deformation required towing.2000136285-year-old wheelchair rider killed when bus negotiated curve at 76 km/h.2001858Unrestrained driver ejected through left-side window after collision with another bus. Moderate busdamage.60-year-old male died in frontal crash with tree. Moderate bus damage.62-year-old female extricated after bus hit curb then slid sideways into building.Driver killed in head-on impact with bridge abutment after preimpact braking. Severe bus deformationrequired towing.2241119760Table 3.Fatality Analysis Reporting System database 1997 to 2001: Transit bus case fatalities.No. Onboard FatalitiesYear19971998199920002001TotalMean/YrNo. FatalCrashes*109115106127103560112DriversAll Cases3040291.8Crashes2040281.6PassengersAll CasesCrashes0020211022731.40.6*Fatal crashes include those in which fatally injured was in collision partner vehicle or was pedestrian. One bus per case was involved, with two exceptions in whichtwo buses were involved.Only three of the seven passenger deaths occurredduring crashes, two frontal and one side. Bus crash damage was coded as “Severe” in two cases and “Moderate”in the third. The side-impact event required passengerextrication, which suggests that the bus wall may haveintruded into the passenger space. The other four passenger fatalities occurred in noncontact events, two of whichinvolved braking or turning. The sole fatality of a wheel-chair rider, an 85-year-old female, was attributed to a busexecuting a turn at relatively high speed.Of the eleven driver and passenger fatalities thatinvolved crashes, five of the crashes involved immovableobjects or a heavy vehicle (Table 2, cases 385, 858, 224,1119, and 760). One of the driver fatalities involvedimpact with a bridge abutment, one a frontal impact witha tree, and another an impact with another bus. In one of
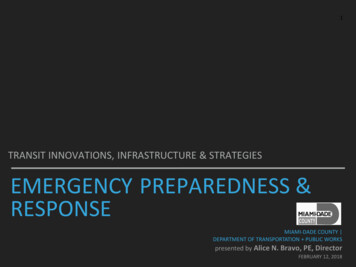
90JRRD, Volume 45, Number 1, 2008Table 4.Fatality Analysis Reporting System database 1997 to 2001: Transitbus case fatalities and contact type.Contact TypeFrontalSideRearOther/UnknownNoncontact s210047the passenger cases, the bus slid sideways into a building,in another, the front of the bus hit a tree.Regional DatabasesIn an attempt to gather additional information ontransit bus events, I reviewed three regional databases:the Ontario MOT, the NYSDOT, and the WSTIP.Ontario Ministry of Transportation DatabaseThe Ontario MOT database provided a wealth of specific information concerning transit bus events. TheOntario MOT database, like the general Canadian TRAIDdatabase, uniquely identifies municipal transit busesrather than including them in an “Other bus” category asin the GES database. Therefore, like the TRAID, I usedthe Ontario MOT to help characterize U.S. transit busevents. This approach assumes that regionally reportedevents are representative of those in the United States asa whole, an assumption that was not tested in this study.Other advantages of the Ontario MOT database are that itcaptures 62 percent of the Canadian transit bus events, itis well documented, and the staff provide generous technical assistance. The 137-field database includes transitbus events that resulted in either injury or property damage 1,000 Canadian and police-reported informationon the event, the vehicle, and involved persons. Theevents are not investigated nor are crashes reconstructed.The Ministry staff provided data on transit bus eventsfrom 1999 to 2001.Event type, bus speed, vehicle damage, and level ofpersonal injury were the main parameters extracted. TheAppendix (available online only at http://www.rehab.research.va.gov) defines the data elements used in theanalyses. Assuming that g level is related to bus damageand the severity and frequency of occupant injury, Iexamined these parameters to identify events that mostlikely involved g levels that exceed those encounteredduring abrupt braking, turning, and accelerating.The 1999 to 2001 database review involved 4,292events and 61,529 bus passengers. The majority of theevents involved only property damage and/or injury toother vehicle occupants or pedestrians. Only 580 of theseevents involved an injury to a bus passenger. A total of844 passengers were injured. Sixty-six percent of theinjuries were minimal; only 0.6 percent were major(requiring hospital admission) (Table 5).Of the 844 bus passengers injured, the type of eventwas known for 751 (Table 5). For 49 percent of the passengers, the bus made contact with another vehicle orfixed object. For 51 percent of the passengers, the eventdid not involve contact. Most of the noncontact eventsare assumed to have involved bus motion from eithernormal or emergency maneuvers. Injury severity was notrelated to bus contact (Figure 2). All the major injuriesoccurred in noncontact events. For those events thatinvolved contact, the amount of damage to the bus wasunrelated to injury severity unless the bus was describedas “Demolished” (Figure 3).Table 6 summarizes the five contact events in whichthe bus was considered “Demolished” (damaged so severelyTable 5.Ontario Ministry of Transportation database 1999 to 2001: Injury severity and event type for injured passengers (n 844). Database contained atotal of 4,292 events and 61,529 passengers in all events.*EventInjury Typen (%)MinimalMinorMajorFatalTotal554 (66)285 (34)5 (0.6)0 (0)844 (100)type unknown for 93 of 844 injured passengers.Event Type 0723950751*
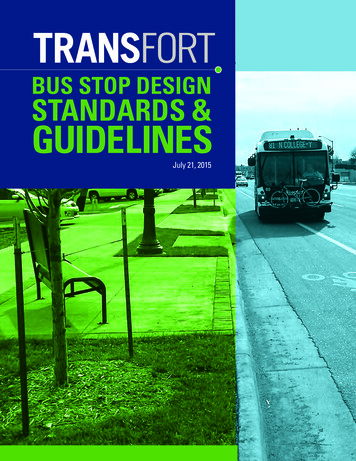
91SHAW. Large transit vehicle accidents and protection for wheelchair ridersFigure 2.Ontario Ministry of Transportation database 1999 to 2001: % ofpassengers injured in contact and noncontact events and severity oftheir injuries.as to be uneconomical to repair). In these events, nearlyall the passengers aboard were injured (an average of92%). In events in which less bus damage occurred, thepercent of injured passengers decreased (Figure 4). Infour of the five events, frontal contact was the primaryimpact. In one event that involved a bus being hit fromthe right side, one injured passenger was partially ejected.The events involving contact are further characterizedin Figures 5 and 6. Visual inspection of the results suggeststhat injury severity is not strongly associated with estimatedpreevent bus speed (Figure 5). Three of the five majorinjuries occurred at speeds of 5 km/h. The percent ofminor versus minimal injuries increased when speedsexceeded 30 km/h.In cases in which 1 passenger was injured, impactsto the front of the bus were the most common (Figure 6).Collectively, frontal impacts comprised 57 percent of allimpacts, rear impacts 24 percent, and left- and right-sideimpacts 19 percent. The single most heavily contactedarea was the left front corner, which accounted for 25 percent of the impacts.The following is a summary of Ontario MOT database findings:1. The Ontario MOT database review provided additionalevidence of transit bus safety. No onboard fatalitiesand only five major injuries were reported in the 3 yearsstudied.2. Injury frequency and severity were very similar forcontact versus noncontact events, such as vehiclemaneuvers.3. Bus damage was associated with injury for only fivecases in which the bus was considered “Demolished.”Most of the passengers were injured. Four of these fivecases involved impacts to the front of the bus.Figure 3.Ontario Ministry of Transportation database 1999 to 2001: Relationshipbetween passenger injury severity and bus damage for contact events.4. Most (57%) injury-producing contacts were to thefront of the bus.5. Preevent bus speed was not strongly associated withinjury.New York State Department of TransportationDatabaseThe NYSDOT is the only state DOT that systematically records and investigates transit bus events. In contrast to the Ontario MOT database review, I did not haveaccess to the underlying data but relied on NYSDOT personnel to conduct database searches on my behalf. Iexplained the need to identify severe transit bus eventsand requested cases that involved bus crashes andresulted in bus occupant injuries and deaths. Table 7summarizes the NYSDOT response, which is a samplingof case reports selected by an experienced staff memberand is not intended to be a census of such events.Three cases did not involve a crash but an abrupt evasive maneuver. Braking was reported in three of the noncrash events for which insufficient details were availableto determine if the passenger injuries were sustained duringthe preimpact braking or the subsequent crash. Althoughtwo drivers died, no passengers were killed or sufferedinjuries severe enough to require hospital admission.Summary of NYSDOT database findings:1. No passengers were killed or suffered injuries severeenough to require hospital admission.
92JRRD, Volume 45, Number 1, 2008Table 6.Ontario Ministry of Transportation database 1999 to 2001: Contact events involving a demolished bus.CollisionSpeedBus StruckBus SpeedBusVehicleBus ContactPartnerNo. BusLimitVehicle/(km/h)MotionStruck sengersInjured (%)Comments500Stopped—YesFrontVehicle3662 adult femaleshad minimalinjuries.5010GoingstraightYes—Left e1292All 11 adultshad minor injuries.5050GoingstraightYes—FrontCurb tree*51002 adults hadminimal and 3minor injuries.705TurningleftYesYesRight frontVehicle pole fence11001 adult, partiallyejected, hadminor injuries.2 adult maleshad minimalinjuries.Tree, shrub, or stump.4. Five of the seven events involved abrupt braking; intwo cases (5606 and 6102), the braking preceded thecrash.Figure 4.Ontario Ministry of Transportation database 1999 to 2001: % of 580contact events in which 1 passenger was injured as function of %injured passengers ([injured/uninjured] 100) and bus damage; e.g.,in 64% of events, % of injured passengers was 10 when bus damagewas described as “None or Light.”2. Of the four crash events, two involved impacts to thefront of the bus, one to the side, and one involved aside impact followed by a frontal impact.3. Avoidance maneuvers caused injuries in several noncrash cases. In one case (5606), preimpact brakingcaused a passenger to fall from the vehicle seat.Washington State Transit Insurance Pool DatabaseThe WSTIP maintains a database of claims for 19transit properties in the Northwest, including one transitorganization in Ohio. In contrast to the other databasereviews, this review included both fixed-route transitbuses and on-demand van-based buses (e.g., paratransitvans). WSTIP generously provided data for 1,333 injuryand property claims recorded between 1996 and 2003. Ofthe 1,333 cases, only 162 (12%) involved a crash: 147claims involved a fixed-route bus crash, 15 involved avan crash, and 53 involved wheelchair riders, althoughnone of the more costly wheelchair rider claims involveda transit bus crash (Table 8).Although the database does not indicate whether theclaim event monetary totals were due to property damageor injury or a combination thereof, the WSTIP staff suggested that claims 10,000 usually indicate an injurywas involved. The location of the injured claimant wasnot recorded, and the claimant could have been in a collision partner vehicle. Twenty-nine fixed-route buses and
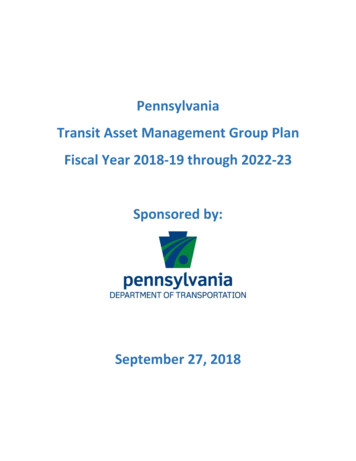
93SHAW. Large transit vehicle accidents and protection for wheelchair ridersFigure 5.Ontario Ministry of Transportation database 1999 to 2001: % of passengers injured in both contact and noncontact events, injury severity, andestimated preevent bus speed.one van were involved in claims 9,500 (Tables 8 and 9).The majority of these claims involved a bus crash (17/29).WSTIP provided detailed information for the mostsevere crash that involved a fixed-route transit bus whosedriver passed out from an apparent heart attack in March1999. The bus, with 36 passengers onboard, hit concretebarriers with its left and right front corners injuring 22passengers and the driver. The driver and 13 passengerswere taken to area hospitals. Passengers interviewed atthe hospital described “a scene of bodies flying aroundand a lot of chaos.” The passengers, suffering no seriousinjuries, were all treated and released. The front of thebus was extensively damaged (Figure 7). Estimated busrepair costs were 41,000 excluding replacement parts.Eleven cases did not involve a crash. Six of thesecases (four nonwheelchair riders and two wheelchair riders) involved braking.Table 10 outlines the four wheelchair rider incidents(two that did not involve a crash and two that did) and theassociated claim costs. The average wheelchair riderclaim cost for claims 9,500 was 65,496, which is60 percent higher than that of the average claim for nonwheelchair riders ( 41,059). All four of the noncrashwheelchair events were among the 10 most costly eventtypes despite having only one or two claimants per event(Table 11). The ratio of wheelchair rider claims 9,500to other rider claims (4/29 0.14) is much higher thanthe 0.0024 ratio of wheelchair riders to general ridersestimated for Seattle, a city with a large percentage ofwheelchair riders [15]. The ratio of all wheelchair riderclaims to other rider claims (53/1,333 0.04) is alsomuch higher than this estimated ratio of wheelchair ridersto general riders.The following is a summary of WSTIP databasefindings:1. During the study period, 12 percent of the property andinjury claims involved a crash. A transit bus wasinvolved in 147 of the crashes and a van or paratransitvehicle in 15.2. A severe crash, as evidenced by extensive bus damageand passengers being thrown out of their seats, injured22 of the 36 passengers but caused no serious injuries.3. The four wheelchair rider claims 9,500 occurredaboard a paratransit vehicle and did not involve acrash. The average wheelchair rider claim event monetary total was higher than that for
(MOT), the Washington State Transit Insurance Pool (WSTIP), and the New York State DOT (NYSDOT). Because much of the data comprised small sample sizes from individual transit providers, I was unable to use statis-tical data analysis methods or validate assumptions that regional data was representative of the United States as a whole.