Transcription
Soumillon et al. Supplementary InformationMaterials and MethodsCell cultureHuman adipose-derived stem/stromal cells (hASCs) isolated from lipoaspirates and purified byflow-cytometry (CD29, CD44, CD73, CD90, CD105 and CD166 positive; CD14, CD31, CD45 andLin1 negative) were obtained from Life Technologies (lot# 2117 for SCRB-seq and lot# 2118 forsingle cell RT-qPCR and single molecule FISH).The hASCs were cultured in a 2% reduced serum medium (MesenPro RS, Life Technologies) andexpanded for no more than 3 passages. The cultures were then induced to differentiate towardsan adipogenic fate after reaching 80% confluency (differentiations D1 and D2) or two days afterreaching 100% confluency (differentiation D3, and for qPCR and smFISH) by switching fromgrowth medium to the StemPro adipogenesis differentiation medium (Life Technologies).Following induction, the differentiation medium was changed every three days for up to 14days. The variation in initial conditions (confluency upon differentiation) was introduced toassess the robustness of the subsequent time course data.Single cell isolationCells were harvested using TrypLE Express (Life Technologies) and medium removed by pelletingthe cells in a centrifuge (5 min at 1000 rpm). RNA was stabilized by immediately resuspendingthe pelleted cells in RNAprotect Cell Reagent (Qiagen) and RNaseOUT RecombinantRibonuclease Inhibitor (Life Technologies) at a 1:1000 dilution.Just prior to fluorescence-actived cell sorting (FACS), the cells were diluted in PBS (pH 7.4, nocalcium, magnesium or phenol red; Life Technologies) and stained for viability using Hoechst33342 (Life Technologies). 384-well SBS capture plates were filled with 5µl of a 1:500 dilution ofPhusion HF buffer (New England Biolabs) in water and cells were then sorted into each wellusing a FACSAria II flow cytometer (BD Biosciences) based on Hoechst DNA staining(Supplementary Figure 3, top). After sorting, the plates were immediately sealed, spun down,cooled on dry ice and then stored at -80 C.For lipid content-based FACS, cells were also stained with HSC LipidTOX Neutral Lipid Stain (LifeTechnologies) and sorted according to their relatively “high” or “low” lipid content(Supplementary Figure 3, bottom), either by taking the top and bottom 20% of stained cells (D2)or the top and bottom 50% (D3).The plates collected for SCRB-seq analysis are summarized in Supplementary Table S1.SCRB-Seq of sorted single cellsFrozen cells were thawed for 5 minutes at room temperature. For the second time course (D3)only, we further optimized lysis conditions by adding treatment with proteinase K (200µg/mL;1
Soumillon et al. Supplementary InformationAmbion) followed by RNA desiccation to inactivate the proteinase K and simultaneously reducethe reaction volume (50 C for 15 in sealed plate, then 95 C for 10 min with seal removed ).The key library construction steps are summarized in Supplementary Figure S1. To start, dilutedERCC RNA Spike-In Mix (1µl of 1:107 for D1/D2 or 1µl of 1:106 for D3; Life Technologies) wasadded to each well and the previously described template switching reverse transcriptionreaction 1 was then carried out using either SmartScribe Reverse Transcriptase (D1/D2;Clontech) or Maxima H Minus Reverse Transcriptase (D3; Thermo Scientific), our universaladapter E5V6NEXT (1 pmol, G-3’where iC: iso-dC, iG: iso-dG, rG: RNA G, and our barcoded adapter E3V6NEXT (1 pmol, IntegratedDNA TCCGATCT[BC6]N 10 T 30 VN-3'where 5Biosg 5’ biotin, [BC6] 6bp barcode specific to each cell/well (Supplementary TableS2), N 10 Unique Molecular Identifiers.Following the template switching reaction, cDNA from 384 wells were pooled together, andthen purified and concentrated using a single DNA Clean & Concentrator-5 column (ZymoResearch). Pooled cDNAs were treated with Exonuclease I (New England Biolabs) and thenamplified by single primer PCR using the Advantage 2 Polymerase Mix (Clontech) and ourSINGV6 primer (10 pmol, Integrated DNA 3’Full length cDNAs were purified with Agencourt AMPure XP magnetic beads (0.6x, BeckmanCoulter) and quantified on the Qubit 2.0 Flurometer using the dsDNA HS Assay (LifeTechnologies). Full-length cDNA was then used as input to the Nextera XT library preparation kit(Illumina) according to the manufacturer’s protocol, with the exception that the i5 primer wasreplaced by our P5NEXTPT5 primer (5µM, Integrated DNA TTTCCCTACACGACGCTCTTCCG*A*T*C*T*-3’where * phosphorothioate bonds.The resulting sequencing library was purified with Agencourt AMPure XP magnetic beads (0.6x,Beckman Coulter), size selected (300-800bp) on a E-Gel EX Gel, 2% (Life Technologies), purifiedusing the QIAquick Gel Extraction Kit (Qiagen) and quantified on the Qubit 2.0 Flurometer usingthe dsDNA HS Assay (Life Technologies).2
Soumillon et al. Supplementary InformationLibraries were sequenced on Illumina Hiseq paired-end flow cells with 17 cycles on the first readto decode the well barcode and UMI, an 8 cycle index read to decode the i7 Nextera barcodeand finally a 34 cycle second read to sequence the cDNA.SCRB-Seq on bulk samplesPopulations of both unsorted and sorted cells were lysed in QIAzol (Qiagen) and RNA wasextracted and purified using Direct-zol RNA MiniPrep (Zymo Research). SCRB-Seq DGE librarieswere prepared from 10 ng of extracted total RNA, using the protocol previously described forsingle cells with the exception of using more concentrated E3V6NEXT and E5V6NEXT (10 pmol)and a version of E3V6NEXT that did not contain the well-specific 6bp barcodes but instead a16bp UMI (Integrated DNA Technologies), :5'-/5Biosg/ACACTCTTTCCCTACACGACGCTCTTCCGATCTN 16 T 30 VN-3'Single cell RT-qPCRSingle cells were sorted into 384-well plates, frozen at -80 C, thawed for 5 min at roomtemperature, treated with proteinase K (200µg/mL, Ambion) and desiccated as described above.cDNA synthesis was carried out in each well using SuperScript VILO (2µl final volume; LifeTechnologies). qPCR was then performed on the total cDNA output using FAM and VIC Taqmanprobes (Life Technologies) and processed on an Applied Biosystems ViiA 7 Real-Time PCR system(Life Technologies).Single-molecule FISHProbes targeting LPL, G0S2 and TCF25 transcripts were synthesized as amine-conjugatedoligonucleotides and then labelled with Cy5 (GE Healthcare), Alexa Fluor 594 (Molecular Probes)or 6-TAMRA (Molecular Probes; Supplementary Table S3). Hybridizations and washes wereperformed using modifications to previously described procedures 2. Prior to hybridizations,lipids were extracted by incubation of fixed cells in 2:1 chloroform:methanol for 30 min at roomtemperature. Cells were washed quickly with 70% ethanol and then resuspended in 200µl RNAHybridization buffer containing 2 SSC buffer, 25% Formamide, 10% Dextran Sulphate (Sigma),E. coli tRNA (Sigma), Bovine Serum Albumin (Ambion), Ribonucleoside Vanadyl Complex and 150ng of each desired probe set (the mass refers only to pooled oligonucleotides, excludingfluorophores, and is based on absorbance measurements at 260 nm). Hybridizations wereperformed for 16-18 h at 30 C, after which cells were washed twice for 30 min at 30 C in RNAWash buffer (containing 2 SSC buffer, Formamide 25% (Ambion) and 100 ng/ml DAPI). Formicroscopy, cells were resuspended in a mounting solution containing 1 x PBS 0.4% Glucose,100 µg/ml Catalase, 37 µg/ml Glucose Oxidase and 2 mM Trolox and immobilized on poly-llysine coated chambered cover glasses.Imaging was performed as described earlier 3 using an inverted epi-fluorescence microscope(Nikon) equipped with a high-resolution CCD camera (Pixis, Princeton Instruments) and a 100 magnification oil immersion, high numerical aperture Nikon objective. An image stack consisting3
Soumillon et al. Supplementary Informationof 50 image planes spaced 0.3 µm apart was acquired per region of interest. Individual imageswere filtered with a high-pass Fast Fourier Transform filter, where the filter cutoff was chosen topreserve diffraction-limited signals. Filtering was repeated on the resulting image of themaximum projection. Signal positions, widths, and intensities were quantified by fitting 2DGaussians approximating the point-spread function (PSF) of the microscope. To separatesporadic signals caused by autofluorescence or non-specifically bound probes from real mRNAsignals, signals were filtered based on width and signal-to-noise ratio. Cells were segmentedmanually and signals were assigned to individual cells.Computational analysis of sequence dataAll second sequence reads were aligned to a reference database consisting of all human RefSeqmRNA sequences (obtained from the UCSC Genome Browser hg19 reference set:http://genome.ucsc.edu/), the human hg19 mitochondrial reference sequence and the ERCCRNA spike-in reference sequences using bwa version 0.7.4 4 with non-default parameter “-l 24”.Read pairs for which the second read aligned to a human RefSeq gene were kept for furtheranalysis if 1) the initial six bases of the first read all had quality scores of at least 10 andcorresponded exactly to a designed well-barcode and 2) the next ten bases of the first read (theUMI) all had quality scores of at least 30. Digital gene expression (DGE) profiles were thengenerated by counting, for each microplate well and RefSeq gene, the number of unique UMIsassociated with that gene in that well. Python scripts implementing the alignment and DGEderivation are available from the authors upon request.Computational analysis of DGE profilesAll computational and statistical analyses were performed using Python 2.7 with the EnthoughtCanopy Distribution (http://www.enthought.com), Numpy 1.8.0 and Scipy 0.13.0(http://www.scipy.org/), scikit-learn 0.14 (http:// http://scikit-learn.org/) and Matplotlib 1.3.1(http://matplotlib.org/).For each plate, wells with less than 1,000 or more than 10,000 total UMI counts werediscarded (24% of all wells, largely low-value wells). The UMI counts for each gene in theremaining wells were then normalized by dividing by the sum of UMI counts across all genes inthe same well. We emphasize that this normalization removes variation from differences in RNAcontent per cell and should be revisited for analyses that are sensitive to this phenomenon.Pairwise Pearson correlations between genes across single cells and their associated pvalues were computed using the scikit-learn metrics.pairwise distances function.The 5% false discovery rate (FDR) thresholds were estimated from the p-value distribution usingthe Benjamini-Hochberg-Yukeli procedure 5. The expected null distributions of pairwisecorrelation coefficients were estimated by permuting expression values across cells from thesame time point and re-computing the pairwise correlations 100 times.Principal component analyses (PCA) were performed by first scaling the normalizedUMI-derived expression levels of each gene to zero mean and unit variance using the scikit-learnpreprocess.scale function and then applying the RandomizedPCA transformation. Eachtime course dataset was processed separately. To project lipid-sorted cell data into the4
Soumillon et al. Supplementary Informationcorresponding time course PC space, the time course and lipid-sorted expression values wereconcatenated and re-scaled prior to applying the time course PCA transformation.Gene set enrichment analyses (GSEA) were performed using the GSEAPreRankedmodule of the GSEA 2.0 software (http://www.broadinstitute.org/gsea/) with the MSigDB 4.0gene sets 6. Genes were ranked by the PC weights for interpretation of PC metagenes or by thesignal to noise metric (µ A µ B /σ A -σ B ) for comparisons of low and high lipid cells. Significant genesets were called at the threshold recommended by the GSEA developers (25% FDR).5
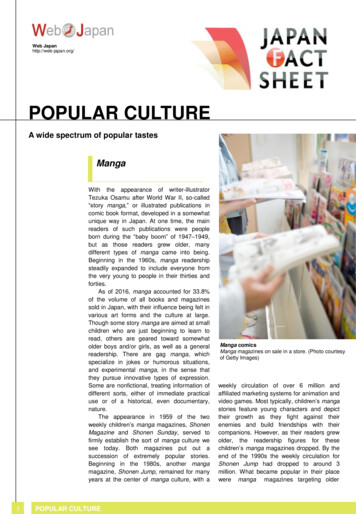
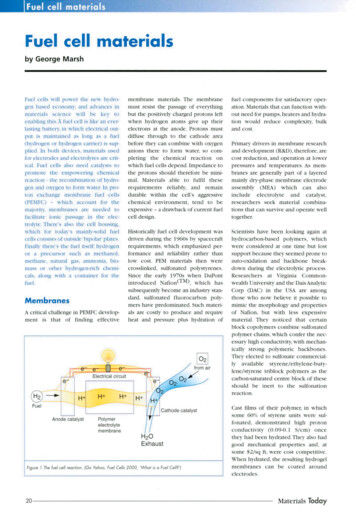
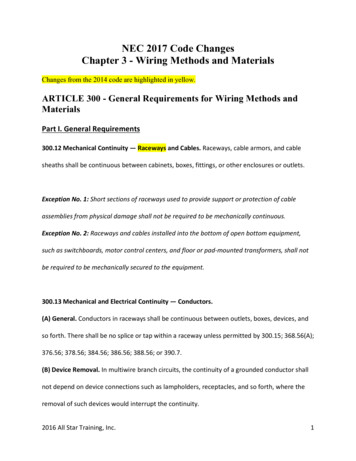
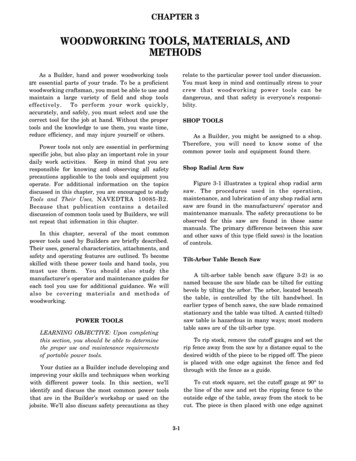
Soumillon et al. Supplementary InformationSupplementary Figure LegendsFigure S1 - Overview of the SCRB-Seq library construction protocol. Note that for simplicity,modified nucleotides are not shown. See Supplementary Methods for details.Figure S2 - FACS using Hoechst DNA (A) and LipidTOX neutral lipidstaining (B) for cellsdifferentiated at 80% confluency (D1/D2) or 2days after full confluency (D3). A significantdecrease in 4N cells can be observed between days 0 and 1 in the initial time course, which isconsistent with exit from the mitotic cell cycle, while more cells had already stopped dividing inthe more confluent culture. The offset distribution for day 14 cells in the Hoechst analysis is atechnical artefact.Figure S3 - Differentiating human adipose-derived stem/stromal cells (hASCs) with hematoxylinand oil red O staining. Independent cultures and differentiations used to check reproducibility ofthe cell culture protocol. The top two panels show a preliminary time course that was notharvested for profiling. The bottom row shows cells cultured during the D1 time course.Figure S4 - Comparison RefSeq gene expression levels as estimated from the total number ofaligned sequencing reads (raw) or the total number of unique UMIs. Each dot compares themean raw counts across all profiled cells in the first time course (D1) to the mean UMI countsfor the same gene. The raw and UMI counts are strongly correlated, but the UMI counts correctfor a systematic bias in the raw expression levels of a subset of genes, which is likely caused bypreferential PCR amplification or sequencing.Figure S5 - Relationship between the proportion of cells where a gene was detected (UMI count 1) and its estimated expression level from bulk RNA profiling. Data is shown for day 0 of theD3 differentiation time course. Solid line indicates the medians and the top and bottom dottedlines the 90th and 10th percentiles, respectively. UPM UMI counts for a gene per million UMIcounts from all genes. Lack of detection of any one gene in a cell can be attributed to acombination of technical and biological variation.Figure S6 – Excess of positively and negatively correlated gene pairs at selected time points inthe D1 and D3 time courses. Red indicates the observed number of genes showing a specificpairwise correlation. Blue indicates the estimated null distribution obtained by permuting geneexpression levels across cells prior to computing the correlation coefficients. FDR falsediscovery rate.Figure S7 – Comparison of A) SCRB-Seq and B) smFISH data for LPL and G0S2 during the D3 timecourse. SCRB-Seq values are in UPM, smFISH in mRNAs detected per cell. C) Shows arepresentative smFISH composite image from day 14 with LPL in green, G0S2 in red and a largelyuncorrelated gene TCF25 in blue. r Pearson’s correlation coefficient.6
Soumillon et al. Supplementary InformationFigure S8 - Gene expression dynamics at single cell resolution. A-C) Each scatter plot shows thefirst three PCs of the D3 hASC time course. Red dots show cells collected at the indicated timepoint, while blue dots show cells collected at all previous time points. D) Separately sorted cellswith high and low lipid content from day 7 projected into the same PC space.7
Soumillon et al. Supplementary InformationSupplementary References1.Islam, S. et al. Characterization of the single-cell transcriptional landscape by highlymultiplex RNA-seq. Genome Res. 21, 1160–7 (2011).2.Raj, A., van den Bogaard, P., Rifkin, S. A., van Oudenaarden, A. & Tyagi, S. Imagingindividual mRNA molecules using multiple singly labeled probes. Nat. Methods 5, 877–9(2008).3.Bienko, M. et al. A versatile genome-scale PCR-based pipeline for high-definition DNAFISH. Nat. Methods 10, 122–4 (2013).4.Li, H. & Durbin, R. Fast and accurate short read alignment with Burrows-Wheelertransform. Bioinformatics 25, 1754–60 (2009).5.Benjamini, Y. & Hochberg, Y. Controlling the false discovery rate: a practical and powerfulapproach to multiple testing. J. R. Stat. Soc. Ser. B. 57, 289–300 (1995).6.Subramanian, A. et al. Gene set enrichment analysis: a knowledge-based approach forinterpreting genome-wide expression profiles. Proc. Natl. Acad. Sci. U. S. A. 102, 15545–50 (2005).8
Figure S1Template switching1st strand TCTAGCCTTCTCGCAGCACATCCCTTTCTCACA-5'2nd strand TCTCACA-5'Resulting full length TCTCGCAGCACATCCCTTTCTCACA-5'Full length cDNA amplification:Single primer CA-5'5'-ACACTCTTTCCCTACACGACGC-3'Transposon based library ATGTGTAGAGGCTCGGGTGCTCTG-5'Library amplification CTCTTCCGATCT-3'Resulting library5' CCGAGCCCACGAGAC[i7]ATCTCGTATGCCGTCTTCTGCTTG 3'3' GGCTCGGGTGCTCTG[i7]TAGAGCATACGGCAGAAGACGAAC 5'SequencingRead 1 [BC6] UMI (N)10 -- 5' CCGAGCCCACGAGAC[i7]ATCTCGTATGCCGTCTTCTGCTTG 3'3' GGCTCGGGTGCTCTG[i7]TAGAGCATACGGCAGAAGACGAAC 5'Read 2 Nextera Index [i7] -- -- Read 3: 3'end cDNA fragment
Figure S2ADifferentiation startedat 80% confluency2NDay 0Day 1Day 2Day 3Day 5Day 7Day 9Day 148060100% of Maximum% of Maximum100Differentiation started2 days after full rentiation started2 days after full confluencyreplicate 2Day 14Day 740030020010010Differentiation started2 days after full confluencyreplicate 1Number ofcells10BNumber ofcells80202002NDay 0Day 3Day 7Day 14 20%300PE-Texas RedLipidTOX200100 50% 50% 20%00 10210310410500 102103Sorted cell populations based on either low or high lipid content104105
Figure S3day 0day 3day 7day ifferentiation,hematoxylinOil Red ODifferentiationD1,hematoxylinOil Red O50µm
Raw counts [ log10(x 1)]Figure S4UMI counts [log10(x 1)]
Proportion of profiled cells where gene was detectedFigure S5Bulk cell expression level (log10UPM)
Figure S6AD1, day 0B5% FDRD3, day 0106106105ObservedNull4Gene pairsGene .0Pairwise correlation (r)D1, day 35% FDR-0.2D3, day 30.00.20.40.60.81.05% FDR106105105Gene .20.00.20.40.60.8100-0.61.0Pairwise correlation (r)D1, day 7105Gene pairs410310101Pairwise correlation (r)0.60.81.00.60.85% 105ObservedNull-0.2-0.2D3, day 75% FDR10-0.4-0.4Pairwise correlation (r)6100-0.6ObservedNull410210-0.4Pairwise correlation (r)106Gene pairs103102100-0.6Gene pairs10ObservedNull4102105% FDR100-0.6-0.4-0.20.00.20.4Pairwise correlation (r)0.60.81.0
Figure S7ADay 0, r -0.02, p 0.44BDay 0, r 0.25, p 3.5 x 10-10300LPLLPL20010000G0S2Day 3, r 0.18, p 7.8 x 10-950100150G0S2200250300250300250300250300Day 3, r 0.51, p 4.3 x 10-27300LPLLPL20010000G0S250Day 7, r 22, p 5.9 x 10-13100150G0S2200Day 7, r 0.85, p 6.9 x 1
Mar 05, 2014 · added to each well and the previously described template switching reverse transcription reaction 1 was then carried out using either SmartScribe Reverse Transcriptase (D1/D2; Clontech) or Maxima H Minus Reverse Transcriptase (D3; Thermo Scientif