Transcription
Bacterial growth curveby OD600 and SoloVPEBiofactory Competence CenterJuly – September 2019Done byDr. Tanja Buch and Bc. Michaela Rollová
AbstractThe increase in the cell size and cell mass during the development of an organism is termed asgrowth. It is the unique characteristics of all organisms. The organism must require certain basicparameters for their energy generation and cellular biosynthesis. The growth of the organism isaffected by both physical and Nutritional factors. The physical factors include the pH, temperature,Osmotic pressure, Hydrostatic pressure, and Moisture content of the medium in which the organismis growing. The nutritional factors include the amount of Carbon, nitrogen, Sulphur, phosphorous, andother trace elements provided in the growth medium. Bacteria are unicellular (single cell) organisms.When the bacteria reach a certain size, they divide by binary fission, in which the one cell divides intotwo, two into four and continue the process in a geometric fashion. The bacterium is then known tobe in an actively growing phase. To study the bacterial growth population, the viable cells of thebacterium should be inoculated on to the sterile broth and incubated under optimal growth conditions.The bacterium starts utilising the components of the media and it will increase in its size and cellularmass.The dynamics of the bacterial growth can be studied by plotting the cell growth (absorbance)versus the incubation time or log of cell number versus time. The curve thus obtained is a sigmoidcurve and is known as a standard growth curve. The increase in the cell mass of the organism ismeasured by using the Spectrophotometer. The Spectrophotometer measures the turbidity or Opticaldensity which is the measure of the amount of light absorbed by a bacterial suspension. The degree ofturbidity in the broth culture is directly related to the number of microorganism present, either viableor dead cells, and is a convenient and rapid method of measuring cell growth rate of an organism.Thus, the increasing the turbidity of the broth medium indicates increase of the microbial cell mass.The amount of transmitted light through turbid broth decreases with subsequent increase in theabsorbance value.This traditional methodology relying on fixed pathlength UV spectroscopy can require severalminutes of stagnant time because of the need for careful sample handling, preparation (base-linecorrection), and (in particular) dilutions needed for bringing samples into the spectrophotometer’slinear range. The doubling time of many bacterial cells is very short. Errors created in performing thosedilutions and baseline corrections can take longer that the doubling time of bacterial cells and cansignificantly affect calculated sample optical density.The SoloVPE is the laboratory implementation of C Technologies, Inc.’s variable pathlengthtechnology using Slope Spectroscopy methods that are based upon the Slope Spectroscopy Equationwhich is fundamentally derived from Beer’s Law. Slope Spectroscopy analysis with variable pathlengthrequires no sample preparation, no baseline correction and no dilution of even the most highlycell-concentrated samples, saving substantial time without changing any other aspect of the assay.In this work, the bacterial growth curve by two methods during bacterial cells cultivation isinvestigated. These are the standard spectrophotometer and the SoloVPE method. For cultivation,Escherichia coli cells (E. coli K-12 W3110) and YPG medium were used. The bacterial growth curve wasdetermined and standard spectrophotometer and SoloVPE were compared. Additionally, a correlationbetween these two methods was found. This principle allows a fast and cheap method to analyzebacterial cells samples during bacterial cell cultivation by avoiding baseline corrections and dilutionsand getting accurate results faster and with less effort.i
AbbreviationsDI-waterECODOD600 Deionized water Escherichia coli Optical density Optical density at wavelength 600 nmii
Table of contents1Introduction . 1Theoretical part . 12Measuring principle . 12.1Bacterial growth curve . 12.2STD. SPECTROPHOTOMETER . 22.3SoloVPE . 33Measuring range, limitations and advantages . 43.1STD. SPECTROPHOTOMETER . 43.2SoloVPE . 4Practical Part . 54Experimental plan . 55Results and discussions . 55.1STD. SPECTROPHOTOMETER . 55.2SoloVPE . 65.3 Comparison of Standard spectrophotometer and SoloVPE . 76Conclusion . 107Sources . 11iii
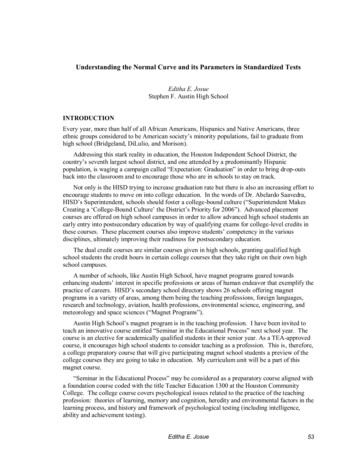
1IntroductionThe aim of this study is to detect the bacterial growth curve of E. coli by two methods, such as standardspectrophotometer and SoloVPE method. The cell-concentration range, which can be analyzed bythose methods, will be tested to show the reasonable statistical certainty and time consumption duringmeasurements. This allows to find the most suitable method for further bacterial cells analysis duringbacterial cells cultivation.Theoretical part22.1Measuring principleBacterial growth curveThe growth curve has four distinct phases (Fig 1)Figure 1: Different phases of bacterial growth2.1.1 Lag phaseWhen a microorganism is introduced into the fresh medium, it takes some time to adjust with thenew environment. This phase is termed as Lag phase, in which cellular metabolism is accelerated,cells are increasing in size, but the bacteria are not able to replicate and therefore no increase in cellmass. The length of the lag phase depends directly on the previous growth condition of the organism.When the microorganism growing in a rich medium is inoculated into nutritionally poor medium, theorganism will take more time to adapt with the new environment. The organism will startsynthesising the necessary proteins, co-enzymes and vitamins needed for their growth and hencethere will be a subsequent increase in the lag phase. Similarly when an organism from a nutritionallypoor medium is added to a nutritionally rich medium, the organism can easily adapt to theenvironment, it can start the cell division without any delay, and therefore will have less lag phase itmay be absent.2.1.2 Exponential or Logarithmic (log) phaseDuring this phase, the microorganisms are in a rapidly growing and dividing state. Their metabolicactivity increases and the organism begin the DNA replication by binary fission at a constant rate. The1
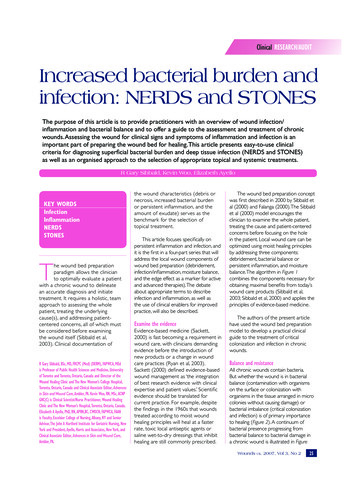
growth medium is exploited at the maximal rate, the culture reaches the maximum growth rate andthe number of bacteria increases logarithmically (exponentially) and finally the single cell divide intotwo, which replicate into four, eight, sixteen, thirty two and so on (That is 20, 21, 22, 23.2n, n isthe number of generations) This will result in a balanced growth. The time taken by the bacteria todouble in number during a specified time period is known as the generation time. The generationtime tends to vary with different organisms. E.coli divides in every 20 minutes, hence its generationtime is 20 minutes, and for Staphylococcus aureus it is 30 minutes.2.1.3 Stationary phaseAs the bacterial population continues to grow, all the nutrients in the growth medium are used up bythe microorganism for their rapid multiplication. This result in the accumulation of waste materials,toxic metabolites and inhibitory compounds such as antibiotics in the medium. This shifts theconditions of the medium such as pH and temperature, thereby creating an unfavourableenvironment for the bacterial growth. The reproduction rate will slow down, the cells undergoingdivision is equal to the number of cell death, and finally bacterium stops its division completely. Thecell number is not increased and thus the growth rate is stabilised. If a cell taken from the stationaryphase is introduced into a fresh medium, the cell can easily move on the exponential phase and isable to perform its metabolic activities as usual.2.1.4 Decline or Death phaseThe depletion of nutrients and the subsequent accumulation of metabolic waste products and othertoxic materials in the media will facilitates the bacterium to move on to the Death phase. Duringthis, the bacterium completely loses its ability to reproduce. Individual bacteria begin to die due tothe unfavourable conditions and the death is rapid and at uniform rate. The number of dead cellsexceeds the number of live cells. Some organisms which can resist this condition can survive in theenvironment by producing endospores.2.2Standard spectrophotometerThis method allows to determine the turbidity or Optical density which is the measure of the amountof light absorbed by a bacterial suspension. The degree of turbidity in the broth culture is directlyrelated to the number of microorganism present, either viable or dead cells, and is a convenient andrapid method of measuring cell growth rate of an organism. Thus, the increasing the turbidity of thebroth medium indicates increase of the microbial cell mass (Fig 2). The amount of transmitted lightthrough turbid broth decreases with subsequent increase in the absorbance value.Figure 2: Absorbance reading of bacterial suspension2
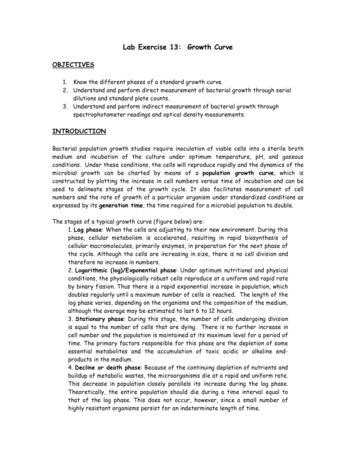
2.3SoloVPEBy evolving beyond the limitations of traditional fixed pathlength spectroscopy, the SoloVPE methodexpanded the mature UV-Vis technique from a 2-dimensional to a 3-dimensional science. Conceptuallysimple, but analytically empowering, C Technologies’ variable pathlength solutions (shown in figure 3)have revolutionized the measurement of concentration by delivering rapid and accurate results whileavoiding costly dilution and background correction steps on the widest range of samples which is allmade possible by the Slope Spectroscopy technique.Unlike the single value dependence of legacy UV-Vis methods, the data dense slope methodcharacterizes samples by collecting multiple absorbance data points at several pathlengths to create asection curve (Absorbance vs. Pathlength plot). Light is transmitted through the sample via an opticalfiber or fibrette (shown in figure 4). Using a step motor to control the pathlengths from 5 µm to 15mm (depending on a vessel type, that are shown in figure 5) in as small as 5 µm steps. The sectioncurve is then analyzed in real time to verify linearity in compliance with the Beer-Lambert Law. Thelinear region of the section curve is directly proportional to the concentration of the sample basedupon the sample extinction coefficient. Capable of making spectral and fixedpoint measurements atwavelengths between 190 and 1100 nm and at pathlengths between 5 microns and 15 millimeters,this relationship allows the SoloVPE system to measure low and high concentrated samples directlyand report concentration results in less than 60 seconds.Figure 3: Schematic principle of variable pathlength ofSoloVPE method [12]Figure 4: Fibrettes - Disposable or reusable Solid core UV transmissive silica [12]3
UV quartz vesselsDisposable UV plastic vessel (small)Figure 5: Vessels - Disposable or reusable vessels for SoloVPE method [12]3Measuring range, limitations and advantages3.1Standard spectrophotometerThe OD measuring range found in the literature of the standard spectrophotometer method isapproximately between 0.5 g/L and 1.0 g/L. A wavelength of 600 nm is used to determine the bacterialcell concentration/optical density. The bacterial cells absorption properties are around absorbance of1. Because bacterial cells, that absorb at 600 nm, will may not absorb at wavelength higher or lowerthan 600 nm, with higher cell-concentrations it leads to an error in the measuring result.By using wavelength of 600nm, disposable plastic cuvettes must be used to avoid any interferenceswith the cuvette during the measurement. Limitations of this method are, as already mentioned, theabsorption properties of the bacterial cells and the interferences with cultivation medium, in otherwords, the need of dilutions and baseline corrections. However, this method is simple to use and nondestructive which allows a fast and reliable measure of bacterial cells growth.3.2SoloVPEThe measure range of the SoloVPE method for bacterial cell cultivation is not determined. The greatadvantage of SoloVPE method is that still OD600 and Beer’s Law is applied, however it can keep chosenspecific concentration or extinction coefficient fixed by changing the pathlength to take linearmeasurements. Capable of making spectral and fixed-point measurements at wavelengths between190 and 1100 nm at pathlengths between 5 µm and 15 mm, the SoloVPE Solution is adaptable to awide range of sample types and concentrations. Finally, it can be said that this method allows a fastanalyze of a high range of proteins. However, like all methods, the SoloVPE method has somedisadvantages, these are mainly the beginning investment price and consumability of fibrettes andvessels.4
Practical Part4Experimental planTo measure the growth curve for E. coli, two samples (one from each shake flask) are taken every 30minutes in order to find the absorbance/optical density (OD) or Slope absorbance at wavelength 600nm and to test and compare the results detected by two methods, such as standardspectrophotometer and SoloVPE. To compare the results, E. coli K-12 W3110 cells and YPG medium(glucose added into the medium before autoclaving) were used. The cultivation was held in anincubator set to 37 C and 150 rpm.The comparison study is divided into three parts. The first part examines the growth curve detectedby standard spectrophotometer method. In the second part, the growth curve, determined by Slopeabsorbance using SoloVPE method is investigated. The third part of this study compares resultsdetected by standard spectrophotometer and SoloVPE method and examines the differences betweenof these methods. Furthermore, the correlation between the two methods is determined.4.1SoloVPE settings – Quick Slope- Slope Mode: Fixed- (next to the Slope Mode):- Start PL: 3 mm- Step PL: 0,15 mm- Sample vessel: SV1-Small- Wavelength: 600 nm- Extinction coefficient: 1 mL/mg.cm55.1Results and discussionsStandard spectrophotometerTable 1: Absorbance/Optical density of the E. coli suspension during bacterial cells cultivation measured bystandard spectrophotometer at wavelength of 600 nmAbsorbanceShake flask 1Shake flask 653,1803,0303,10500,106066Time [h]Standarddeviation5
Std. spectrophotometer - Average ime [h]Graph 1: Growth curve of the E. coli measured by standard spectrophotometer. Samples taken after 2.5hour of cultivation were diluted by dilution factor of 10 and then recalculated back to the real OD600.To investigate the OD600 for higher concentrations of E. coli cells by standard spectrophotometer,dilutions had to be done. First dilution was prepared after 2.5 hours of cultivation. For all dilutions, a10-fold dilution was performed.The repetability of the method was tested by repeating the E. coli cell cultivation in two or three shakeflasks three times. The results are presented in table 2. The standard spectrophotometer methodshowed a good repetability.5.2SoloVPETable 2: Slope absorbance of the E. coli suspension during bacterial cells cultivation measured by SoloVPE at 600 nmSlope absorbanceShake flask 1Shake flask ,0450,002050,044810,044440,0440,0003Time [h]Standarddeviation6
SoloVPE - Average Slope absorbance0,0500,045Slope 0,0000123456Time [h]Graph 2: Growth curve of the E. coli measured by SoloVPE.The repetability of the method was tested by repeating the E. coli cell cultivation in two or three shakeflasks three times. The SoloVPE method shows a good repetability.5.3 Comparison of Standard spectrophotometer and SoloVPEAdditionally, the results measured by two different methods, standard spectrophotometer andSolovPE, were compared. Both bacterial growth curves had the same shape. A correlation betweenthese two methods was determined. Furthermore, a recalculation from SoloVPE results to OD600(Standard spectrophotometer) results by the linear regression function was done. It was found, thatwith larger differences in R2 (R2 97,5 % or lower) it is impossible to recalculate results detected bySoloVPE (Slope absorbances), because the values are very small and the RSD of 2,5 % or higher has asignificant impact on the recalculations.7
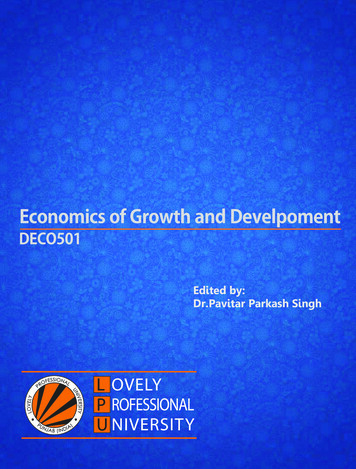
Comparison of Std. spectrophotometer and SoloVPESoloVPE Slope Absorbance0,050,050,040,04y 0,0091x 0,0149R² 53,03,5Std. spectrophotometer AbsorbanceGraph 3: Correlation between results detected by standard spectrophotometer and SoloVPETable 3: Recalculation of results detected by SoloVPE (Slope absorbance) during E. coli cultivation into results detectedby standard spectrophotometer (Absorbance/OD600) using a function (y 0,0091x 0,0149)AbsorbanceShake flask 1Shake flask 463,2660,0288Time [h]8
Recalculated absorbance/OD600from Slope absorbance detected by 6Time [h]Graph 4: Growth curve of the E. coli from recalculated resultsThe repetability and accuracy of determined function was tested by recalculation all SoloVPE results(Slope absorbances) from three different E. coli cultivations. All measured data were recalculated andgrowth curves that were plotted from the recalculated OD600 showed identical shapes. The functionshows a good repeatability and precision and can be used for recalculation Slope absorbances (SoloVPEresults) to standard absorbances (OD600) values, that are detected by standard spectrophotometer.9
6ConclusionIt can be concluded that the E. coli cells grew as described in the literature. After 3 hours of cultivation,due to the strong interferences with high cell-concentrated samples, dilutions had to be performed todetermine the OD600 by standard spectrophotometer. The SoloVPE method allowed to measure cellsuspension without using any dilutions and baseline corrections.The difference in growth curves between these two methods can be described by detecting differentparameters by each device. The standard spectrophotometer detects the absorbance, but the SoloVPEdetects Slope absorbance with a unit Abs/mm, that is determined from ten measurements ofabsorbances in ten different pathlenthgs. Overall, the to growth curves are very similar in shape.Additionally, a correlation between these two methods for bacterial cell quantification during bacterialcell cultivation was found. Furthermore, a SoloVPE results were recalculated into OD600 (standardspectrophotometer) values by using a function that was determined by linear regression.Finally, it can be said that SoloVPE method is suitable for measuring the optical density of cells duringbacterial culture. This method is less time consuming and can be recalculated to standard OD600values by using one simple function.10
7Sources[1] https://vlab.amrita.edu/?sub 3&brch 73&sim 1105&cnt 1[2] S0960982210005245[3] https://jb.asm.org/content/189/23/874611
spectrophotometer and SoloVPE method. The cell-concentration range, which can be analyzed by those methods, will be tested to show the reasonable statistical certainty and time consumption during measurements. This allows to find the most suitable method for further bacterial cells analysis during bacterial cells cultivation. Theoretical part