Transcription
(2022) 41:234Shi et al. J Exp Clin Cancer Reshttps://doi.org/10.1186/s13046-022-02445-8Open AccessRESEARCHProteotranscriptomics of ocular adnexalB‑cell lymphoma reveals an oncogenic roleof alternative splicing and identifies a diagnosticmarkerJiahao Shi1,2†, Tianyu Zhu1,2†, Huimin Lin1,2†, Zhen Liu3, Min Zhou1,2, Ziyao Yu1, Xiaowen Zhou1,2, Xin Song1,2,Yefei Wang1,2, Renbing Jia1,2, Xianqun Fan1,2* and Yixiong Zhou1,2,4*AbstractBackground: Ocular adnexal B-cell lymphoma (OABL) is a rare subtype of non-Hodgkin lymphoma. The molecularcharacteristics of OABL remain poorly understood. We performed an integrated study to investigate the proteotranscriptome landscape and identify novel molecular characteristics and biomarkers of OABL.Methods: Integrated quantitative proteome and transcriptome were performed on 40 OABL 12 idiopathic orbitalinflammation, 6 reactive lymphoid hyperplasia, and 13 aesthetic orbital plastic surgery specimens. Complete clinicopathologic and prognostic data of the patients were recorded.Results: We identified high global protein-mRNA concordance as a novel characteristic of OABL. High concordancewas related to OABL recurrence. By integrated expression profile, motif enrichment and trend analysis, we foundthat alternative splicing is inflammation-independently dysregulated in OABL. After portraying the aberrant alternative splicing event landscape, we demonstrated the oncogenic role of ADAR, a core splicing regulator that regulatesthe splicing of Rho GTPase and cell cycle members. We found that ADAR regulates cell proliferation and Rho GTPaseinhibitor sensitivity of lymphoma. We identified DNAJC9 as a potential biomarker for OABL in proteomic analyses.Immunohistochemistry and immunofluorescent staining showed the nuclear staining of DNAJC9 was significantlyhigher in extranodal marginal zone lymphomas compared with inflammation specimens.Conclusions: These results provide an integrated gene expression profiling and demonstrate that high global protein-mRNA concordance is a prognosis-related molecular characteristic of OABL. We portray the alternative splicingevents landscape of OABL, and reveal the oncogenic role of ADAR. We identified strong nuclear staining of DNAJC9 asa promising pathology diagnostic biomarker for extranodal marginal zone lymphomas.Keywords: Lymphoma, Ocular adnexal lymphoma, Proteomics, Alternative splicing, ADAR, Biomarker†Jiahao Shi, Tianyu Zhu and Huimin Lin contributed equally to this work.*Correspondence: Fanxq@sjtu.edu.cn; zhouyixiong21@gmail.com2Shanghai Key Laboratory of Orbital Diseases and Ocular Oncology,Shanghai, P.R. China4Ninth People’s Hospital, Shanghai Jiao Tong University Schoolof Medicine, Shanghai 20001, P.R. ChinaFull list of author information is available at the end of the articleBackgroundLymphomas are malignant lymphoid tumors that arise asthe clonal proliferation of lymphocytes classified as nonHodgkin lymphomas (NHLs) and Hodgkin lymphomas.Ocular adnexal lymphoma (OAL) is a rare form of malignant lymphoid proliferation that constitutes 1–2% ofNHLs. OALs arise in the conjunctiva, eyelids, and orbit, The Author(s) 2022. Open Access This article is licensed under a Creative Commons Attribution 4.0 International License, whichpermits use, sharing, adaptation, distribution and reproduction in any medium or format, as long as you give appropriate credit to theoriginal author(s) and the source, provide a link to the Creative Commons licence, and indicate if changes were made. The images orother third party material in this article are included in the article’s Creative Commons licence, unless indicated otherwise in a credit lineto the material. If material is not included in the article’s Creative Commons licence and your intended use is not permitted by statutoryregulation or exceeds the permitted use, you will need to obtain permission directly from the copyright holder. To view a copy of thislicence, visit http:// creat iveco mmons. org/ licen ses/ by/4. 0/. The Creative Commons Public Domain Dedication waiver (http:// creat iveco mmons. org/ publi cdoma in/ zero/1. 0/) applies to the data made available in this article, unless otherwise stated in a credit line to the data.
Shi et al. J Exp Clin Cancer Res(2022) 41:234including the lacrimal gland [1, 2]. Most OALs are B-celllymphomas. Extranodal marginal zone B-cell lymphoma(EMZL) is the most frequent subtype of OABL (55–69%),followed by diffuse large B-cell lymphoma (DLBCL) (10–15%) [3–6].While gene expression profiling has led to landmarkdiscoveries of NHLs, few studies have examined ocularadnexal B-cell lymphomas (OABLs) [7–9]. Furthermore,defining the biology of NHLs solely based on the transcriptome is challenging. By combining proteomic andtranscriptomic data, proteotranscriptome-based studies have revealed novel insights into the developmentand progression of malignancies [10, 11], with findingsthat cannot be revealed by mRNA-based studies. Byinvestigating mass spectrometry (MS)-based TMT labeling quantitative proteome and transcriptome, we provided an integrated gene expression landscape of OABL,revealed the global protein-mRNA concordance as anovel prognostic-related disease characteristic, and identified a novel pathology diagnostic marker.Our analysis also revealed the importance of the alternative splicing pathway in OABL. It is a posttranscriptional gene regulation approach, which contributes toprotein diversity [12]. Dysregulation of alternative splicing has been shown to contribute to the development andprogression of various types of malignancy [13]. Whilesome studies have identified mutation of SFs in mantlecell lymphomas (MCLs), alternative splicing in NHLs hasnot been well studied [14]. We provided a landscape ofalternative splicing events (ASEs) as well as their potential biological implication in OABL and further demonstrated the oncogenic nature of the splicing regulatorADAR in OABL.Page 2 of 17Tong University School of Medicine (protocol SH9H2019-T185–2). Informed consent was obtained from allpatients enrolled in the proteomic and transcriptomicanalysis. The clinical characteristics of these patients (40OABL patients and 31 controls) are summarized in Supplementary Table S2.Protein sample preparation and sequencingProteomic and transcriptomic data were generated from71 samples from the above-mentioned patients. Thepathological sections were reviewed by three pathologists to validate the diagnosis before sequencing. Allspecimens were stored at 80 C until protein and RNAisolation, and sequencing was performed by Beijing CapitalBio Technology Inc.The experimental steps are described in the Supplementary Methods. Briefly, specimens were lysed usingprotein extraction buffer (8 M urea,0.1% SDS) containing1 mM phenylmethylsulfonyl fluoride (Beyotime Biotechnology, China) and protease inhibitor cocktail (Roche,USA). Tandem mass tags TMTpro (Pierce, USA) withdifferent reporter ions (126–131 Da) were applied as isobaric tags for relative quantification and TMT labelingwas performed following the manufacturer’s instructions.The MS analysis was conducted using an Q Exactivemass spectrometer (Thermo Scientific, USA). Proteomediscoverer software (version 1.4) (Thermo Scientific,USA) was used to perform database searching againstthe RefSeq database. The results were filtered using thefollowing settings: high confident peptides with a globalFDR 1% based on a target-decoy approach. The proteomic data have been uploaded into the iProX database(https:// www. iprox. org); (project ID IPX0004253000).MethodsPatient selection and ethical approvalRNA sample preparation and sequencingWe reviewed our medical records database to identifypatients confirmed by surgical biopsy at the Departmentof Ophthalmology, Ninth People’s Hospital, ShanghaiJiao Tong University School of Medicine from January2016 to February 2020. The inclusion criteria were asfollows: (1) diagnosis of histologically confirmed OABL,idiopathic orbital inflammation (IOI), reactive lymphoidhyperplasia (RLH), and patients who underwent orbitalplastic surgery for aesthetic reasons; (2) availability ofclinical and laboratory information at the time of diagnosis; and (3) specimen storage at 80 C. Clinical datawere obtained from medical records. IOI, RLH, and normal specimens were defined as controls. IOIs and RLHswere defined as the “inflammation” in subgroup analysis(Supplementary Table S1).The study protocol was approved by the institutionalreview board of Ninth People’s Hospital, Shanghai JiaoRNA samples were prepared using TRIzol reagent(Ambion, 15,596–026) following the manufacturer’sprotocol. The poly-A containing mRNA molecules werepurified from RNA using poly-T oligo-attached magneticbeads. The fragments were reversely transcribed intofirst strand cDNA using random hexamers, following bysecond strand cDNA synthesis using DNA polymerase Iand RNase H. PCR was used to selectively enrich DNAfragments with adapter molecules on both ends and toamplify the amount of DNA in the library. The librarywas qualified using the Agilent 2100 bioanalyzer andquantified by Qubit and qPCR. The produced librarieswere sequenced on the illumina Novaseq 6000 platform.Reads were aligned to hg38. The RNA-seq data havebeen deposited in the Gene Expression Omnibus database (https:// www. ncbi. nlm. nih. gov/ geo) under accessionnumbers GSE171059 and GSE199517.
Shi et al. J Exp Clin Cancer Res(2022) 41:234Page 3 of 17The AASEs in OABLs were identified using rMATS[15]. All the sequences and annotations used in thisanalysis were based on GRCh38 genome assembly. AnASE with a ΔInclevel value between the OABLs andcontrols of more than 5% ( ΔInclevel 0.05) and adjp-value of 0.01 was identified as an AASE. The list ofannotated splicing factors and regulators was downloaded from the SpliceAid-F database and the study byNostrand et al. [16, 17] (Supplementary Table S9).pLKO.1-shADAR#2:CCG G GC CCA C TG T TA TCT TCA C TT TCT CGA GAA AGT GAA GAT A AC AGT G GG CTT T TTG) were purchased from Shanghai Genomditech (Shanghai, China). Non-targeting shRNA wasused as the control. The lentiviral vectors and packaging vectors were transfected into the 293 T packagingcell line using the PolyJet In Vitro DNA TransfectionReagent (SignaGen). Retroviral vectors were transfected. Targeted cells were infected with lentivirus inthe presence of 8 μg/ml polybrene (Sigma).Differential expression analysisWestern blotFor transcriptomic data, low-abundance transcriptswere removed. For proteomic data, low-abundanceproteins and proteins missing in 20% patientswere removed, and K-nearest neighbor imputationmethod was used to complete values in proteomicdata for proteins missing in 20% patients. Differential expression analysis was performed using limmaR package (version: 3.46.0) [18] after normalization.We set log2(foldchange) log2(1.5) and p-value 0.05 as the threshold for transcriptome data, and log2(foldchange) log2(1.2) and p-value 0.05 as thethreshold for proteome data.Cells were lysed in mammalian protein extraction reagent (Pierce). After protein quantification using a bicinchoninic acid protein assay kit (Pierce), 60 μg of totalprotein was separated by 10% SDS-PAGE under denaturing conditions and transferred to PVDF membranes(Millipore). Membranes were blocked in 5% non-fat milk(Bio-Rad) and then incubated with primary antibodies,followed by incubation with a secondary antibody conjugated with horseradish peroxidase (1:10,000; AmershamBiosciences). Immunoreactive proteins were visualizedusing the LumiGLO chemiluminescent substrate (CellSignaling Technology). The primary antibodies used inthis study are as follows: b-Actin (1:10,000; Sigma); andADAR1 (1:1000; Cell Signaling Technology).AASE identification and analysisFunctional enrichment analysisThe Metascape tool (http:// metas cape. org) [19] wasused to identify biologic genesets of the selected genes.Gene Set Enrichment Analysis (GSEA, https:// w ww. gsea- msigdb. org) [20, 21] and Gene Set Variation Analysis (GSVA) [22] were performed to investigate deregulated genesets between groups. Particular MolecularSignatures Database collections were included in theGSEA and GSVA analyses. Hallmark (H), curatedcanonical pathways (C2:CP), and gene ontology BP (C5:GO BP) gene set collections were included to identifygenesets.Cells and cell cultureNHL cell lines were provided by Cell Bank and StemCell Bank, Chinese Academy of Sciences. The Rajiand SU-DHL-4 lymphoma cell lines were cultured inRPMI1640 (Invitrogen, CA) supplemented with 10%fetal bovine serum (Gibco) and 1% penicillin/streptomycin (Gibco) and maintained at 37 C in a 5% CO2humidified atmosphere.Virus transduction and generation of stable cell linesTwo individual lentiviral vectors containing shRNAs targeting human ADAR (pLKO.1-shADAR#1:CCG G CG G AT A C T A C A C CC ATC C AT T C T C GA G A A TG G ATG G G T G TA G TA TC C G T T T T TG ;Cell proliferation assayTo assess cell proliferation, a Cell Counting Kit-8 (CCK-8,New Cell & Molecular Biotech, China) was used following the manufacturer’s instructions. Cells were seededinto a 96-well plate at 1 103 cells per well with 100 μlmedium and cultured at 37 C with 5% CO2. CCK8 solution was added (10 μl per well) and cells were incubatedfor 3 h before measuring the absorbance at 450 nm.Immunohistochemistry (IHC) and immunofluorescent (IF)stainingIHC and IF were performed following standard procedures. Five-micron thick formalin-fixed paraffin embedded (FFPE) human tissue sections were used for theexperiments. Stained slides were digitized using the Pannoramic DESK (3D HISTECH) with a 40 objective lens.For IF, sections were stained with the Djc9 antibody(#NBP1–87903, Novusbio, 1:50) and CD20 antibody(#GB14030, Servicebio, 1:200) following the manufacturer’s instructions. Mean fluorescent intensity (MFI)was quantified using ImageJ (https:// imagej. nih. gov/ ij/). Colocalization analysis was performed using ImageJplugin JACoP.For IHC, sections were stained with the Djc9 antibody (#NBP1–87903, Novusbio, 1:500). Staining intensity score, nuclear staining intensity score, and staining
Shi et al. J Exp Clin Cancer Res(2022) 41:234percentage were quantified using ImageJ IHC Profilerplugin. Staining index was calculated as follows: staining intensity score (0–3) staining percentage (0–100%).Staining intensity score was graded as follows: score 0:negative staining, score 1: weak staining, score 2: moderate staining, score 3: strong staining.DefinitionsLocal recurrence was defined as lymphoma recurrenceat the orbital region. Distant recurrence was defined aslymphoma recurrence at an extra orbital site that wasnot initially involved. Progression-free survival (PFS)was calculated from the date of diagnosis to recurrence,progression, death, or the most recent follow-up. Overallsurvival (OS) was defined as the time from initial diseasediagnosis to death by any cause or until the most recentfollow-up. Recurrence-free survival (RFS), local recurrence-free survival (LRFS), and distant recurrence-freesurvival (DRFS) were calculated from the date of initialtreatment to the corresponding recurrence, or until themost recent follow-up.Statistical analysisAll statistical tests were two-sided and P-values 0.05were considered statistically significant. Statistical analyses were performed using the R software developed bythe R Development Core Team at R Bioconductor [23]and GraphPad Prism /).For comparison of continuous variables, we used theMann–Whitney U test for correlation results as previously mentioned [11], and the Student’s t-test for others. For correlation analysis, we applied the Spearmanrank correlation test for global protein-mRNA correlation following previous observations [24], and Pearson’scorrelation test for other continuous variables. Survivalcurves were generated using the Kaplan–Meier methodand compared by log-rank test. Cox proportional hazardsmodels were constructed to identify prognostic factorsfor OABL. Adjusted hazard ratios with 95% confidenceintervals were calculated. Logistic regression modelsand lasso regression models were constructed to identifydiagnostic markers for OABL.ResultsIntegrated proteotranscriptomic landscape of OABLTo obtain a comprehensive view of the molecular characteristics of OABLs, we performed an integratedproteomic and transcriptomic analysis of 40 OABLs,including 28 EMZLs, 8 DLBCLs, 2 MCLs, and 2 smalllymphocytic lymphomas (SLLs), and 31 control specimens including 12 IOIs, 6 RLHs, and 13 normal orbitaltissues (Supplementary Table S1, Fig. 1A). Because of thePage 4 of 17contamination of plasma proteins, TMT labeled liquidchromatography-mass spectrometry was not performedin one EMZL, three IOI, and two normal samples. Therefore, after a quality control process, we obtained proteomic data of 39 OABLs and 26 controls (SupplementaryTable S2). Because of RNA degradation, RNA-seq wasnot performed in 7 EMZLs, 1 DLBCL, 1 SLL, 4 IOIs, 3RLHs, and 7 normal tissues. After quality control, weobtained transcriptomic data of 31 OABLs and 17 controls (Supplementary Table S3).By performing hierarchical clustering of highly variable genes (HVGs) and samples in transcriptomic andproteomic data, we found that most of the OABLs andcontrols were divided into two groups. While OABLand normal specimens were clearly divided, some of theinflammation samples, especially RLH samples, weremisclassified into the OABL group (Supplementary Fig.S1). These results validated our sampling and analysisprocesses and echoed the observed association betweeninflammation and lymphoma [25–28].After removal of low-abundance transcripts/proteinsand completion of missing values, we mapped transcriptsand proteins to Ensembl IDs and detected 3639 proteinmRNA pairs in these samples. For these pairs, we calculated differentially expressed genes (DEGs) betweenOABLs and controls (Fig. 1B, Supplementary Table S4).The results showed that 787 genes were upregulatedand 542 genes were downregulated in the proteome ofOABLs compared with controls. Eight hundred six geneswere upregulated and 445 genes were downregulated inthe transcriptome of OABLs compared with controls.After matching results of omics data, we found that 451genes were concordantly upregulated (CO-UP), 386genes were concordantly downregulated (CO-DOWN),and 19 genes were discordantly dysregulated. The CO-UPDEGs were mainly enriched in immune-related, GTPasesignaling, negative regulation of phosphate metabolicprocess and DNA recombination terms. The CO-DOWNDEGs were mainly enriched in normal tissue development and organization, monocarboxylic acid, and arginine and proline metabolism terms (Fig. 1C).To avoid reported potential systematic biases [10], wefurther performed GSEA to identify overlapping dysregulated gene sets in OABLs. A total of 1023 gene sets werecommonly identified by proteomic and transcriptomicdata (Supplementary Table S5). Among these, 763 genesets were significantly dysregulated in at least one typeof omics (FDR 0.2), and 725 were concordantly dysregulated and 38 were discordantly regulated (Fig. 1D).Arranged by the sum of NES rank in each omic, CO-UPgene sets were mainly enriched in mRNA processing andsplicing, DNA damage and repair, and protein sumoylation. CO-DOWN gene sets were mainly enriched in
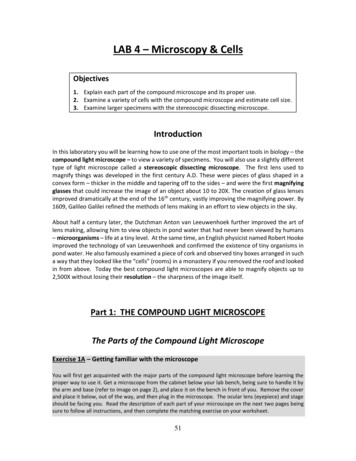
Shi et al. J Exp Clin Cancer Res(2022) 41:234Page 5 of 17Fig. 1 Proteotranscriptomic characteristics of OABL. A Sampling workflow of transcriptomic and proteomic cohort. B Scatterplot of differentiallyexpressed genes (DEGs) of 3639 protein-mRNA pairs identified in the transcriptomic cohort (31 OABLs and 17 controls) and the proteomic cohort(39 OABLs and 26 controls) between OABLs and controls. The horizontal line is at proteomic log2(FC) log2(1.2); vertical line is at transcriptomic log2(FC) log2(1.5). Genes with p 0.05 are labeled as black. C Bar plot of top 20 enrichment terms identified in concordant upregulated anddownregulated genes. D Bubble plot of differentially enriched gene sets identified by GSEA in the transcriptomic cohort (31 OABLs and 17 controls)and the proteomic cohort (39 OABLs and 26 controls) between OABLs and controls. Gene sets with FDR 0.2 in at least one of transcriptomic andproteomic analysis are displayed. E Bubble plot of top 15 up/down regulated gene sets identified by GSEA
Shi et al. J Exp Clin Cancer Res(2022) 41:234normal tissue development and organization, and aerobic glucose metabolism (Fig. 1E). As our study containedmultiple subtypes of OABL, we performed GSVA inthe proteomic data and examined the robustness of thedysregulations (Supplementary Fig. S2A, Supplementary Table S6, Supplementary Methods). The variationsof these top-ranked genesets were consistent among allfour subtypes. For discordantly dysregulated genes andpathways, immune, Golgi traffic and amide metabolismrelated gene sets were identified by DEG enrichment andGSEA analyses (Supplementary Fig. S2B, C).Global protein‑mRNA concordance is a distantrecurrence‑related characteristic of OABLNext, we examined the relationship between proteinand mRNA abundance and its association with diseasecharacteristics. Global protein-mRNA concordance wascomputed as the Spearman correlation result of all pairedprotein and mRNA abundance in each patient (Fig. 2A).We analyzed this concordance in patients with both proteomic and transcriptomic data (Fig. 1A). Consideringthe different transcript/protein abundance distributionbetween OABLs and controls, we analyzed proteinmRNA pairs separately in these two groups. We identified 3818 protein-mRNA pairs in OABLs and 3728 pairsin controls. The concordance was significantly higher inOABLs (median rho 0.364) than in controls (medianrho 0.208, p 0.01, Fig. 2B-C). Considering the association between inflammation and lymphoma [25–28], wecompared the global concordance across subgroup specimens. The results showed that OABLs exhibited a relatively higher concordance than other groups (median rhoof RLH 0.254, IOI 0.23, normal 0.16). These dataindicated that the increased correlation between proteinand mRNA abundance is a disease-associated characteristic of OABL.We next analyzed if the concordance is associatedwith disease aggressiveness. First, we compared theconcordance across subtypes, Ann Arbor stage, andprognostic risk factors (Fig. 2D). The concordancewithin no-EMZL subtypes was significantly higherthan that of EMZL (p 0.039), an indolent lymphomasubtype. High concordance was significantly associated with higher LDH (p 0.014) and IPI (p 0.046),Page 6 of 17two prognostic risk factors of NHL. High concordance was relatively associated with a higher Ann Arborstage (p 0.054) (Supplementary Fig. S3A). Next, weevaluated the correlation between proliferation abilityand global concordance (Fig. 2E). The result showed astrong positive association between Ki67 protein abundance and global concordance in OABLs (r 0.495,p 0.005), but this association was not present in thecontrols (r 0.203, p 0.527). Hence, higher globalconcordance was associated with disease aggressiveness solely in OABL.We then tested the correlation between the proteinmRNA concordance and OABL prognosis. We dividedOABL patients into two groups using the median valueof concordance and compared PFS, OS, RFS, LRFS, andDRFS between the two groups (Fig. 2G, SupplementaryFig. S3B). Among the 15 patients in the high rho group,6 showed recurrence, 1 showed local recurrence, and 6showed distant recurrence. For the 15 patients in the lowrho group, 2 showed recurrence, 1 showed local recurrence, and 1 showed distant recurrence (Supplementary Table S1). Survival analysis revealed that a globallyincreased concordance in OABL was significantly associated with reduced DRFS (p 0.037) and relatively associated with reduced RFS (p 0.083), but not with PFS(p 0.19) or OS (p 0.26).We then compared the global concordance betweenpatients with and without the recurrence events (Fig. 2F,Supplementary Fig. S3C). High concordance was significantly associated with distant recurrence events(p 0.0034) and recurrence events (p 0.0072), but notwith local recurrence events (p 0.41). We analyzed therelationship between the global concordance and recurrence in small B-cell lymphoma (SBL), EMZL, DLBCL,and other subtypes to ensure the robustness of the finding (Supplementary Fig. S3C). High concordance wassignificantly associated with distant recurrence events inSBL (p 0.0059) and EMZL (p 0.039). Despite the lowincidence of recurrence and limited number of patients,the median value of patients with distant recurrencewas still higher than that of patients without the eventsin DLBCL and other subtypes. These data demonstratedthat the high global protein-mRNA concordance was apredictive factor for distant recurrence in OABL.(See figure on next page.)Fig. 2 The match-subject analysis identifies global protein-mRNA concordance as an OABL-associated characteristic. A Schematic diagram ofglobal protein-mRNA concordance calculation. B Density plot showing the global Spearman correlation for protein-mRNA pairs within OABLs(n 3818 protein-mRNA pairs) and controls (n 3728 pairs). C Concordance of protein-mRNA pairs is significantly higher in OABLs compared withthe control or normal group and relatively higher compared with the RLP or IOI group. D Global protein-mRNA concordance is associated withprognostic risk factors. No-EMZL subtype, high LDH, and high IPI score have an increased concordance. E Global protein-mRNA concordance ispositively correlated with the MKI67 proteomic abundance in the OABLs (r 0.495, p 0.005) but not in the controls (r 0.203, p 0.527). Blueline shows liner regression. F High global protein-mRNA concordance is associated with distant recurrence in OABL. G Kaplan-Meier plot showshigh global concordance in OABLs is associated with decreased distant recurrence-free survival. H Bar plot of top 20 gene sets identified by GSVAcorrelated with global protein-mRNA concordance
Shi et al. J Exp Clin Cancer Res(2022) 41:234Page 7 of 17Fig. 2 (See legend on previous page.)Next, we investigated the potential regulators andbiological implications of the abnormally upregulatedglobal protein-mRNA concordance. Because the globalconcordance is an intrinsic continuous variable, weexamined the correlation between GSVA results andthe concordance (Fig. 2H). In the top 20 positively correlated genesets, 8 gene sets were TP53-related gene sets,and the others were mostly immune-related gene sets.
Shi et al. J Exp Clin Cancer Res(2022) 41:234ECM-associated gene sets accounted for the majority ofnegatively correlated gene sets.These findings indicate that increased global proteinmRNA concordance is a novel molecular characteristicof OABL that is associated with disease aggressivenessand higher risk of recurrence. This abnormally upregulated concordance in OABL is positively related to theTP53 pathway.Trend analyses identify alternative splicingas an inflammation‑independent signature of OABLIn the proteotranscriptomic data, we observed a similarity of molecular characteristics between inflammation and OABL samples through hierarchical clustering,principle component analysis, and global protein-mRNAconcordance (Fig. 2C, Fig. 3A-B, Supplementary Fig. 1).As previous studies demonstrated the activation of NFκBsignaling pathway in both inflammation and NHL [25,26], we performed hierarchical clustering in the NFκBsignaling pathway across subgroups (Fig. 3C). The abundance of NFκB-related genes progressively increasedfrom normals to inflammations, and to OABLs, whichwas consistent with the previous reports [25, 26]. However, issues remained as: what extent the similarity is;which pathways discriminate OABL from inflammation;and whether these pathways are driver events of OABL.To address these questions, we constructed a robustinflammation-OABL signature in proteomic data bysupervised and unsupervised clustering genes across thenormal, inflammation, and OABL groups. First, we performed the t-test of protein abundance between eachtwo groups and hypothesized nine dysregulated patterns of genes (Fig. 3F, Supplementary Methods). Mostwere constituted by the upregulated patterns (cluster3u24.6%; cluster2u, 21.94%; cluster4u, 11.68%). Interestingly, in these upregulated patterns, inflammations couldnot be discriminated from OABLs in a majority of genes(906/2144, 42.3%). We additionally performed an unsupervised k-means clustering for normalized HVGs (geneswith top 50% MAD, k 4) (Fig. 3D-E). Cluster numberswere determined by the elbow plot (Supplementary Fig.S4A).Page 8 of 17Combining the results of k-means clustering andt-test gene patterns, we identified five clusters of genes:inflammation mimic upregulated genes (MIMIC-UP),vaguely upregulated genes (VAGUE-UP), OABL specificupregulated genes (SPECIFIC-UP), inflammation mimicsdownregulated genes (MIMIC-DOWN), and OABL specific downregulated genes (SPECIFIC-DOWN) (Fig. 3G,Supplementary Table S7). Because upregulated genesconstituted most of the clustered proteins, we focusedon MIMIC-UP and VAGUE-UP, which representedextremely different patterns of dysregulation. MIMICUPs were mostly enriched in immune-related gene sets,while SPECIFIC-UPs were mostly enriched in gene setsthat related to mRNA metabolism and splicing, DNAdamage and metabolism, and chromatin remodeling(Fig. 3H).These results clearly demonstrated that the similarity between inflammation and OABL is not only in theNFκB pathway but also in a larger immune landscape.More importantly, we identified gene sets specificallydysregulated in OABL, including mRNA splicing andwell-known pathways associated with malignancy development (DNA damage, chromatin remodeling).Alternative splicing and its regulators potentially influenceOABL development and progressionAltern
To assess cell proliferation, a Cell Counting Kit-8 (CCK-8, New Cell & Molecular Biotech, China) was used follow-ing the manufacturer's instructions. Cells were seeded into a 96-well plate at 1 10 3 cells per well with 100 μl medium and cultured at 37 C with 5% CO 2. CCK8 solu-tion was added (10μl per well) and cells were incubated