Transcription
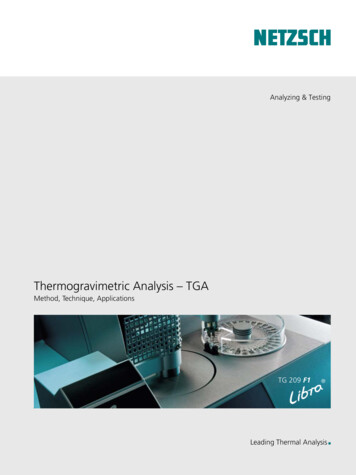
Analyzing & TestingThermogravimetric Analysis – TGAMethod, Technique, ApplicationsTG 209 F1Leading Thermal Analysis
Thermo-Microbalance TG 209 F1 Libra TGA – MethodThermogravimetry (TG) orThermogravimetric Analysis (TGA)is a well proven Thermal Analysismethod. TGA is used in the research &development of various substances andengineering materials – solid or liquid –in order to obtain knowledge abouttheir thermal stability and composition.In recent decades, TGA has been usedincreasingly for the quality controland assurance of raw materials andincoming goods as well as for failureanalysis of finished parts, especiallyin the polymer processing industry.Various international standards describethe general principles of thermogravimetry for polymers (ISO 11358) orother specific applications, such asSampleThermocoupleBalance2NETZSCH Analyzing & Testing has beenmanufacturing thermo-microbalancesfor many years. Our vertical, top-loadingdesign not only provides for easyoperation and sample loading, butalso allows gases to flow naturallyin an upward direction. Evolved gasanalyzers such as mass spectrometers,FT-IR spectrometers and/or GC-MS (gaschromatograph-mass spectrometers)can then be coupled directly at thetop of the unit. The automatic samplechanger (ASC) can also be used toconduct routine measurements aroundthe clock.Measuring PrincipleFurnaceSample carriercompositional analysis for rubber(ASTM D6370) and evaporation loss oflubricating oils (ASTM D6375).CompensationA thermobalance is used to measure themass change of a sample as a functionof temperature or time, under a definedand controlled environment with respectto heating rate, gas atmosphere, flowrate, crucible type, etc.
Measurement ResultThis TGA plot shows the decompositionof calcium oxalate monohydrate,CaC2O4 * H2O, in air at a heating rate of10 K/min. The decomposition occurs inthree mass loss steps with the release ofwater (12.3%), carbon monoxide(19.2%) and carbon dioxide (30.1%).The corresponding 1st derivative ofthe TGA curve, DTG, provides thedecomposition rate and is helpfulfor evaluating the mass loss stepsaccurately.TGA and DTG curves for the decomposition of calcium oxalate monohydrateAt a GlanceBeFlat : Automatic baselinecorrectionc-DTA : Caloric effects madevisibleCorrosion-resistant ceramicfurnanceVacuum-tight designPrecise ultra-microbalanceVertical, top-loading designCoupling to evolved gas analysisAutomatic sample changer (ASC)for up to 64 samplesTG 209 F1 Libra with automatic sample changer (ASC) Integrated gas supply unit with 3mass flow controllers3
TG 209 F1 Libra – Trendsetting TechnologySafe and Easy HandlingOne advantage of the TG 209 F1 Libra is its vertical, top-loading design whichguarantees free and safe access to thecrucible – there is no hang-down wirewith any danger of bending, and nohorizontal beam where crashing canoccur. When placing the crucible on thesample carrier, there is no effect to themicrobalance since the sample carrier isdetached by an automatic lifting device.Sample placement is therefore alwaystrouble-free.High Temperature and Fast HeatingRates in a Ceramic FurnaceThe maximum temperature of thecorrosion-resistant microfurnaceamounts to 1100 C (sampletemperature). Its high heating ratesof up to 200 K/min are suited foridentifying the material by a fast QCcheck. A water-cooled jacket providesthe micro-furnace with fast coolingand therefore allows for high samplethroughput.4High Stability under ThermostaticControlThe precise ultra-microbalance underthermostatic control provides highresolution of 0.1 µg in the large massmeasurement range of 2000 mg.Samples with a large mass changecan be continuously analyzed at ahigh precision level without switchingmeasurement ranges.c-DTA for additional informationon caloric effectsThe sample carrier type P (Platinel )provides the highest sensitivity forthe c-DTA signal, which serves forrecording endothermal and exothermaleffects via calculated DTA in a mannersimilar to DSC (Differential ScanningCalorimetry).
Defined Gas Conditions forReproducible MeasurementsThe vacuum-tight design allows a pureand defined inert gas atmosphere tobe established for the pyrolysis of thesample. No superimposed oxidation byresidual air can occur. The integrated gassupply unit with mass flow controllers(MFCs) accommodate two purge gasesand one protective gas. The MFCs canbe controlled, recorded and evaluatedvia the software. Gas switching canbe implemented automatically underreproducible conditions.Design of the TG 209 F1 Libra AutoVacTM and Vacuum Techniquefor More Accurate and ReproducibleResultsThe optional AutoVac feature forprogrammable automatic evacuation andgas filling provides uniform measurementconditions and therefore ensuresreproducible TGA results. When polymermixtures or blends are measured in avacuum, the boiling point depression oflow volatiles (e.g., solvents or plasticizers)can be realized. A better separationfrom the decomposition of the polymercomponent can be achieved.TMTechnical SpecificationsTemperature range(10 C) 20 C to 1100 CHeating and cooling rates0.001 K/min to 200 K/minCooling time (1100 C to 100 C)12 minMeasuring range2000 mgResolution0.1 µgAtmospheresinert, oxidizing, static, dynamicVacuum-tight design 10-2 mbarIntegrated Gas Supply Unit with 3 Mass Flow ControllersFast exchangeable sample carrier typesBeFlat for automatic compensation of external factorsc-DTA for endo- and exothermal effects and temperature calibrationAutoVacTM for automatic evacuation and refilling (option)Super-Res for rate-controlled mass change (option)Automatic sample changer (ASC) for 64 different crucibles (option)Coupling options to MS, GC-MS, FT-IR for Evolved Gas Analysis5
TG 209 F1 Libra – Automatic Sample Changerand AccessoriesThe automatic sample changer (ASC)is designed for routine quality controland assurance measurements. Thesingle carousel accommodates upto 64 samples, even if these are indifferent crucible types with differentgeometries. Crucibles can be changedsafely and reliably around the clock –even over the weekend. This provideshigher efficiency at lower costs.Each sample can be assigned adifferent measurement and evaluationprogram. The macro recorder featureseasy-to-understand input fields.Unplanned analyses can also beinserted into a pre-programmed seriesof tests already in progress.For unstable substances or sampleswith volatile or oxygen-sensitivecomponents, an automatic piercingdevice is available which perforatesthe sealed aluminum crucible justprior to the start of the measurement.Additional Informationwww.netzsch.com/tg209f1TG 209 F1 Libra with ASC6
Crucible Types for Various ndard TGA tests, not for salts and glassAl2O36.8 mm/4 mm85 µlStandard TGA tests, not for salts and glass, high sample inputAl2O38.0 mm/8 mm300 µlStandard TGA tests, not for salts and glass, higher sample inputAl2O39.0 mm/7 mm350 µlEspecially for c-DTA , not for metalsPt/Rh (80/20)6.8 mm/2.7 mmEspecially for c-DTA , high volume, not for metalsPt/Rh (80/20)6.8 mm/6 mmEspecially for c-DTA , up to max. 600 CAl (99.5%)6.7 mm/2.7 mm 1Volume85 µl190 µl85 µlFor special applications, there are also crucibles available in other materialsExchangeable Sample Carrier Types2ApplicationStandard TGAIdeal for c-DTA Material of the sample supportSensor typeFor crucible typesAl2O3Type P6.7 mm to 9 mm diameter, 85 µl to 350 µlType P (disk)6.7 mm to 9 mm diameter, 85 µl to 350 µlType P, protected6.7 mm to 9 mm diameter, 85 µl to 350 µlPdPt/Au/AuPd (Platinel )For corrosive media Al2O32 For ASC: max. diameter of the crucible is 8 mmSample carrier type P, standard sample carrierand radiation shield for corrosive media7
Proteus Software for TG 209 F1 Libra –User-Friendly and VersatileThe TG 209 F1 Libra runs underthe versatile Proteus software ona Windows operating system. TheProteus software includes everythingyou need to carry out a reliablemeasurement and evaluate the resultingdata – or even carry out complicatedanalyses. The Proteus software islicensed with the instrument and canalso be installed on other computersystems.General Software FeaturesMain TGA FeaturesFor Windows XP and Windows 7operation systemsMulti-tasking for simultaneousmeasurement and evaluationMulti-moduling for up to 4 differentinstrumentsMulti-method analysis for curvecomparison and evaluation of variousmethodsSnapshot for on-line evaluation ofthe running measurementPicture-in-picture presentation(PIP and FLIP)Graphic and data exportStorage and restoration of analysesContext-sensitive help systemMacro recorderMass change in % or mgAutomatic evaluation of mass changesteps and characteristic temperaturesExtrapolated onset and endsetPeak temperatures and values of the1st and 2nd derivativesMulti-point temperature calibrationvia c-DTA (calculated DTA signal)c-DTA for evaluation of endothermaland exothermal effectsAutomatic correction of buoyancyand drift for rapid TGA resultsKey Advanced Software Features8FeatureAdvantageBenefitc-DTA Calculated DTA for endothermal and exothermaleffectsBetter curve interpretation through a DSC-likesignalSuper-Res Rate-controlled mass changeBetter resolution and better separation ofsuperimposed mass change stepsPeak SeparationSeparation of DTG peaks which are in closeproximityBetter quantitative determination of superimposedmass change stepsThermokineticsAccurate process prediction such as lifetime anddecomposition behavior via multivariate nonlinear regressionProcess optimization through freely selectable time/temperature programs saves time and costs
User interface of the Proteus software duringevaluation:Presentation of the TGA curve (black) together withthe DTG curve (blue, dashed line), the c-DTA curve(red) and two gas flow curves (blue, dotted line andgreen, dashed line) in the main frame9
TG 209 F1 Libra – Smart Tools IntegratedThe Intelligent TGA – BeFlat for Automatic Correction of External InfluencesNo More Baseline Run – Faster toYour ResultsIn order to ensure correct mass changevalues, a baseline run is usually carriedout under identical test conditionssuch as heating rate, gas type, gasflow rate, crucible type and geometry,etc., and subtracted from the samplemeasurement. The baseline takesinstrument and buoyancy influences intoconsideration.In contrast, the TG 209 F1 Libra generally no longer requires a separatebaseline run. This greatly simplifiesroutine test work, especially for qualitycontrol in industry.The Libra takes the physics behind theexternal influences into considerationand corrects these effects automatically(depicted in the graphic above). Thesoftware stores the BeFlat data as wellas the raw data.The adjacent figure depicts the waterloss in a sample from 50 C to 250 C.The green curve represents data with aconventional correction by a separatebaseline run; the blue curve representsthe automatic BeFlat corrected dataand the results show a very goodcongruence.10with BeFlat classical baselineStable baseline (blue) due to automatic correction of external influencesWater loss in a sample
Calculated DTA for Endothermal and Exothermal EffectsMore Information throughCaloric EffectsIn addition to the TGA and DTGcurves, this plot depicts endothermaland exothermal effects determined bymeans of the calculated DTA signal,c-DTA . Kaolinite (sample mass:37.17 mg) was heated to 1100 C ina nitrogen atmosphere at 10 K/min.The two endothermal c-DTA peaks(198 C and 535 C) are directly relatedto the occurring mass loss steps and arecaused by dehydration and dehydroxylation: loss of adsorbed water from thesurface (0.3%) and loss of water frominter layers (10.6%). The exothermalc-DTA peak at 999 C represents theformation of mullite.0,40,20,0-0,2-0,4-0,6-0,8-1,0-1,2TGA measurement on Kaolinite; common presentation of the TGA curve (black),the DTG curve (blue, dashed line) and the c-DTA curve (red)Easy and Reliable TemperatureCalibrationThe multi-point temperature calibrationexecuted by means of c-DTA conformsto standardized methods, and cantherefore be easily validated. The onsettemperatures of the melting of highlypure reference metals are taken overa broad temperature range. This plotshows the melting of In, Sn, Zn, Al andAu as well as the solid-solid transition ofBaCO3 at a heating rate of 10 K/min.c-DTA effects of several materials suitable for temperature calibration11
TG 209 F1 Libra – Advanced SoftwareSuper-Res for Event-Based TGANormally, a defined constant heatingrate is applied to the sample in orderto study its decomposition behavior.Super-Res provides a rate-controlledheating rate according to definedPeak Separation for Better Accuracyof Mass Change StepsBy applying Peak Separation to DTGpeaks, the quantitative mass loss stepsduring material decomposition canbe separated much more clearly. Thefollowing plot shows the TGA resulton a rubber mixture (NR/SBR) for tires,measured under vacuum (approx.10-2 mbar). The symbols depict themeasured raw data, the colored linesrepresent the separated peaks and thesolid black line is the cumulative curveof the colored ones. The three separatedmass loss steps were 34.1%, 22.3%and 43.6%.thresholds with respect to the mass lossrate (DTG curve) set by the operator.This often results in much betterseparation of overlapping mass 550150250Temperature/ C350450Good agreement between the experimetal data (symbols) and the cumulative curve (black) of the calculatedpeaks (colored) as a result of applying Peak Separation12
Thermokinetics for the Optimization of any ProcessWith the unique NETZSCHThermokinetics software, anyprocess can be modeled. The kineticparameters such as activation energy,pre-exponential factor and order ofreaction can be ture/ C450550Comparison of the TGA raw data (symbols) and the curves (solid lines)calculated on the basis of a 4-step reaction modelMass/%Temperature/ C1003009025080200701506010050The TGA plot presents a biomass samplemeasured at 4 different heating rates –from 5 K/min to 40 K/min – in an inertgas atmosphere. The higher the heatingrate, the more the curves are shiftedto higher temperature values. This istypical behavior for effects caused bykinetic processes. There is an excellentcongruence between the TGA raw data(symbols) and the calculated curves(solid lines). The formal model usedconsists of four consecutive reactions.For the first one, a 3-dimensionaldiffusion type was selected; the otherthree are n-th order reactions.Based on this model, a prediction wascomputed: Starting at 30 C, heatingto 300 C at a heating rate of150 K/min, and then holding thetemperature constant at 300 C for1 hour yields the blue mass changecurve shown here. The calculationforecasts a residual mass of about45% after 62 minutes.500102030Time/min405060Prediction of the mass change for a temperature program including heating at150 K/min to 300 C, followed by an isothermal step (60 minutes)13
TG 209 F1 Libra for a Wide Variety of ApplicationsPolyamidePolyamide 66 is a thermoplastic polymerwhich is used for a wide variety oftechnical parts. The stiffness of the PA66can be increased by suitable fillers such asglass fibers. By means of TGA, not onlycan the decomposition of the polymer bedetermined, but the precise glass fibercontent as well. The TGA curve also showsthe content of pyrolytic soot and addedcarbon black.NR/SBR RubberThe TGA analysis on rubber is a standardanalytical method for the determinationof plasticizer content and rubbercomponents. The example shows anNR/SBR rubber mixture which exhibits aplasticizer content of 12.4%. The two-stepdecomposition of the rubber (NR and SBR)can be separated precisely. This compoundalso has a chalk content as inorganic filler.By switching to an oxidizing atmosphereat 850 C, the burning of the carbon blackcould be observed.SEBS PPThermoplastic elastomers are a class ofcopolymers or polymer mixtures with boththermoplastic and elastomeric properties.They can be used very easily in themanufacturing process, e.g., by injectionmolding. For investigating the plasticizercontent, the advantage of conducting theTGA analysis under vacuum conditionsis evident (blue curves). By reducing thevapor pressure of the plasticizer, two massloss steps were clearly separated.14
Magnesium StearateCommercially available magnesiumstearate, a widely used excipient forpharmaceutical formulations, is a mix ofseveral fatty acid salts that may vary inproportion. The magnesium stearate usedin the present study shows three mass-losssteps of 0.5%, 1.1% and 2.1% in thetemperature range up to 180 C. In thecorresponding TGA-FT-IR experiment (notshown here), it was possible to identify allvolatile components as water.CoalCoal pyrolysis is a complex processinvolving a large number of chemicalreactions. During heating, mainlyvolatiles (gases and tars) and solidcarbon (coke) are produced. 10 mgof coal was measured in a nitrogenatmosphere at a heating rate of100 K/min. The first mass loss (below210 C) can be most probably relatedto the release of moisture; while theother steps are mainly related toorganic volatiles.MicaThe TGA analysis on mica shows massloss steps at lower temperatures for thedehydration and the dehydroxylation ofthe material. In addition, a characteristicmass loss step can be observed at1093 C. It is the new ceramic furnaceof the TG 209 F1 Libra , which permitsmeasurements up to 1100 C, thatmakes this mass-loss step experimentallyaccessible.15
TG 209 F1 Libra with Evolved Gas Analysis (EGA)Different MethodsCoupling to GC-MSBy coupling TG 209 F1 Libra to agas analysis technique such as anFT-IR (Fourier Transform Infrared)spectrometer, MS (Mass Spectrometer),or GC-MS (Gas Chromatograph – MassSpectrometer), information regardingthe type of evolved gases as a functionof time or temperature can be obtained,which yields a fingerprint of theanalyzed material.GC (Gas Chromatography) is ahigh-resolution method for separatingvolatile and semi-volatile compounds.The gas mixtures are separated basedon the differences in componentdistribution between a stationary phase(e.g., inner coating of a capillary) and amobile phase (purge gas). This leads todifferent time delays or retention timesof the gas components.MS (Mass Spectrometry) is applied as ahighly sensitive detection system at theoutlet of the GC separation column andwill register the time distribution of theseparated gas components in the purgegas flow.GC-MS provides detailed structuralinformation on most compounds foran accurate identification of the gascomponents.Event-controlled TG-GC-MS measurement on NR/SBR versus continuous heatingEvaluation of GC-MS-TIC chromatogramsAdditional Informationwww.netzsch.com/gcms16
bypasstransfer lineadapterJAS valve boxsample loopJAS UNIS 500injector systemTGA sample gasoutlet (pump)valveon offmicro furnacesampleGC carriergas inlet(He 5 bar)sample carrierTGA cellAdapter and transfer lineRT to 300 CMSD1.6 u to 1050 uGC35 C to 425 CTG 209 F1 Libra 10 C to 1100 C, 0.1 µgDetailed diagram of the functional elements of the TGA-GC-MS coupling17
TG 209 F1 Libra with Evolved Gas Analysis (EGA)18Coupling to MSCoupling to FT-IRHigh-level material research andcharacterization can be achieved bycoupling the TG 209 F1 Libra to ourQMS 403 Aëolos quadrupole massspectrometer. Any gases evolved areintroduced directly into the electronimpact ion source of the MS through aquartz glass capillary heated to 300 C.“More than just the sum of its parts”is the motto for our comprehensivecoupling system incorporating anFT-IR (Fourier Transform Infrared)spectrometer manufactured byour cooperation partner, BrukerOptics. The purge gas flow from theTGA carries the volatiles througha short heated transfer line to thevacuum-tight gas cell of the FT-IR. Allevolved gases with a changing dipolemoment are identified by their typicalabsorption spectrum, and complexgas mixtures can be spectroscopicallyseparated.
Simultaneous TGA-MS-FT-IRCoupling and PulseTA The unique heated coupling adapterallows simultaneous TGA-MS-FT-IRmeasurements, even when theautomatic sample changer (ASC) isrunning. Only one operational softwarepackage on a single PC is neededfor TGA-MS-FT-IR. Comprehensiveevaluations can be displayed in one plot.Calibration and quantification ofthe evolved gas components can beachieved by the sophisticated PulseTA technique.Take advantage of nearly 40 years ofcoupling experience and ask for ourspecial coupling brochures.Comprehensive evaluation of TGA, DTG, FT-IR (Gram-Schmidt), and QMS (u) versus temperatureAdditional InformationCoupling of TENSOR 27, external gas cell, TG 209 F1 Libra and QMS 403 C Aëolos www.netzsch.com/ftir19
The NETZSCH Group is an owner-managed, internationally operating technologycompany headquartered in Germany.The three Business Units – Analyzing & Testing, Grinding & Dispersing and Pumps &Systems – provide tailored solutions for highest-level needs. Over 2,500 employeesat 130 sales and production centers in 23 countries across the globe guarantee thatexpert service is never far from our customers.NETZSCH-Gerätebau GmbHWittelsbacherstraße 4295100 SelbGermanyTel.: 49 9287 881-0Fax: 49 9287 881 505at@netzsch.comwww.netzsch.comNGB · TG 209 F1 Libra · EN · 600 · 08/12 · LH · Technical specifications are subject to change.When it comes to Thermal Analysis, Adiabatic Reaction Calorimetry and thedetermination of Thermophysical Properties, NETZSCH has it covered. Our 50 yearsof applications experience, broad state-of-the-art product line and comprehensiveservice offerings ensure that our solutions will not only meet your every requirementbut also exceed your every expectation.
Thermo-Microbalance TG 209 F1 Libra Thermogravimetry (TG) or Thermogravimetric Analysis (TGA) is a well proven Thermal Analysis method. TGA is used in the research & development of various substances and engineering materials - solid or liquid - in order to obtain knowledge about their thermal stability and composition.
