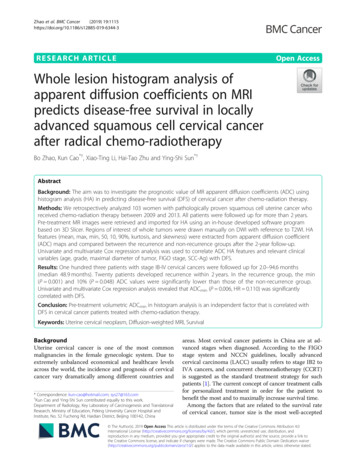
Transcription
Electronic Supplementary Material (ESI) for Journal of Materials Chemistry B.This journal is The Royal Society of Chemistry 2018Supplementary InformationMultifunctional near-infrared laser-triggered drug delivery system using folicacid conjugated chitosan oligosaccharide encapsulated gold nanorods fortargeted chemo-photothermal therapyPanchanathan Manivasagan,a1 Seung Won Jun,b1 Van Tu Nguyen,c Phong Truong Nguyen Thanh,cGiang Hoang,a Sudip Mondal,a Madhappan Santha Moorthy,a Hyehyun Kim,a Thi Tuong VyPhan,c Vu Hoang Minh Doan,c Chang-Seok Kim,*b Junghwan Oh *acaMarine-Integrated Bionics Research Center, Pukyong National University, Busan 48513,Republic of Korea.bDepartment of Cogno-Mechatronics Engineering, Pusan National University, Busan 46241,Republic of Korea.c Departmentof Biomedical Engineering and Center for Marine-Integrated Biotechnology (BK21Plus), Pukyong National University, Busan 48513, Republic of Korea.1 Theseauthors contributed equally to this work* Corresponding author: Prof. Junghwan Oh *ac and Prof. Chang-Seok Kim *baMarine-Integrated Bionics Research Center, Pukyong National University, Busan 48513,Republic of Korea.c Departmentof Biomedical Engineering and Center for Marine-Integrated Biotechnology (BK21Plus), Pukyong National University, Busan 48513, Republic of Korea.Email: jungoh@pknu.ac.kr; Tel: 82-51-629-5771, Fax: 82-51-629-5779.S1
bDepartment of Cogno-Mechatronics Engineering, Pusan National University, Busan 46241,Republic of Korea. Email: ckim@pusan.ac.kr; Tel: 82-51-510-1365.ExperimentalMaterials and methodsMaterialsAll reagents and materials were obtained from Sigma-Aldrich and were used as received withoutfurther purification.Preparation of FA-COS-TGA-GNRs-DOXFolic acid-chitosan oligosaccharide (FA-COS) was prepared according to earlier works 1, 2. 0.11 gof FA (0.25 mM) was completely dissolved in 10 mL dehydrated dimethyl sulfoxide (DMSO),and the carboxyl groups of the FA solution were activated by 0.2 g of 1-ethyl-3-(3-dimethylaminopropyl) carbodiimide (EDC; 0.5 mM) and 0.05 g of N-hydroxysuccinimide (NHS; 0.3 mM)at ambient temperature in the dark for 40 min. The free amino groups of COS (0.4 g, 0.1 mM; Mn 5000 Da, 90% deacetylated degree) were conjugated with the carboxyl groups of FA in thepresence of EDC/NHS as a catalyst, and COS was added to the FA solution at ambient temperaturein the dark for 24 h. The reaction solution was filtered, washed with distilled water three times andethanol alternatively to remove unbound molecules, and freeze-dried. FA-COS was furtherencapsulated with thioglycolic acid (TGA) via a coupling reaction with the carboxyl groups ofTGA in the presence of EDC/NHS. 3.251 g of FA-COS, 1.542 g of EDC, and 0.683 g of NHSwere dissolved in 50 mL of deionized water. 0.573 g of 2 mM TGA was added into the FA-COSsolution, and the solution was stirred for 24 h. The resultants were dialyzed against deionized waterusing a dialysis membrane (MWCO: 3500 Da) for 5 days and freeze dried. The structure of FAS2
COS and FA-COS-TGA were characterized by 1H NMR. The 1H NMR spectra were obtained inD2O using a JNM ECP-400 (400 MHz, JEOL, Japan) spectrometer.Gold nanorods (GNRs) were also synthesized according to earlier works3-6.For theencapsulation process of GNRs, 5 g of FA-COS-TGA was added in 10 mL of purified GNRsthrough gold–thiol interaction and allowed to react at ambient temperature for 24 h 7. Theencapsulated GNRs (FA-COS-TGA-GNRs) were purified by certification and washed more thanthree times with deionized water. For the hydrolysis of COS, 5 mL of FA-COS-TGA-GNRs and0.1 M sodium hydroxide (NaOH) were added to hydrolyze the pyromellitic dianhydride (PMDA)under basic medium 8. The solution was stirred at 50 C for 30 min, and the reaction solution (FACOS-TGA-GNRs-PMDA) was purified by centrifugation and subsequent re-dispersion into thedeionized water. The DOX molecules were loaded onto FA-COS-TGA-GNRs-PMDA via thepossible physical interactions specifically, H-bonding/electrostatic interaction between thecarboxyl acid group of PMDA and the amine groups of DOX molecules 9. Briefly, 0.3 mL of DOXsolution at a concentration of 1 mg mL-1 (pH 7.4) was added into 10 mL of FA-COS-TGA-GNRsPMDA (1 mg mL-1) dispersion and stirred for 24 h to allow the DOX-loading process to reachequilibrium. Then, the FA-COS-TGA-GNRs-PMDA-DOX solution was dialyzed againstdeionized water (pH. 7.4) to remove unreacted DOX. The obtained purified folic acid conjugatedand doxorubicin-loaded chitosan oligosaccharide encapsulated gold nanorods (FA-COS-TGAGNRs-DOX) were dispersed in phosphate-buffered saline (PBS) for further characterization andbiomedical applications. The substitution degree of amino groups was measured using the 2,4,6trinitrobenzene sulfonic acid (TNBS) technique.S3
In vitro drug release testThe dispersion was centrifuged at 15,000 rpm for 10 min to collect FA-COS-TGA-GNRs-DOX,and the supernatant was used to determine the drug loading content. The DOX concentration inthe supernatant was determined by measuring the absorbance of the drug at 480 nm using a UV–vis spectrophotometer. The drug loading content and entrapment efficiency were calculated usingthe following equations:𝐷𝑟𝑢𝑔 𝑙𝑜𝑎𝑑𝑖𝑛𝑔 𝑐𝑜𝑛𝑡𝑒𝑛𝑡 𝑊𝑒𝑖𝑔ℎ𝑡 𝑜𝑓 𝑑𝑟𝑢𝑔 𝑖𝑛 �� (𝑁𝑃𝑠) 100𝑊𝑒𝑖𝑔ℎ𝑡 𝑜𝑓 𝑁𝑃𝑠𝐷𝑟𝑢𝑔 𝑒𝑛𝑡𝑟𝑎𝑝𝑚𝑒𝑛𝑡 𝑒𝑓𝑓𝑖𝑐𝑖𝑒𝑛𝑐𝑦 𝑊𝑒𝑖𝑔ℎ𝑡 𝑜𝑓 𝑑𝑟𝑢𝑔 𝑖𝑛 𝑁𝑃𝑠 100𝑊𝑒𝑖𝑔ℎ𝑡 𝑜𝑓 𝑑𝑟𝑢𝑔 𝑓𝑒𝑑 𝑖𝑛𝑖𝑡𝑖𝑎𝑙𝑙𝑦In vitro NIR laser-triggered release of DOX from FA-COS-TGA-GNRs-DOXIn vitro NIR laser-triggered drug release studies were performed in various pH buffers (5.0 and7.4) at room temperature with the same mass concentration. Briefly, 5 mg of FA-COS-TGAGNRs-DOX was redispersed in PBS and was exposed to an 808 nm laser (1.0 W cm-2) for 300 s.The drug release efficiency was quantified using a UV–vis spectrophotometer at 480 nm at varioustime intervals and was calculated using the following equation:𝐶𝑢𝑚𝑢𝑙𝑎𝑡𝑖𝑣𝑒 𝑑𝑟𝑢𝑔 𝑟𝑒𝑙𝑒𝑎𝑠𝑒 𝑊𝑒𝑖𝑔ℎ𝑡 𝑜𝑓 𝑑𝑟𝑢𝑔 𝑖𝑛 𝑡ℎ𝑒 𝑠𝑢𝑝𝑒𝑟𝑛𝑎𝑡𝑎𝑛𝑡 𝑏𝑦 𝑡ℎ𝑒 𝑓𝑜𝑙𝑙𝑜𝑤𝑖𝑛𝑔 𝑒𝑞𝑢𝑎𝑡𝑖𝑜𝑛 100𝐸𝑛𝑡𝑟𝑎𝑝𝑚𝑒𝑛𝑡 𝑜𝑓 𝑒𝑓𝑓𝑖𝑐𝑖𝑒𝑛𝑐𝑦 𝑜𝑓 𝐹𝐴 ‒ 𝐶𝑂𝑆 ‒ 𝑇𝐺𝐴 ‒ 𝐺𝑁𝑅𝑠 ‒ 𝐷𝑂𝑋InstrumentationSample morphology and structure were observed using a JEM-1010 (JEOL, Japan) high-resolutiontransmission electron microscopy (HRTEM) and selected area electron diffraction (SAED)pattern. TEM was also used for energy dispersive X-ray spectroscopy (EDX). Ultraviolet–visible–near infrared (UV–vis–NIR) spectra were evaluated in the wavelength range of 400–1000 nmusing a Genesys 30S UV–vis spectrophotometer (Thermo Scientific, USA). Dynamic lightscattering (DLS) and zeta potential (ZP) measurement were performed using an ELS-8000S4
electrophoretic light scattering spectrophotometer (Otsuka, Electronics Co. Ltd., Japan). TheFourier-transform infrared (FTIR) spectra were measured on a Perkin-Elmer Spectrum 100 FTIRspectrometer (Waltham, MA, USA). The X-ray diffraction (XRD) pattern was measured using anX-ray diffractometer (X’Pert-MPD PW 3050) equipped with Cu Kα radiation. Inductively coupledplasma mass spectrometry (ICP-MS) was performed using NexION 300D (PerkinElmer, USA).The photothermal experiments were conducted using a NIR laser (808 nm, Changchun NewIndustries Optoelectronics Technology, China). Bright field and fluorescent images of MDA-MB231 cells were obtained using an inverted fluorescence microscope (Leica DMI300B, Wetzlar,Germany). The MDA-MB-231 cells were imaged using a confocal laser scanning microscope(CLSM, Zeiss LSM 700, Oberkochen, Germany). The two-photon luminescence spectra werecaptured using a two-photon fluorescence microscope (TPFM) following the system described byJun et al. 10. The thermographs were recorded using a Flir i5 compact infrared (IR) thermal imagingcamera (Flir Systems Inc., Portland, USA).In vivo fluorescent imaging experiments were performed using a customized reflectionmode fluorescent imaging system (OBLABS, Korea). It consisted of a charge-coupled device(CCD) camera (GS3-U3-28S5M-C; Point Grey Research, USA), a camera lens (AC254-040-A;THORLABS, USA), an emission filter (FF01-520/5-25; SEMROCK, USA), an excitation filter(FF01-494/20-25; SEMROCK, USA), a dichroic mirror (FITC-LP01-Clin-25; SEMROCK, USA),a 490-nm light-emitting diode (LED) (M490L4; THORLABS), and a collimated lens (ACL2520U;THORLABS, USA). All fluorescent images were captured using FlyCapture software (Point GreyResearch, USA). Image J software was used to process and analyze the fluorescent images.S5
Stability of FA-COS-TGA-GNRs-DOXThe stability test of FA-COS-TGA-GNRs-DOX was performed in Dulbecco’s Modified Eagle’smedium (DMEM) supplemented with 10% fetal bovine serum (FBS) under physiologicalconditions at pH 7.4 and acidic conditions at pH 5.0 and stirred at ambient temperature for 14 days.The samples were characterized by HRTEM. The stability of FA-COS-TGA-GNRs-DOX at roomtemperature was observed using a UV–vis spectrophotometer for 14 days in various biologicalconditions such as PBS, deionized water (DW), and DMEM (without phenol red) with 10% FBS.The stability of FA-COS-TGA-GNRs-DOX in various biological conditions before and after 14days were further characterized by DLS and ZP.In vitro photothermal conversion efficiency1.0 mL of FA-COS-TGA-GNRs-DOX aqueous solutions with various concentrations (40, 50, and60 µg mL-1) was introduced in a single well of a 12-well plate and exposed to the 808 nm laserfrom the top at various power settings of 0.4 W cm-2, 0.6 W cm-2, 0.8 W cm-2, and 1.0 W cm-2 for300 s. The temperature of the aqueous suspensions was measured using a digital thermometer withthe thermocouple immersed into the aqueous solutions11.An IR thermal imaging camera wasplaced on top of the aqueous solutions, and thermographs were monitored using the IR camera.The thermographs were examined using FLIR software. To determine photothermal stability, 1.0mL of FA-COS-TGA-GNRs-DOX (60 µg mL-1) was exposed to the 808 nm laser at 1.0 W cm-2for 300 s. The procedures of turning on the laser for 300 s and turning off the laser for 900 s wererepeated five times. The UV–vis–NIR spectra of FA-COS-TGA-GNRs-DOX were observed afterexposure to repeated five cycles of laser irradiation and FA-COS-TGA-GNRs-DOX was alsocharacterized by HRTEM, DLS, and zeta potential after irradiation. The photothermal conversionefficiency of FA-COS-TGA-GNRs-DOX was determined according to previous literatures12, 13.S6
The FA-COS-TGA-GNRs-DOX (60 µg mL-1) aqueous solutions were exposed to the 808 nm laserat 1.0 W cm-2 for 300 s, then the laser was turned off, and the temperature decrease of the FA-COSTGA-GNRs-DOX solution was monitored to measure the rate of heat transfer from the FA-COSTGA-GNRs-DOX aqueous solution system to the environment. The photothermal conversionefficiency (η value) was calculated using the following equation:𝜂 ℎ𝑆(𝑇𝑀𝑎𝑥 ‒ 𝑇𝑆𝑢𝑟) ‒ 𝑄𝑑𝑖𝑠𝐼(1 ‒ 10‒ 𝐴808)Cell cultureMDA-MB-231 cells and MCF-7 cells (human breast cancer cell line) were purchased from ATCC.Cells were plated and cultured in DMEM (Hyclone) supplemented with 10% FBS (Hyclone) and1% penicillin-streptomycin (Hyclone) at 37 C under 5% CO2 conditions.In vitro biocompatibility testIn vitro biocompatibility evaluation of FA-COS-TGA-GNRs was performed using MDA-MB-231cells and MCF-7 cells. The cells (50,000 cells per well) were cultured in 96 multiwell plates for24 h and 48 h. Afterward, cells were treated with various concentrations of FA-COS-TGA-GNRs(5, 15, 25, 75, 100, 150, and 200 µg mL-1) for 24 h and 48 h. Then, m bromide (MTT) solution was added into all of the wells and theabsorbance of each well at 570 nm was measured using a microplate reader (TECAN InfiniteF50).In vitro hemocompatibility testTo assess in vitro hemocompatibility, mice blood was successfully collected by cardiac puncture,and blood samples were stabilized using ethylenediaminetetraacetic acid (EDTA). 1 mL of bloodsample was added into 2 mL PBS, and the red blood cells (RBCs) were collected by centrifugationS7
at 1500 rpm for 15 min and were diluted into 10 mL pre-chilled PBS. 0.2 mL of RBC wasincubated with 0.8 mL FA-COS-TGA-GNRs dispersions at various concentrations (10, 25, 50,100, 150, and 200 µg mL-1) and was also treated with PBS (negative control) and deionized water(positive control). All samples were treated at 37 C for 4 h and centrifuged at 15000 rpm for 3min. The absorbance of each sample at 541 nm was observed using a UV–vis spectrophotometer.The hemolytic percentage was calculated using the following equation: 14𝐻𝑒𝑚𝑜𝑙𝑦𝑠𝑖𝑠 𝑝𝑒𝑟𝑐𝑒𝑛𝑡 (%) 𝐴𝑠𝑎𝑚𝑝𝑙𝑒 ‒ ��𝑖𝑡𝑖𝑣𝑒 ‒ 𝐴𝑛𝑒𝑔𝑎𝑡𝑖𝑣𝑒 100%In vitro cytotoxicityThe cell viability of MDA-MB-231 cells was assessed using an MTT assay. MDA-MB-231 cells(50,000 cells per well) were cultured in 96 multiwell plates for 24 h. Afterward, cells wereincubated with various concentrations of FA-COS-TGA-GNRs-DOX (5, 10, 25, 50, 75, 100, and200 µg mL-1) for 24 h and 48 h. Then, the MTT solution was added into each well, and the opticaldensities of all of the wells were measured at 570 nm using a microplate reader.Cellular uptakeMDA-MB-231 (1 105 cells per well) cells were plated in 12 multiwell plates and incubated at 37 C for 24 h. The cells were incubated with 0.5 mg mL-1 free FA to occupy the FA receptor of thecells and were incubated with COS-TGA-GNRs-DOX and FA-COS-TGA-GNRs-DOX (5 µg mL1of DOX) for an additional 3 h. After that, the cells were washed three times with PBS, and then,the cells were trypsinized and suspended in PBS. The intensity of DOX fluorescence was evaluatedusing a flow cytometer (BD FACSVerse, NJ, USA).To quantify the amount of FA-COS-TGA-GNRs-DOX uptake in MDA-MB-231 cells,cells (1 105 cells per well) were cultured in six multiwell plates and incubated for 24 h. The cellswere treated with 60 µg mL-1 COS-TGA-GNRs-DOX or FA-COS-TGA-GNRs-DOX andS8
collected at 1, 2, 4, 6, 8, 12, 18, and 24 h by centrifugation. At each time point, the cells werewashed three times in PBS for three times, counted using a hemocytometer, and digested with aquaregia. The gold (Au) concentrations were quantified by ICP-MS and Au content was expressed inpicogram of Au per cell.15In vitro photothermal therapyMDA-MB-231 (50,000 cells per well) cells were cultured in 96 multiwell plates for 24 h prior toassay. Then the cells were incubated with different concentrations of free DOX, FA-COS-TGAGNRs, and FA-COS-TGA-GNRs-DOX (10, 20, 30, 40, 50 and 60 µg mL-1) for 6 h. The cells wereor were not exposed to the 808 nm laser (1.0 W cm-2) for 300 s. The cells were treated at 37 C foranother 3 h, and then, cell viability was assessed using the MTT assay. In addition, cells weretreated with 60 µg mL-1 FA-COS-TGA-GNRs-DOX for 6 h, and then, the cells were or were notexposed to the 808 nm laser at various power settings of 0.4 W cm-2, 0.6 W cm-2, 0.8 W cm-2, and1.0 W cm-2 for 300 s. After incubation for an additional 3 h, cell viability was assessed using theMTT assay.In vitro cell imagingMDA-MB-231 (1 105 cells per well) cells were cultured in six multiwell plates at 37 C for 24h. Afterward, the cells were divided into six groups: group 1, with cells only; group 2, with laserirradiation (1.0 W cm-2) only; group 3, incubation with free DOX (60 µg mL-1); group 4, incubationwith FA-COS-TGA-GNRs (60 µg mL-1) only; group 5, incubation with FA-COS-TGA-GNRsDOX (60 µg mL-1) only; and group 6, incubation with FA-COS-TGA-GNRs-DOX (60 µg mL-1)with laser irradiation at 1.0 W cm-2 for 300 s. After treatment, all groups of cells were incubatedfor another 3 h, and all of the cells were stained with calcein-AM and propidium iodide (PI) forvisualization of live (green) and dead (red) cells, respectively. Then, the cells were washed twiceS9
with PBS, and the images of the five samples were examined under an inverted fluorescencemicroscope.MDA-MB-231 (1 105 cells per well) cells were cultured onto glass coverslips in sixmultiwell plates and incubated at 37 C for 24 h. The cells were incubated with 60 µg mL-1 FACOS-TGA-GNRs-DOX for an additional 6 h. Afterward, the cells were exposed to the 808 nmlaser (1.0 W cm-2) for 300 s. Then, the cells were incubated at 37 C for 1, 2, and 3 h and the cellnuclei were stained with Hoechst 33342 for 30 min. The cells were washed three times with PBSand were captured under a CLSM.In vitro two-photon fluorescence imagingMDA-MB-231 (1 105 cells per well) cells were incubated onto glass coverslips in six multiwellplates at 37 C for 24 h. All groups of cells were further incubated with saline, free DOX, FACOS-TGA-GNRs, and FA-COS-TGA-GNRs-DOX for 6 h, and the cells were or were not exposedto the 808 nm laser at 1.0 W cm-2 for 300 s. All groups of cells were cultured at 37 C for 3 h, andthe cell nuclei were stained with Hoechst 33342 for 30 min. Finally, all of the cells were washedthree times with PBS and were captured using a two-photon fluorescent microscope (TPFM).Apoptosis assayThe MDA-MB-231 cells (3 105 cells per well) were cultured in 12 multiwell plates at 37 C for24 h. The cells were incubated with saline, free DOX, FA-COS-TGA-GNRs, and FA-COS-TGAGNRs-DOX for 6 h. Then, all of the cells were or were not exposed to the 808 nm laser at 1.0 Wcm-2 for 300 s, and the cells were incubated at 37 C for another 3 h. Finally, all groups of cellswere harvested, washed three times in PBS, and stained with an Annexin V-FITC/PI apoptosisdetection kit, and then, all groups of cells were analyzed using flow cytometry (BD FACSVerse,BD Biosciences, NJ, USA).S10
In vitro fluorescence cellular imagingThe conjugation of fluorescein isothiocyanate (FITC) with the free amino groups of COS wasprepared according to earlier work16, 17.The MDA-MB-231 (2 105 cells per well) cells werecultured in 24 multiwell plates at 37 C for 24 h. The cells were incubated with FITC-labelled FACOS-TGA-GNRs-DOX (60 µg mL-1) for 6 h and then were exposed to the 808 nm laser (1.0 Wcm-2) for 300 s and incubated for another 3 h. After washing, the fluorescence images of cells atdifferent time periods (2, 4, 6, and 8 h) were captured using a customized reflection modefluorescent imaging system.In vitro photoacoustic imagingThe photoacoustic tomography (PAT, OBLABS, Korea) system was described in our previouswork 18, 19. A polyvinyl alcohol (PVA) phantom that closely mimics human tissues was developedaccording to the previous work19.MDA-MB-231 (1 105 cells per well) cells were incubatedwith different concentrations of FA-COS-TGA-GNRs-DOX (40, 50 and 60 µg mL-1) at 37 C for6 h. After incubation, the cells were harvested, and the PAI of the cell pellets were mixed with10% gelatin and were added into all of the wells in the tissue-mimicking PVA phantom.Statistical analysisQuantified data were presented as the mean SD. Statistical significance was assessed using thet-test. Statistical significance was set at *P 0.05 and **P 0.01. Origin 8.0 software was usedto analyze the data.S11
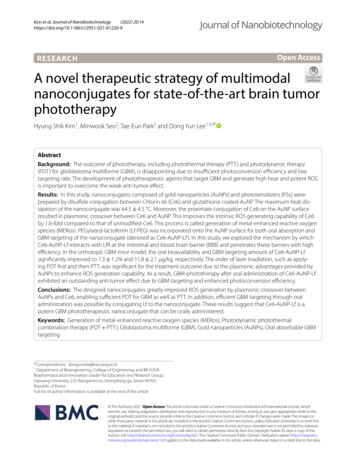
Fig. S1. Synthetic route of FA-COS-TGA-GNRs-DOX.S12
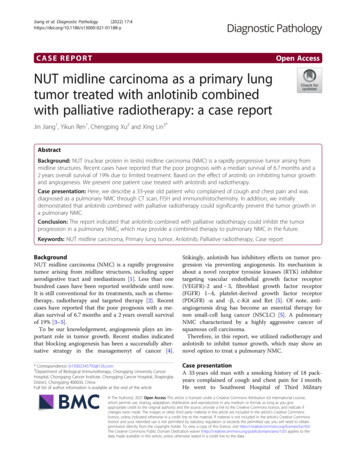
Fig. S2. Schematic of the preparation of FA-COS-TGA-GNRs-DOX.S13
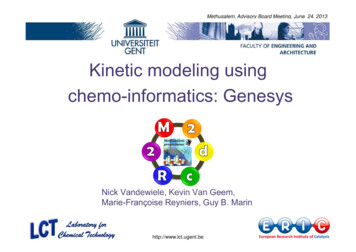
Fig. S3. 1H NMR spectra of FA-COS at 25 C.S14
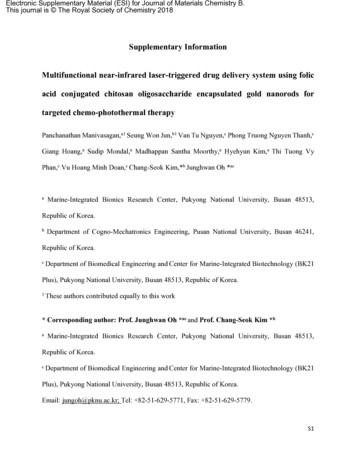
Fig. S4. 1H NMR spectra of FA-COS-TGA at 25 C.S15
Fig. S5. Fluorescence spectra of free DOX and FA-COS-TGA-GNRs-DOX with the sameconcentration of DOX. Significant fluorescence quenching was observed for FA-COS-TGAGNRs-DOX.S16
Fig. S6. HRTEM images of GNRs.S17
Fig. S7. HRTEM images of FA-COS-TGA-GNRs.S18
Fig. S8. Selected area electron diffraction (SAED) pattern of FA-COS-TGA-GNRs-DOXS19
Fig. S9. Energy dispersive X-ray spectroscopy (EDX) of FA-COS-TGA-GNRs-DOXS20
Fig. S10. FTIR spectra of FA, COS, FA-COS, FA-COS-TGA, GNRs, FA-COS-TGA-GNRs, freeDOX, and FA-COS-TGA-GNRs-DOX.S21
Fig. S11. HRTEM images of FA-COS-TGA-GNRs-DOX in DMEM with 10% FBS under bothneutral at pH 7.4 and acidic conditions at pH 5.0.S22
Fig. S12. UV–vis spectra of FA-COS-TGA-GNRs-DOX in various biological conditions beforeand after 14 days.S23
Fig. S13. Schematic diagram of DOX release from FA-COS-TGA-GNRs-DOX with laserirradiation.S24
Fig. S14. UV–vis spectra of FA-COS-TGA-GNRs-DOX in various concentrations and insetimage showed the FA-COS-TGA-GNRs-DOX aqueous solutions in various concentrations.S25
Fig. S15. Temperature elevation of FA-COS-TGA-GNRs-DOX aqueous solution at variousconcentrations under 808 nm laser irradiation at various power settings of 0.4 W cm-2 (a), 0.6 Wcm-2 (b), 0.8 W cm-2 (c), and 1.0 W cm-2 (d) for 300 s.S26
Fig. S16. Temperature elevation of FA-COS-TGA-GNRs-DOX aqueous solution at concentrationof 60 µg mL-1 under 808 nm laser irradiation at various power settings of 0.4 W cm-2, 0.6 W cm2,0.8 W cm-2, and 1.0 W cm-2 for 300 s.S27
Fig. S17. IR thermal image of the FA-COS-TGA-GNRs-DOX (60 µg mL-1) aqueous solution in asingle well of a 12-well plate under 808 nm laser irradiation at 1.0 W cm-2 for different times.S28
Fig. S18. HRTEM images of FA-COS-TGA-GNRs-DOX after five cycles of the laser on/off.S29
Fig. S19. Cell viabilities of MDA-MB-231 cells (a) and MCF-7 cells (b) treated with FA-COSTGA-GNRs with various concentrations for 24 and 48 h. Data are represented as mean standardderivation (SD) for the three experiments.S30
Fig. 31Fig. S20. Quantitative uptake of analysis by flow cytometry of COS-TGA-GNRs-DOX, FA-COSTGA-GNRs-DOX pretreated with FA, and FA-COS-TGA-GNRs-DOX on MDA-MB-231 cells.S31
Fig. S21. CLSM image of MDA-MB-231 cells treated with or without FA-COS-TGA-GNRsDOX (60 µg mL-1) for 6 h, the cells were exposed to 808 nm laser irradiation at 1.0 W cm-2 for300 s and incubated for another 1 h, 2 h, and 3 h, respectively. Hoechst 33342 for nuclei staining(blue) and released DOX fluorescence (red) were observed. Scale bar: 20 µm.S32
Fig. S22. Flow cytometric analysis of MDA-MB-231 cells death induced by various groups.S33
Fig. S23. Quantified analysis of apoptosis/necrosis cells percentage according to double stainingby Annexin V and PI. Data are represented as mean standard derivation (SD) for the threeexperiments (* significant p 0.05).S34
Fig. S24. (a) In vitro fluorescence cellular images of MDA-MB-231 cells treated with FITClabelled FA-COS-TGA-GNRs-DOX (60 µg mL-1) at various time points. (b) The fluorescenceintensity of MDA-MB-231 cells treated with FITC-labelled FA-COS-TGA-GNRs-DOX (60 µgmL-1) at various time points.S35
Fig. S25. In vitro photoacoustic image of MDA-MB-231 cells treated with various concentrationof FA-COS-TGA-GNRs-DOX.S36
Fig. S26. Photoacoustic signals monitored in the cells with various concentrations of FA-COSTGA-GNRs-DOX.S37
Fig. S27. In vivo photoacoustic images of tumor of nude mice before injection and 3 h and 6 hintravenous post-injections of FA-COS-TGA-GNRs-DOX. The white circle indicates the tumorarea.S38
Fig. S28. The average PA signal of FA-COS-TGA-GNRs-DOX in the tumor at various timeintervals.S39
Fig. S29. (a) Representative digital photographs of MDA-MB-231 tumor-bearing mice in eachgroup before (0 day) and after 18 days of treatments. (b) Representative digital photographs oftumors in various groups after 18 days of treatment. Data are represented as mean standardderivation (SD) for the five experiments.S40
Fig. S30. The digital photographs of MDA-MB-231 tumor-bearing mice taken before treatment (0day) and after treatment (7, 14, and 18 days) of FA-COS-TGA-GNRs-DOX under laser irradiation(1.0 W cm-2) for 300 s.S41
Fig. S31. The average weight of tumors collected from each group of MDA-MB-231 tumorbearing mice after treatment. Data are represented as mean standard derivation (SD) for the fiveexperiments (** significant p 0.01).S42
Fig. S32. Hematoxylin/eosin (H&E) staining of tumor tissues from various groups (20 magnification). Scale bar: 100 µm.S43
Fig. S33. TUNEL staining assay of tumors tissues after treatments. The apoptotic cells labelledgreen fluorescence were evidently identified by TUNEL assay (20 magnification). Scale bar:100 µm.S44
Fig. S34. The apoptotic index was observed in the PTT groups using the TUNEL assay.S45
Fig. S35. H&E staining of the five main organs from various groups.S46
Fig. S36. The biodistribution of FA-COS-TGA-GNRs-DOX in mice on the 1st day and 18th day oftreatment.S47
Table S1. Hematology analysis and blood biochemical assay(109/L)WBCRBC (1012/L)MCV (fl)HGB (g/L)PLT (109/L)AST (U/L)ALT (U/L)BUN (µmol/L)CRE (mmol/L)Saline5.2 0.629.6 0.4149.6 0.78138 4.811087 56141.3 6.248 4.710 0.46.4 0.8FA-COS-TGA-GNRs-DOX4.7 0.689.1 1.3648.5 1.7140 5.331052 73139.4 4.750 2.810.1 0.87.0 0.5S48
References1.Q. Yang, C. He, Y. Xu, B. Liu, Z. Shao, Z. Zhu, Y. Hou, B. Gong and Y.-M. Shen, Poly.Chem., 2015, 6, 1454-1464.2.T. S. C. Li, T. Yawata and K. Honke, Eur. J. Pharm. Sci., 2014, 52, 48-61.3.B. Nikoobakht and M. A. El-Sayed, Chem. Mater., 2003, 15, 1957-1962.4.T. K. Sau and C. J. Murphy, Langmuir, 2004, 20, 6414-6420.5.L. Liu, Z. Guo, L. Xu, R. Xu and X. Lu, Nanoscale Res. Lett., 2011, 6, 143.6.X. Ye, C. Zheng, J. Chen, Y. Gao and C. B. Murray, Nano Lett., 2013, 13, 765-771.7.L. Fontana, M. Bassetti, C. Battocchio, I. Venditti and I. Fratoddi, Colloids Surfaces A:Physicochem. Eng. Aspects., 2017, 532, 282-289.8.E. Peng, J. Ding and J. M. Xue, J. Mater. Chem., 2012, 22, 13832-13840.9.A. Di Martino, P. Kucharczyk, Z. Capáková, P. Humpolicek and V. Sedlarik, Int. J. Biol.Macromol., 2017, 102, 613-624.10.S. W. Jun, J. Kwon, S. K. Chun, H. A. Lee, J. Lee, D. Y. Hwang, C.-Y. Dong and C.-S.Kim, Biomed. Opt. Express, 2018, 9, 705-716.11.J. Zhang, C. Yang, R. Zhang, R. Chen, Z. Zhang, W. Zhang, S. H. Peng, X. Chen, G. Liuand C. S. Hsu, Adv. Funct. Mater., 2017, 27, 1-23.12.D. K. Roper, W. Ahn and M. Hoepfner, J. Phys. Chem. C, 2007, 111, 3636-3641.13.X. Liu, B. Li, F. Fu, K. Xu, R. Zou, Q. Wang, B. Zhang, Z. Chen and J. Hu, Dalton Trans.,2014, 43, 11709-11715.14.W. Yin, L. Yan, J. Yu, G. Tian, L. Zhou, X. Zheng, X. Zhang, Y. Yong, J. Li and Z. Gu,ACS Nano, 2014, 8, 6922-6933.S49
15.R. Coradeghini, S. Gioria, C. P. García, P. Nativo, F. Franchini, D. Gilliland, J. Ponti andF. Rossi, Toxicol. Lett., 2013, 217, 205-216.16.H. Yang, M. Xu, S. Li, X. Shen, T. Li, J. Yan, C. Zhang, C. Wu, H. Zeng and Y. Liu, RSCAdv., 2016, 6, 29685-29696.17.M. Huang, Z. Ma, E. Khor and L.-Y. Lim, Pharm. Res., 2002, 19, 1488-1494.18.N. Q. Bui, K. K. Hlaing, V. P. Nguyen, T. H. Nguyen, Y.-O. Oh, X. F. Fan, Y. W. Lee, S. Y.Nam, H. W. Kang and J. Oh, Comput. Med. Imaging Graph., 2015, 45, 57-62.19.P. Manivasagan, N. Q. Bui, S. Bharathiraja, M. S. Moorthy, Y.-O. Oh, K. Song, H. Seo, M.Yoon and J. Oh, Sci. Rep., 2017, 7, 43593.S50
In vitroroomNIR laser-triggered release of DOX from FA-COS-TGA-GNRs-DOX In vitro NIR laser-triggered drug release studies were performed in various pH buffers (5.0 and 7.4) at temperature with the same mass concentration. Briefly, 5 mg of FA-COS-TGA-GNRs-DOX was redispersed in PBS and was exposed to an 808 nm laser (1.0 W cm-2) for 300 s.