Transcription
Investor PresentationFirst Quarter 2022
Safe Harbor and Other InformationThis presentation contains “forward‐looking” statements that are based on our management’s beliefs and assumptions and on information currently available to management.Forward‐looking statements include information concerning our possible or assumed strategy, future operations, financing plans, operating model, financial position, future revenues,projected costs, competitive position, industry environment, potential growth opportunities, potential market opportunities, plans and objectives of management, the effects ofcompetition on our business and customer trends.Forward‐looking statements include all statements that are not historical facts and can be identified by terms such as “anticipates,” “believes,” “could,” “seeks,” “estimates” (including,without limitation, financial estimates denoted with an “E,” such as FY22E), “targets,” “guidance,” “expects,” “intends,” “may,” “plans,” “potential,” “predicts,” “prospects,” “projects,”“should,” “will,” “would” or similar expressions and the negatives of those terms, although not all forward‐looking statements contain these identifying words.Forward-looking statements involve known and unknown risks, uncertainties and other factors that may cause our actual results, performance or achievements to be materially differentfrom any future results, performance or achievements expressed or implied by the forward-looking statements. Additionally, these forward-looking statements, particularly our guidance,involve risk, uncertainties and assumptions based on information available to us as of 4/27/22, including those related to the continued impacts of COVID-19 on our business, future financialperformance, global economic conditions and demand for digital transformation. Many of these assumptions relate to matters that are beyond our control and changing rapidly,including, but not limited to, material changes in the value of foreign currencies relative to the U.S. Dollar; the timeframes for and severity of social distancing and other governmentresponses to COVID-19; the continued impact of COVID-19 on new or existing customers’ purchasing decisions and the length of our sales cycles, renewal timing or billings terms; theimpact of the Russian invasion of Ukraine on macroeconomic conditions, and fluctuations and volatility in our stock price. If any such risks or uncertainties materialize or if any of theassumptions prove incorrect, our results could differ materially from the results expressed or implied by the forward-looking statements we make. Further information on these and otherfactors that could cause or contribute to such differences include, but are not limited to those discussed in the section titled “Risk Factors” in our Annual Report on Form 10-K filed for theyear ended December 31, 2021 and our most recent Quarterly Report on Form 10-Q that will be filed for the quarter ended March 31, 2022 and in our other Securities andExchange Commission (“SEC”) filings. We cannot guarantee that we will achieve the plans, intentions, or expectations disclosed in our forward-looking statements, and you should notplace undue reliance on our forward-looking statements.Forward-looking statements represent our management’s beliefs and assumptions only as of the date of this presentation. We undertake no obligation, and do not intend, to update theseforward-looking statements, to review or confirm analysts’ expectations, or to provide interim reports or updates on the progress of the current financial quarter.This presentation includes certain non‐GAAP financial measures and the corresponding growth rates as defined by SEC rules. For additional information, see the slide titled “StatementRegarding Use of Non-GAAP Financial Measures.”Terms such as Remaining Performance Obligations (RPO), Current Remaining Performance Obligations (cRPO) and Renewal Rate shall have the meanings set forth in our filings with theSEC.The information in this presentation on new products, features, or functionality is intended to outline our general product direction and should not be relied upon in making a purchasingdecision. The information on new products, features, and functionality is for informational purposes only and shall not be incorporated into any contract. The information on new products,features, and functionality is not a commitment, promise, or legal obligation to deliver any material, code or functionality. The development, release, and timing of any features orfunctionality described for our products remains at our sole discretion. 2022 ServiceNow, Inc. All Rights Reserved. Confidential.2
Statement Regarding Use ofNon-GAAP Financial MeasuresWe report non-GAAP financial measures in addition to, and not as a substitute for, or superior to, financial measures calculated in accordance with GAAP.We adjust revenues, and related growth rates, and current remaining performance obligations and remaining performance obligations and related growth rates for constant currency toprovide a framework for assessing how our business performed excluding the effect of foreign currency rate fluctuations. To present this information, current period results for entities reportingin currencies other than U.S. Dollars are converted into U.S. Dollars at the exchange rates in effect for the comparison period, rather than the actual exchange rates in effect for the currentperiod. We believe the presentation of revenues and corresponding growth rates adjusted for constant currency facilitates the comparison of revenues year-over-year. We believe thepresentation of current remaining performance obligations and remaining performance obligations growth rates adjusted for constant currency facilitates the comparison of currentremaining performance obligations and remaining performance obligations year-over-year, respectively.Our non-GAAP presentation of gross profit, income from operations, and net income measures exclude certain non-cash or non-recurring items, including stock-based compensationexpense, amortization of debt discount and issuance costs related to our convertible senior notes, loss on early note conversions, amortization of purchased intangibles, legal settlements,business combination and other related costs, and the related income tax effect of these adjustments. The non-GAAP weighted-average shares used to compute our non-GAAP net incomeper share - diluted excludes the dilutive effect of the in-the-money portion of convertible senior notes as they are covered by our note hedges, and includes the dilutive effect of time-basedstock awards, the dilutive effect of warrants and the potentially dilutive effect of our stock awards with performance conditions not yet satisfied at forecasted attainment levels to the extentwe believe it is probable that the performance condition will be met. We believe these adjustments provide useful supplemental information to investors and facilitates the analysis of ouroperating results and comparison of operating results across reporting periods.Free cash flow, which is a non-GAAP financial measure, is defined as net cash provided by (used in) operating activities plus cash paid for legal settlements, repayments of convertible seniornotes attributable to debt discount and business combination and other related costs including compensation expense, reduced by purchases of property and equipment. Free cash flowmargin is calculated as free cash flow as a percentage of total revenues. We believe information regarding free cash flow and free cash flow margin provides useful information to investorsbecause it is an indicator of the strength and performance of our business operations.Our presentation of non-GAAP financial measures may not be comparable to similar measures used by other companies. We encourage investors to carefully consider our results underGAAP, as well as our supplemental non-GAAP information and the reconciliation between these presentations, to more fully understand our business. Please see the tables included at theend of this presentation for the reconciliation of GAAP and non-GAAP results. 2022 ServiceNow, Inc. All Rights Reserved. Confidential.3
We make the world work better for everyone ServiceNow helps digitize andunify organizations so that theycan find smarter, faster, betterways to make work flow.Our 7,400 global enterprisecustomers(1) include approximately80% of the Fortune 500. They all relyon ServiceNow solutions using theNow Platform—the intelligentand intuitive cloud platform—forsuccessful digital transformation.Our aspiration is to be thedefining enterprise softwarecompany of the 21st century.From Fortune. 2021, 2022 Fortune Media IP Limited. All rights reserved. Used under license.Fortune and Fortune 100 Best Companies to Work For are registered trademarks of Fortune Media IP Limited and are used under license.Fortune and Fortune Media IP Limited are not affiliated with, and do not endorse the products or services of, ServiceNow.(1) Global enterprise customers count is as of the end of fiscal 2021. 2022 ServiceNow, Inc. All Rights Reserved.Confidential. 2022 ServiceNow,Inc. All Rights Reserved 4
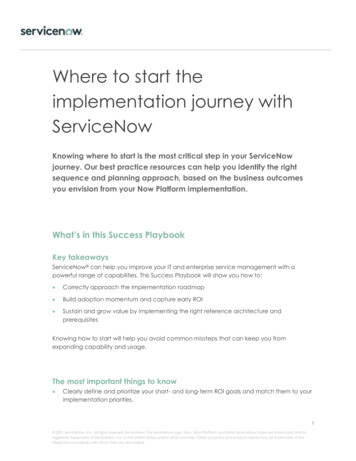
Now Platform :Optimize processes, connect silos, and create new valueon a single, unifying platform to digitize your entire merWorkflowsCreatorWorkflowsAccelerate digitaltransformation withresilient, costefficient, and securetechnology.Deliver a unifiedemployee experiencefor your hybridworkforce.Deliver frictionlesscustomer experiencesthat drive long-termloyalty.Build connectedcross-enterpriseworkflow apps fast. 2022 ServiceNow, Inc. All Rights Reserved 2022 ServiceNow, Inc. All Rights Reserved. Confidential.5
Q1-22 Financial HighlightsQ1 2022 ResultsQuarterly ResultsIncrease(Decrease) Y/YCurrency Impact Y/Y(1)Non-GAAP ConstantCurrency Y/Y(2)Subscription Revenues 1,631M26% 250bps headwind29%Current RPO (cRPO) 5.69B29% 150bps headwind30.5%Remaining Performance Obligations (RPO) 11.5B30% 150bps headwind31.5%Non-GAAP Operating Margin(3)25% (200)bpsNANANon-GAAP Free Cash Flow Margin(3)45% (150)bpsNANA(1) Currency impact on subscription revenue growth rates are derived by applying the average exchange rates in effect during the comparison period rather than the exchange rates for the current period. Currency impact on current RPO andRPO growth rates are derived by applying the end of period exchange rates in effect during the comparison period rather than the actual end of period exchange rates in effect during the current period.(2) Non-GAAP growth rates for subscription revenues, cRPO and RPO are adjusted for constant currency. See slides 9-11 for additional discussion of non-GAAP subscription revenues and their corresponding growth rates. See slide 12 for additionaldiscussion of non-GAAP cRPO and RPO and their corresponding growth rates. See appendix for reconciliation of non-GAAP financial measures to the most comparable GAAP measures.(3) This financial metric and its corresponding growth rate, if applicable, are calculated on a non-GAAP basis. See appendix for a reconciliation of non-GAAP financial measures to the most comparable GAAP measures.Note: Numbers rounded for presentation purposes. 2022 ServiceNow, Inc. All Rights Reserved 2022 ServiceNow, Inc. All Rights Reserved. Confidential.6
Guidance SummaryQ2 2022QuarterlyGuidanceIncrease(Decrease) Y/YCurrency ImpactY/Y Included inGuidance(1)Non-GAAP ConstantCurrency Y/Y(2)Subscription Revenues 1,670M - 1,675M26% 300bps headwind29%Non-GAAP Operating Margin(3)22% (300)bpsNANACurrent RPO (cRPO) Growth(4)25%NA 300bps headwind28%Full-Year 2022Full-YearGuidanceIncrease(Decrease) Y/YCurrency ImpactY/Y Included inGuidance(1)Non-GAAP ConstantCurrency Y/Y(2)Subscription Revenues 7,025M - 7,040M26% 250bps headwind28.5%Non-GAAP Subscription Gross Margin(3)86% 100bpsNANANon-GAAP Operating Margin(3)25% FlatNANANon-GAAP Free Cash Flow Margin(3)31% (50bps)NANAIncludes timing headwind from larger-than-average renewal cohort(1) Currency impact on subscription revenues and current RPO growth rates are derived by applying the average exchange rates in effect during the comparison period rather than the exchange rates for the current period.(2) Growth rate are calculated on a Non-GAAP basis. See appendix for reconciliation of Non-GAAP financial measures to the most comparable GAAP measures.(3) This financial metric and its corresponding growth rate, if applicable, are calculated on a non-GAAP basis. See appendix for a reconciliation of non-GAAP financial measures to the most comparable GAAP measures.(4) ServiceNow has a larger-than-average customer cohort renewing in Q4 2022. As a result, Q2 and Q3 2022 will experience between 1 and 2 points of increasing headwinds to cRPO growth as the contractual obligations wind down. We expect that cohortto renew in Q4 2022, at which time those headwinds will subside and we expect cRPO growth to reaccelerate quarter-over-quarter.Note: Numbers rounded for presentation purposes. 2022 ServiceNow, Inc. All Rights Reserved 2022 ServiceNow, Inc. All Rights Reserved. Confidential.7
Comparison to Previously Issued Guidance( M)SubscriptionRevenuesY/Y Growth25%26%26%Q1-22APrev. Guidance Midpoint(1)Currency Impact(2)26%FY22EQ1 PerformanceActual ResultsGuidance ChangeCurrent Guidance Midpoint(1) Refers to previously issued financial guidance dated 1/26/22(2) GAAP subscription revenues included in our previous guidance are based on the 31-day average foreign exchange rates for December 2021 for entities reporting in currencies other than U.S. Dollars. Currency impact in Q1 2022 represents the impactof the difference between the actual average rates in the period used to calculate our Q1 2022 actual results and the 31-day average foreign exchange rates for December 2021 assumed in our previously issued guidance dated 1/26/22. Currencyimpact on our full-year guidance represents the impact of the difference between the 31-day average foreign exchange rate for March 2022 assumed in our updated full-year 2022 guidance, and the 31-day average foreign exchange rates forDecember 2021 assumed in our previously issued guidance dated 1/26/22.Note: Numbers rounded for presentation purposes and may not foot. 2022 ServiceNow, Inc. All Rights Reserved 2022 ServiceNow, Inc. All Rights Reserved. Confidential.8
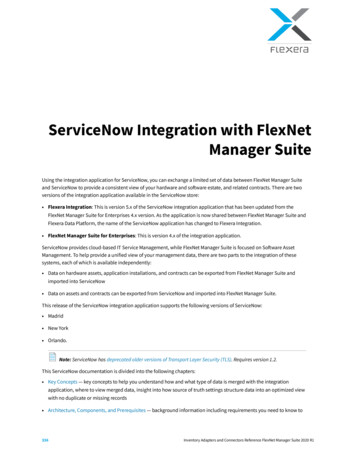
Year-Over-Year Subscription Revenues Growth34%30% 31%30%26%27%31% 31% 30%32%29% 21AQ3-21APrevious Year GrowthActual GrowthQ4-21AQ1-22AFY21ANon-GAAP Constant Currency Sub Revenue Growth (1)(1) Non-GAAP constant currency subscription revenues growth rates are derived by adjusting subscription revenues for constant currency by applying the average exchange rates in effect during the comparison period rather than the exchange rate forthe current or guidance period. See appendix for reconciliation of non-GAAP financial measures.Note: Numbers are rounded to the nearest whole percentage. 2022 ServiceNow, Inc. All Rights Reserved 2022 ServiceNow, Inc. All Rights Reserved. Confidential.9
Comparison of Constant Currency SubscriptionRevenues Growth Guidance to Prior Year sConstant Currency Growth(1)Constant Currency GrowthGuidance Midpoint(1)Q2-21AQ2-22EFY21AFY22E(1) Constant currency subscription revenues growth rates are calculated on a non-GAAP basis and derived by applying the average exchange rates in effect during the comparison period rather than the exchange rate for the current period.See appendix for reconciliation of non-GAAP financial measures.Note: Numbers are rounded to the nearest 50bps. 2022 ServiceNow, Inc. All Rights Reserved 2022 ServiceNow, Inc. All Rights Reserved. Confidential.10
Currency Impact to Year-Over-Year Sub. Revenues 1,330 1,285 1,427 1,416 1,538 1,523 5,573 1,666 1,631 5,496( 44)( 11) 15 35( 77)Q2-21AQ3-21AQ4-21AQ1-22AFY21A( M)SubscriptionRevenuesY/Y Growth31%27%Actuals31%30%29%Currency Impact30%26%29%30%28%Non-GAAP Constant Currency Sub Revenues (1)(1) Non-GAAP constant currency subscription revenues and the corresponding growth figures are calculated on a non-GAAP basis and derived by applying the average exchange rates in effect during the comparison period rather than the exchange ratefor the current period. See appendix for reconciliation of non-GAAP financial measures.Note: Numbers rounded for presentation purposes and may not foot. 2022 ServiceNow, Inc. All Rights Reserved 2022 ServiceNow, Inc. All Rights Reserved. Confidential.11
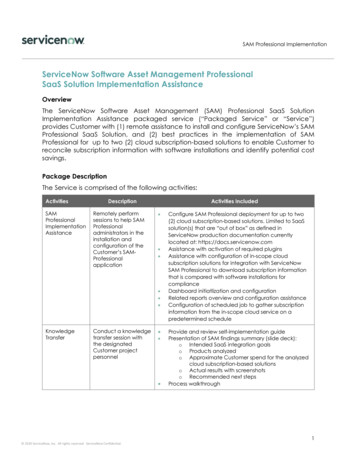
Remaining Performance Obligations( B)Current RPO 8.8 9.5Noncurrent RPO 11.5 11.5 5.8 5.8 9.7 4.4 4.8 4.7 4.42 4.75 4.96 5.68 5.69Q1-21Q2-21Q3-21Q4-21Q1-22cRPO Y/Y Growth33%34%32%29%29%cRPO cc(1) Y/Y Growth29%31%32%32%30.5%Q1-22Y/Y Growth 30% / 31.5% cc(1)Total RPO(1) The total RPO and current RPO growth rates adjusted for constant currency are calculated on a non-GAAP basis. Results for entities reporting in currencies other than U.S. Dollars are converted into U.S. Dollars at the exchange rates in effect at the endof the comparison period, rather than the actual exchange rates in effect at the end of the current period. See appendix for reconciliation to non-GAAP financial measures.Note: Numbers rounded for presentation purposes. 2022 ServiceNow, Inc. All Rights Reserved 2022 ServiceNow, Inc. All Rights Reserved. Confidential.12
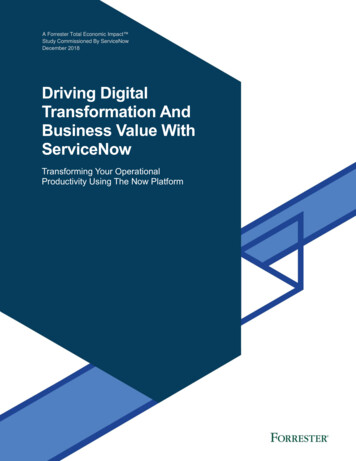
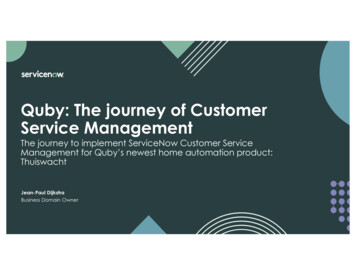
Customer Cohort GrowthAnnual Growthof Initial ACV57%60%77%76%73%98%105%83%102%109%154%176% (1)(1) As an illustrative example, 2010 customer cohort started with a contract of initial ACV (annual contract value) of 100 and grew to ACV of 2,212 as of Q1-22, and represents growth of initial ACV of 176%Note: Chart reflects growth in total annual contract value over time, inclusive of losses, for the group of customers that joined ServiceNow in each respective year. Annual Growth represents increases in total annual contract value after theinitial contract of each customer. 2022 ServiceNow, Inc. All Rights Reserved 2022 ServiceNow, Inc. All Rights Reserved. Confidential.13
Expansion of Customer Relationships( M) 3.2 3.3925959Q1-20Q2-20 3.41,004Q3-20 3.51,077Q4-20 3.51,131Q1-21Number of Customers with 1M ACV 3.61,192Q2-21 3.71,252Q3-21 3.81,345Q4-21 3.91,401Q1-22Avg ACV of Customers with 1M ACVNote: Previously disclosed number of customers with ACV greater than 1 million is restated to allow for comparability. ACV is calculated based on the foreign exchange rate in effect at the time the contract was entered into. Foreign exchange ratefluctuations could cause some variability in the number of customers with ACV greater than 1 million. 2022 ServiceNow, Inc. All Rights Reserved 2022 ServiceNow, Inc. All Rights Reserved. Confidential.14
Net New ACV ContributionAcross Workflows and Products(1)Technology Workflows20%25%55%Q1-2114%Customer & Employee WorkflowsCreator Workflows & 1Q1-2225%(1) Historical presentations disclosed net new ACV contribution across products and are not comparable to net new ACV contribution across workflows and products disclosed herein.Note: Technology Workflows (formerly IT Workflows) include IT Service Mgmt, IT Operations Mgmt, IT Business Mgmt, IT Asset Mgmt, Security Operations, Governance, Risk and Compliance, Telecom Network Performance Mgmt, and others. Customer andEmployee Workflows include Customer Service Mgmt, Field Serv
Investor Presentation First Quarter 2022 . Now Platform—the intelligent and intuitive cloud platform—for successful digital transformation. . Guidance Summary Q2 2022; Quarterly Guidance. Increase (Decrease) Y/Y. Currency Impact Y/Y Included in Guidance (1) Non-GAAP Constant