Transcription
Foundational overviewof the Eastern Capelabour marketJohn ReynoldsNeil Aggett Labour Studies Unit Research Report 1Institute of Social and Economic ResearchSeptember 2013www.ru.ac.za
Foundational overview of theEastern Cape labour marketJohn ReynoldsSeptember 2013in partnership with
AcknowledgementsThe inputs of a number of people into the process that led to this report are acknowledged withgratitude.Particular thanks go to Gilton Klerck for his substantive inputs on the legislative and institutionalframework, and on segmentation theories. Thanks also go to Ulandi du Plessis for her backgroundresearch on skills development, for data entry support and for cover and map design, and to DavidFryer and Robert van Niekerk for their generous sharing of ideas and insights. Thanks to SivuyiseDlova and Kanyiso Ntikinca, who, as Masters students funded by the Neil Aggett Labour StudiesUnit (NALSU), were thrown in the deep end, and gathered much useful information that will serve anumber of our initiatives as a unit, as well as their own research.The NALSU has been established within the Institute of Social and Economic Research of RhodesUniversity with financial support from the Department of Economic Development, EnvironmentalAffairs and Tourism (DEDEAT) of the Eastern Cape Provincial Government, Republic of SouthAfrica. This funding allows for the phased building of a labour market research capability within theInstitute of Social and Economic Research at Rhodes University, which will build on our collectiveunderstanding of the Eastern Cape labour market in its national and historical context, and contributeto informed policy development. This foundational overview of the Eastern Cape labour market is thefirst step in building a multi-faceted research programme.We wish to thank not only DEDEAT for its financial support, but also the provincial head office ofthe Department of Labour and the management of the Expanded Public Works Programme in theEastern Cape Department of Roads and Public Works for their support, including facilitation of accessto administrative data and provision of contextual information useful to the interpretation of thosedata. We also wish to thank the Eastern Cape Socio-Economic Consultative Council for its support inthe establishment of this unit. Finally, we wish to thank Rhodes University for providing a supportiveinstitutional context for our work.The views expressed in this report are those of the author and do not necessarily reflect the views ofour funders or supporting institutions.
Institute of Social and Economic Research Neil Aggett Labour Studies UnitExecutive Summary11IntroductionAny overview of the Eastern Cape labour market has to consider its national and historical context,which includes not only the location of the Eastern Cape within the development of the South Africaneconomy, but, tied to that, the location of such economic development itself within a larger socialand historical context. Engaging in labour market analysis is not a theoretically or politically neutralexercise. Analyses undertaken in this report are generally positioned within the political economytradition, in terms of which the economy is viewed not in the abstract, but as embedded within socialand political systems with particular historical and geographic or spatial forms.This report includes an outline of the legislative and policy framework through which formalorganisation of the labour market is framed. Excluded from direct coverage by this framework arethe people who are marginalised or excluded from active participation in the labour market by theways in which South African economic and social relations are structured. Those who are excludedare variously counted as the unemployed, the underemployed and the informally employed, and areparticularly well represented in the Eastern Cape Province of South Africa.This foundational overview of the Eastern Cape labour market does not limit itself to the formalsector, or even to a quantification of unemployment, but also explores incomes and the distribution ofincomes and income poverty.At its core, this foundational overview of the Eastern Cape labour market is an account ofemployment, unemployment, incomes and education drawing on Census data and on administrativedata provided by the Department of Labour and the Department of Public Works.2Institutional and legislative frameworkFrom an international perspective, the International Labour Organisation (ILO) provides a keyreference point to governance of the labour market. As part of the United Nations system, it is a keycomponent of the international institutional architecture with which member states interact aroundissues of labour markets and labour. South Africa is one of those member states.International efforts to develop a set of standards for labour and social rights did not leave SouthAfrica unaffected, as is evidenced by the African National Congress’s 1943 document, Africans’ Claimsin South Africa, and the Freedom Charter of 1955. The formal end of apartheid and the first democraticelections in South Africa in 1994 were followed by the adoption of the final Constitution in 1996.Section 23, which is part of the Bill of Rights in that Constitution, contained a number of guidelinesfor labour relations. These constitutional principles were given legislative and institutional content inthe form of a number of Acts of Parliament and a range of labour market institutions.In giving effect to the constitutional principles and South Africa’s international commitments, thevarious pieces of labour legislation passed by Parliament since 1994 embedded the principle of regulatedflexibility, in terms of which an acceptable balancing of efficiency and equity was to be sought in labour1Source references and much detail are omitted from this Executive Summary, as its function is not to replace the text of themain report, but rather to interest the reader in that text.Foundational overview of the Eastern Cape labour market (2013) iii
Institute of Social and Economic Research Neil Aggett Labour Studies Unitrelations. The national Department of Labour was allocated key responsibility for supporting thefunctioning of the institutional infrastructure established through the Labour Relations Act and forthe setting and enforcement of minimum standards, amongst other things. Until November 2009,these responsibilities included management of the institutional infrastructure established for skillsdevelopment, after which these responsibilities were moved to the Department of Higher Educationand Training.In general, labour market regulation in South Africa became increasingly corporatist from the early1990s, which sat uneasily with the entrenchment of neo-liberalism in South African macro-economicpolicy, and, indeed, the history and structure of capitalism in South Africa, a situation that arguablyundermined the functioning of the National Economic Development and Labour Council (NEDLAC)itself.The legislative and institutional framework for regulation of the labour market has a significant effecton labour market outcomes, but is by no means definitive. This is not just because formal regulatoryframeworks are imperfect or limited in the face of complex and changing conditions, but also becausesuch frameworks are not uniquely constitutive of the realities faced by people who attempt to secureincomes and livelihoods. Formal regulatory frameworks emerge in complex social, economic andpolitical contexts, animated by the dynamics of class relations.3The economy and policy interventionsGrowth of the national economy, which had developed around a minerals-energy complex and hadbeen built on cheap black labour, declined during the 1980s and early 1990s, contributing to thepressure towards a negotiated settlement to end apartheid. The new democratic state inherited aneconomy in decline, a spatially fractured territory, high levels of inequality and poverty, and low levelsof education, strongly skewed towards the black population. The policies adopted since 1994 havenot fundamentally altered the structure of the South African economy and have entrenched neoliberalism in South Africa.Historically, the Eastern Cape, which includes two of the largest former Bantustans in SouthAfrica, served as a key site of labour reproduction in support of the development of the SouthAfrican economy. Although attempts were made, pre-1994, to encourage decentralised economicdevelopment in the territory that became the Eastern Cape Province, the urban centres of EastLondon and Port Elizabeth, and related hinterland, developed as the core of the economy.Policy responses to poverty, unemployment and inequality included the Provincial Growth andDevelopment Strategy of 1997, and the Provincial Growth and Development Plan 2004-2014(PGDP). The PGDP argued for active state intervention in the economy, but acknowledged thatmany key instruments of economic policy and investment lay outside the control of the province.A Strategic Framework for Human Resource Development launched a process that led to thedevelopment of a Provincial Skills Development Plan in 2005 in support of the PGDP. This plan,however, was overtaken by the release of the Accelerated and Shared Growth Initiative – SouthAfrica (ASGISA) and the establishment of the Joint Initiative for Priority Skills Acquisition (JIPSA) in2006, which is also the year in which the provincial social partners signed the provincial Jobs SummitAgreement. A Provincial JIPSA Council was established and later replaced by the Provincial HumanResource Development Council, which still functions. In 2009, a Provincial Skills Indaba was heldand a Provincial Industrial Development Strategy was released. The Eastern Cape Jobs Strategy wasreleased in 2012.iv Foundational overview of the Eastern Cape labour market (2013)
Institute of Social and Economic Research Neil Aggett Labour Studies UnitAt a policy level, the Eastern Cape Provincial Government has consistently committed itself to stateintervention in the economy, but has had limited success in effecting such intervention, due in part togovernance challenges, the constraints of national policy and practice, and the structure of the nationaleconomy.44.1Employment, unemployment, education and incomes in the Eastern CapeEmploymentThe Community, Social and Personal Services (CSP) sector and the Wholesale and Retail sector dominatedemployment in the Eastern Cape in 2001 and 2011, and elementary occupations dominatedemployment in 2001 and 2007. Detailed analysis of employment by industrial sector and occupationalcategory was not possible for 2011, as the Census 2011 data released by the time this report waswritten did not include that information.According to the Department of Labour’s Job Opportunities Index (JOI), vacancies in the EasternCape during the period 2009/10-2011-12 were dominated by the Financial, Intermediation, Insurance, RealEstate and Business Service sector, followed by the CSP sector. The following occupational categoriesdominated vacancies in the same period: professionals, managers, technicians and trade workers, andclerical and administrative workers – however, JOI reliance on vacancies advertised in the media mighthave excluded vacancies for elementary workers.In 2011, the Eastern Cape broad labour force stood at 1,951,189 people, of whom 1,028,964 (53%)were employed. Amongst those classified as employed, however, are people in marginal employmentpositions – potentially a greater proportion than is indicated by the 28% who indicated that theywere not employed in the formal sector, as more than 90,000 people employed in the formal sectorindicated that they earned no income.According to Statistics South Africa, the Eastern Cape experienced the highest net out-migration ofall provinces in South Africa in 2007 and 2011, with only Limpopo coming close.The majority of recorded complaints lodged with the Department of Labour over the period 2001/022011/12 related to the Basic Conditions of Employment Act.The Expanded Public Works Programme (EPWP) in the Eastern Cape has managed to generateincreasingly higher numbers of projects and work opportunities from its inception in 2004/05to 2011/12. In 2011/12, the EPWP in the Eastern Cape generated the highest number of workopportunities of all provinces in South Africa, even though the number of EPWP projects wascomparatively modest. The Eastern Cape Provincial Government dominated the number of workopportunities and person years of work (including training) created by any of the other spheres ofgovernment or the non-state sector. Work opportunities created per district in the province generallyfit the distribution of employment need in 2011, but with the Chris Hani District being particularlywell represented in relative terms.4.2UnemploymentThe expanded definition of employment is used in preference to the official/narrow definition, asjustified in the main report.Foundational overview of the Eastern Cape labour market (2013) v
Institute of Social and Economic Research Neil Aggett Labour Studies UnitIn 2011, 47% of the Eastern Cape population was unemployed – this amounted to 922,225 people.One’s appreciation of the scale of this challenge deepens if one considers the low requirements forclassification of a person as employed. This was the highest rate of unemployment of all provinces inSouth Africa. In general, districts in the Eastern Cape that contained parts of the former Bantustanshad the highest rates of unemployment, with the rates for the Alfred Nzo, OR Tambo and Amatholedistricts all reaching 57% or higher. In general, people living in tribal or traditional areas experiencedthe highest level of unemployment, with 65% of them unemployed.In 2011, 57% of people aged 15-34 years were unemployed – this figure rose to 69% for those aged15-24 years. These figures exclude people who were not in the labour force, e.g. those who were inschool or post-school education.In 2011, 53% of people classified as Black African were unemployed – the corresponding figures forpeople classified as Coloured, Indian or Asian, and White were 35%, 14% and 8%, respectively. Theunemployment rate for women was 50%.Only a small proportion of the unemployed appear to register as work-seekers with the Department ofLabour, based on comparison of the number of registered work-seekers in 2010/11 and 2011/12 andthe number of unemployed people in the province. Very few of those who registered as work-seekersare placed. After a high in 2001/02, Unemployment Insurance Fund applications fluctuated until aspike to 72,226 in 2009/10, before dropping to above 60,000 in 2010/11 and 2011/12. Registrationof retrenchments with the Department of Labour appears to be low, given the numbers of UIFapplications and registered work-seekers.4.3EducationThe largest proportion of the working age population in the Eastern Cape in 2011 had some highschool education (Grade 8-11) as their highest level of education, followed by those with someprimary education (Grade 0-7) – the percentages were 26% and 14%, respectively. The No education,Grade 0-7 and Grade 8-11 categories combined accounted for 43% of the working age population,confirming the generally low levels of skill in the province.The working age populations of the two metropolitan municipalities had the highest proportions ofpeople with Grade 12 as their highest level of education, and with post-school education. The districtmunicipalities containing portions of the former Bantustans had the lowest proportions of theirworking age populations with Grade 12 as their highest level of education.In 2011, 77% of those who were employed in the Eastern Cape had Grade 12 or lower as their highestlevel of education, and 39% had Grade 11 or lower as their highest level of education. The largestproportion of the employed (38%) had matric as their highest level of education, followed by thosewith some high school education (31%), some primary education (8%), and a Bachelor’s degree orhigher (8%).Almost half of the unemployed in the Eastern Cape in 2011 had Grade 8-11 as their highesteducational qualification, followed by those with Grade 7 or less, and then those with Grade 12(the latter a higher proportion than those with no education). Together, those with educationallevels of Grade 11 or less accounted for 75% of all of the discouraged work-seekers and 70% ofthe total number of unemployed (expanded definition). Those with educational levels higher thanmatric accounted for only 1% of all of the discouraged work-seekers and 3% of the total number ofunemployed (expanded definition).vi Foundational overview of the Eastern Cape labour market (2013)
Institute of Social and Economic Research Neil Aggett Labour Studies UnitGraduate unemployment was low, with only 7% of those with university degrees being unemployed in2011. The corresponding rate amongst diplomates (those with a certificate with Grade 12, a diplomawith Grade 12, a Higher Diploma, a Post Higher Diploma, or a Masters or Doctoral Diploma) was15%. The graduate unemployment rate was highest amongst people classified as Black African (9%).4.4IncomesIn 2011, the Eastern Cape had the second highest proportion of people earning R800 or less permonth – 69% of the population, or 4,153,540 people. This proportion rose to above 70% for thedistrict municipalities that include portions for the former Bantustans, with the levels in the AlfredNzo and OR Tambo districts rising to 77%.In 2011, just more than a quarter of employed people in the Eastern Cape earned R800 or less permonth (264,182 people), with 46% (476,731 people) earning between R801 and R6400 per month.This means that 72% of employed people in the Eastern Cape earned R6400 or less per month – 45%earned R1600 or less per month. Employed people classified as Black African dominated the lowerincome categories, as did women, with the ratio of women to men becoming increasingly even as onemoves up the income scale.Almost a quarter of employed people living in tribal or traditional areas in 2011 earned no income, and46% earned R800 or less per month, the latter compared to 20% of employed people living in urbanareas and 20% of people living on farms. Seventy-four percent of employed people living in tribal ortraditional areas earned R3200 or less per month. Higher proportions of employed people classifiedas White and living in urban areas were represented in the higher income categories than any of theother population groups. People working in the formal sector dominated all earnings categories. Thereappeared to be a strong link between education and incomes amongst employed people.The EPWP, which targets mainly people in the elementary occupations, provides data on wages paidto people employed on its projects. The average EPWP daily wage rate for the Eastern Cape didnot consistently increase from 2004/05-2011/12, reaching a high of R67.93 in 2011/12 (R1,358.60a month, assuming 20 working days per month). When wage rates are disaggregated by sphere ofgovernment and the non-state sector, the highest average daily wage rate (R82.00) was recordedfor district and metropolitan municipalities in 2011/12 – this translates into R1,640.00 per month,assuming 20 working days per month. The calculated wages paid out by provincial governmentdepartments exceeded those paid out by national government departments, municipalities and thenon-state sector in all years except for the first two years of the EPWP.Transforming the annual household income figures contained in the Census 2011 data into monthlyhousehold income reveals that, in 2011, 16% of Eastern Cape households had no income, 22% earnedR400 or less per month, 31% earned R800 or less per month, 54% earned R1633 or less per month,and 74% earned R3183 or less per month. This means that more than half of households in the EasternCape had a monthly household income that was less than the minimum living level established for ahousehold of four by both the National Planning Commission and the National Labour and EconomicDevelopment Institute (NALEDI), and almost three quarters of Eastern Cape households had amonthly income below the supplemented living level for a family of four calculated by NALEDI.The district municipalities that contain parts of the former Bantustans had the lowest monthlyhousehold incomes – in the Amathole, Chris Hani, Joe Gqabi, OR Tambo and Alfred Nzo Districts,80% or more of households had a monthly household income of R3183 or less (the proportion was87% for people living in tribal or traditional areas in the province). In the Joe Gqabi, OR Tambo andFoundational overview of the Eastern Cape labour market (2013) vii
Institute of Social and Economic Research Neil Aggett Labour Studies UnitAlfred Nzo Districts, more than a third of households earned R800 or less per month. Generally, thebest monthly household income figures were found in the two metros and the Cacadu District.5ConclusionThe overview of the Eastern Cape labour market provided in this report shows that the people ofthis province continue to be marginalised by economic development in the province and SouthAfrica at large. Given its historical relation to the development of the minerals-energy complex, thisis perhaps not surprising, but the persistence of the spatial legacy of apartheid, and low incomesand levels of education are causes for concern. Combined with the depth of unemployment in thisprovince and the precariousness of employment for many, these findings raise fundamental questionsabout our economic trajectory and about the effects that changes have had to date on the people ofthis province. Fundamental questions are also raised about the scope of social policy required for thepeople of this province to share in the ideals that inspired the struggle against apartheid and the rightsenshrined in the South African constitution, and about the kind of society and citizen that we wish tobuild.viii Foundational overview of the Eastern Cape labour market (2013)
Institute of Social and Economic Research Neil Aggett Labour Studies UnitContentsAcknowledgementsiiExecutive Summary1 Introductioniiiiii2 Institutional and legislative frameworkiii3 The economy and policy interventionsiv4 Employment, unemployment, education and incomes in the Eastern Cape4.1 Employment4.2 Unemployment4.3 Education4.4 Incomesvvvvivii5 ConclusionviiiAbbreviations11 Introduction22 Institutional and legislative framework2.1 International and historical reference points2.2 Legislative and institutional arrangements to regulate the South African labour market5583 The economy and policy interventions3.1 The economy and the labour market3.2 Policy responses in the Eastern Cape1313164 Employment, unemployment, education and incomes in the Eastern Cape4.1 Employment4.1.1 Employment by sector and occupational category4.1.2 Characteristics of employment and the employed4.1.3 Migration4.1.4 Complaints registered with the Department of Labour4.1.5 Employment created through the Expanded Public Works 4.2.1 Unemployment per geographical area4.2.2 Unemployment by age4.2.3 Unemployment by population group4.2.4 Unemployment by gender4.2.5 Administrative data on unemploymentFoundational overview of the Eastern Cape labour market (2013) ix
Institute of Social and Economic Research Neil Aggett Labour Studies Unit4.34.4Education levels4.3.1 General education levels4.3.2 Education levels of employed people4.3.3 Education levels of unemployed peopleIncomes4.4.1 Income in the population in general4.4.2 Income earned by employed people4.4.3 Income by people employed on EPWP projects4.4.4 Household income5252616364646673765 Conclusion79References83x Foundational overview of the Eastern Cape labour market (2013)
Institute of Social and Economic Research Neil Aggett Labour Studies UnitAbbreviationsBCEABasic Conditions of Employment ActCCMACouncil for Conciliation, Mediation and ArbitrationCMECoordinated Market EconomyCOSATUCongress of South African Trade UnionsCOIDACompensation for Occupational Injuries and Diseases ActCSPCommunity, Social and Personal ServicesDEDEATDepartment of Economic Development, Environmental Affairs and Tourism,Eastern Cape Provincial GovernmentECSECCEastern Cape Socio-Economic Consultative CouncilEPWPExpanded Public Works ProgrammeFETFurther Education and TrainingGDPGross Domestic ProductHSRCHuman Sciences Research CouncilIPAPIndustrial Policy Action PlanILOInternational Labour OrganisationISERInstitute of Social and Economic Research, Rhodes UniversityJOIJob Opportunities IndexLMELiberal Market EconomyLRALabour Relations ActNALSUNeil Aggett Labour Studies UnitNALEDINational Labour and Economic Development InstituteNEDLACNational Economic Development and Labour CouncilNSDSNational Skills Development StrategyOHSAOccupational Health and Safety ActSETASector Education and Training AuthorityStatsSAStatistics South AfricaUIAUnemployment Insurance ActUIFUnemployment Insurance FundFoundational overview of the Eastern Cape labour market (2013) 1
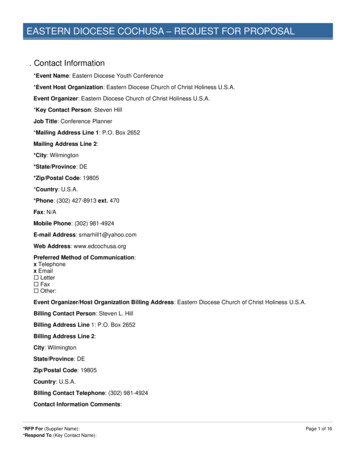
Institute of Social and Economic Research Neil Aggett Labour Studies Unit1 IntroductionAny overview of the Eastern Cape labour market has to consider its national and historical context,which includes not only the location of the Eastern Cape within the development of the South Africaneconomy, but, tied to that, the location of such economic development itself within a larger social andhistorical context. Although these issues are not covered exhaustively in this report, some remarksare made to assist the reader in interpreting more specific contemporary quantitative analyses and theinstitutional and policy environment within which labour is reproduced and employed, and in whichpoverty and inequality arise.Map 1:The Eastern Cape Province of South Africa2 Foundational overview of the Eastern Cape labour market (2013)
Institute of Social and Economic Research Neil Aggett Labour Studies UnitEngaging in labour market analysis is not a theoretically or politically neutral exercise. Analysesundertaken in this report are generally positioned within the political economy tradition, in termsof which the economy is not viewed in the abstract, but as embedded within social and politicalsystems with particular historical and geographic or spatial forms. Work within this tradition includesconsideration of social values, and is inspired by the deep humanism that characterised the work ofthe early social theorists and the rights-based frameworks that have shaped international commitmentsto minimum labour standards. Examples of the latter include the general principles adopted at thefounding of the International Labour Organisation, the South African Freedom Charter, and theguidelines for labour relations provided in the South African Constitution.Where reference is made to the rights-based perspective, this is done in full consciousness of thelimitations of this approach, even while acknowledging the importance of codification and pursuitof rights. The rights-based approach does not necessarily consider how particular social relations ofproduction are reproduced. It does not necessarily probe the relation of the state to the economy, orlead one to analysis of the class relations pertaining in the place and time of analysis. Although thesecritically important matters are not explored in any depth in this report, reference is made to themwhere appropriate.This report includes an outline of the legislative and policy framework through which formalorganisation of the labour market is framed, and in relation to which much of the current contestationregarding the organisation of the labour market occurs. This legislative and policy framework coversissues related to employment and places of employment, as well as education and skills development.Excluded from direct coverage by this framework are the people who are marginalised or excludedfrom active participation in the labour market by the ways in which South African economic andsocial relations are structured. Those who are excluded are variously counted as the unemployed, theunderemployed and the informally employed, and are particularly well represented in the EasternCape Province of South Africa, as will be shown below.This foundational overview of the Eastern Cape labour market does not limit itself to the formalsector, or even to a quantification of unemployment, but also explores incomes and distribution ofincome and income poverty. No account of the labour market is complete without consideration ofincome inequality, which is particularly acute in South Africa. Debates regarding wages, including thesetting of minimum wage levels, cannot be resolved by looking at the quantum of unemployment only;critical to the finding of equitable and humane solutions that honour the conception of human rightsenshrined in the South African constitution is consideration of the material requirements for humandignity and social citizenship, and the equity of the current distribution of income.At its core, this foundational overview of the Eastern Cape labour market is an account ofemployment, unemployment, incomes and education levels drawing on Census data and onadministrative data provided by the Department of Labour and the Department of Public Works.The analysis of Census data, in particular data gathered through Census 2011, shows not only thatthe Eastern Cape has the highest rate of unemployment of all provinces in South Africa, but that,within the province, unemployment is particularly acute in the district municipal areas that containportions of the former Bantustans. This continuation of the apartheid spatial legacy illustrates someof the consequences of the structure of the South African economy, and the limitations of policyinterven
increasingly higher numbers of projects and work opportunities from its inception in 2004/05 to 2011/12. In 2011/12, the EPWP in the Eastern Cape generated the highest number of work opportunities of all provinces in South Africa, even though the number of EPWP projects was comparatively modest.