Transcription
TDWI researchthird Quarter 2014TDWI BEST PRACTICES REPORTBusiness-DrivenBusinessIntelligenceand AnalyticsAchieving Value through CollaborativeBusiness/IT LeadershipBy David StodderCo-sponsored bytdwi.org
TDWI researchBEST PRACTICES REPORTBusiness-DrivenBusinessIntelligenceand AnalyticsAchieving Value through CollaborativeBusiness/IT LeadershipBy David Stodderthird Quarter 2014Table of ContentsResearch Methodology and Demographics . . . . . . . . . . . . . 3Executive Summary . . . . . . . . . . . . . . . . . . . . . . . . . 4Driving toward Business-Driven BI and Analytics . . . . . . . . . 5Shadow IT Highlights Need for Business/IT Collaboration . . . . . 6Current Status of BI/Analytics Democratization . . . . . . . . . . 7IT’s Role in BI, Analytics, and Data Warehousing . . . . . . . . . . 9Business/IT Budget Responsibility for BI and Analytics . . . . . 12BI and Analytics Technology Selection Process Roles . . . . . . . 15Accountability for Project Success or Failure . . . . . . . . . . . 17Winning Sponsorship for BI and Analytics Projects . . . . . . . . 18Improving Business/IT Leadership and Collaboration . . . . . . 21Project Leadership for Analytics and Data Discovery . . . . . . . 21Establishing a Center of Excellence and Competency . . . . . . 24Who Participates in CoEs and Competency Centers . . . . . . . . 25Self-Reliance with BI and Analytics Technologies . . . . . . . . 26Technologies Most Important to Business-Driven BI andAnalytics Projects . . . . . . . . . . . . . . . . . . . . . . . . . 28Vendor Products . . . . . . . . . . . . . . . . . . . . . . . . . . 29Recommendations . . . . . . . . . . . . . . . . . . . . . . . . . . 31 2014 by TDWI (The Data Warehousing Institute ), a division of 1105 Media, Inc. All rights reserved. Reproductionsin whole or in part are prohibited except by written permission. E-mail requests or feedback to info@tdwi.org. Productand company names mentioned herein may be trademarks and/or registered trademarks of their respective companies.tdwi.org 1
Business-Driven Business Intelligence and AnalyticsAbout the AuthorDAVID STODDER is director of TDWI Research for business intelligence. He focuses on providingresearch-based insight and best practices for organizations implementing BI, analytics, performancemanagement, data discovery, data visualization, and related technologies and methods. He is theauthor of TDWI Best Practices Reports and Checklist Reports on data discovery, data visualization,customer analytics in the age of social media, BI/DW agility, mobile BI, and informationmanagement. He has chaired TDWI conferences on BI agility and big data analytics. Stodder hasprovided thought leadership on BI, information management, and IT management for over twodecades. He has served as vice president and research director with Ventana Research, and he was thefounding chief editor of Intelligent Enterprise, where he served as editorial director for nine years.About TDWITDWI, a division of 1105 Media, Inc., is the premier provider of in-depth, high-quality educationand research in the business intelligence, data warehousing, and analytics industry. TDWI isdedicated to educating business and information technology professionals about the best practices,strategies, techniques, and tools required to successfully design, build, maintain, and enhancebusiness intelligence and data warehousing solutions. TDWI also fosters the advancement of businessintelligence, data warehousing, and analytics research and contributes to knowledge transfer andthe professional development of its members. TDWI offers a worldwide membership program, fivemajor educational conferences, topical educational seminars, role-based training, onsite courses,certification, solution provider partnerships, an awards program for best practices, live Webinars,resourceful publications, an in-depth research program, and a comprehensive Web site, tdwi.org.About the TDWI Best Practices Reports SeriesThis series is designed to educate technical and business professionals about new business intelligenceand analytics technologies, concepts, or approaches that address a significant problem or issue.Research for the reports is conducted via interviews with industry experts and leading-edge usercompanies and is supplemented by surveys of business intelligence, analytics, and data managementprofessionals.To support the program, TDWI seeks vendors that collectively wish to evangelize a new approachto solving business intelligence and analytics problems or an emerging technology discipline.By banding together, sponsors can validate a new market niche and educate organizations aboutalternative solutions to critical business intelligence issues. Please contact TDWI Research DirectorDavid Stodder (dstodder@tdwi.org) to suggest a topic that meets these requirements.AcknowledgmentsTDWI would like to thank many people who contributed to this report. First, we appreciate themany users who responded to our survey, especially those who responded to our requests for phoneinterviews. Second, our report sponsors, who diligently reviewed outlines, survey questions, andreport drafts. Finally, we would like to recognize TDWI’s production team: Jennifer Agee, RoxanneCooke, Marie Gipson, Denelle Hanlon, Deirdre Hoffman, and Liz Martini.SponsorsActian, Datawatch, Looker, SAS, Tableau Software, and Treasure Data sponsored the research forthis report.2 TDWI research
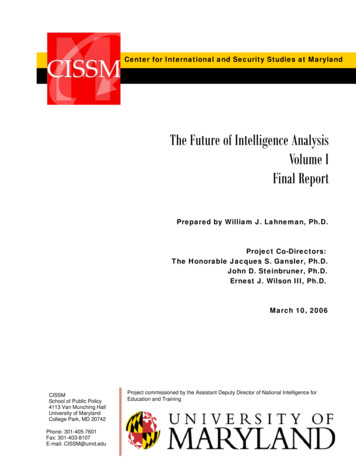
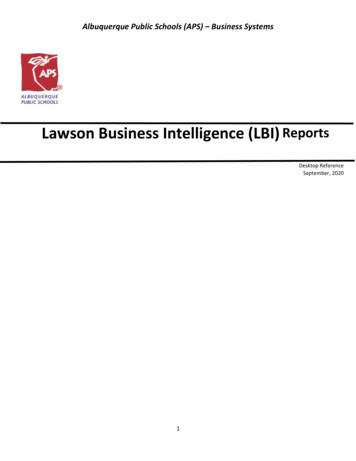
Research Methodology and DemographicsResearch Methodology andDemographicsReport Scope. Across organizations, users seek to increase the role of visual datareporting, exploration, and analysis in their determination of best strategiesor actions. Business intelligence (BI), data discovery, and analytics tools andplatforms have been evolving rapidly in response to demand for technologies thatare easier to deploy for use by “nontechnical” users who are subject matter expertsbut not data management experts. IT, while playing a critical role in provisioningand managing data, is adjusting as users’ budgets and desire for control increase.This report will examine organizations’ experiences with business-driven BI andanalytics and recommend best practices.PositionConsultantsSurvey Demographics. The largest percentage of survey respondents is businessexecutives and sponsors/users (48%); included in that group are business and dataanalysts and scientists (23%). Forty-three percent are data and IT professionals,with BI system designers or developers making up the largest part (21%) and VPsand directors of BI, analytics, and data warehouses accounting for 13%. Industryrepresentation was varied, with consulting and professional services making upthe largest industry segment (18%) and financial services next highest (14%). Mostrespondents reside in the U.S. (46%) or Europe (21%), but other regions accountfor 33%.Other Research Methods. TDWI conducted telephone interviews with business andIT executives, VPs of BI/DW, business and data analysts, BI directors, and expertsin BI and analytics. TDWI also received briefings from vendors that offer relatedproducts and services.43%9%Industry18%Consulting/professional services14%Financial servicesEducation7%Software vey Methodology. In February 2014, TDWI sent an invitation via e-mailto business and IT executives; VPs and directors of BI, analytics, and datawarehousing; business and data analysts; line-of-business (LOB) and departmentaldirectors and managers; and other professionals, asking them to complete anInternet-based survey. The invitation was also delivered via websites, newsletters,and publications from TDWI. The survey analysis drew from a total of 668responses. A total of 313 completed every question. Answers from respondentswho answered enough questions for their input to be valuable are included in theresults. Thus, some questions have different numbers of responses. Marketing andsales personnel from technology vendors as well as academics were excluded.48%Business sponsors/usersData and IT professionalsManufacturing vernment: mmunications3%Utilities3%15%Other(“Other” consists of multiple industries, eachrepresented by 2% or less of respondents.)Geography46%United States21%EuropeCanada9%Australia / New Zealand6%Asia / Pacific Islands5%Central or South America5%Africa3%South Asia(including India, Pakistan)3%Middle East2%Company Size by Number of EmployeesMore than 100,00010%22%10,000 to 100,00033%1,000 to 10,000100 to 1,00017%Less than 10017%Don’t know1%Based on 668 survey respondents.tdwi.org 3
Business-Driven Business Intelligence and AnalyticsExecutive SummaryOne of the chief goals of nearly all organizations today is to enable data-driven decisions andactions. Firms want to achieve the “right data, for the right user, at the right time” objective that hascharacterized business intelligence (BI) and data warehousing since their beginnings. They also wantto enable users to push beyond canned reports and limited spreadsheet views to take advantage ofmore advanced data visualization and analytics; then, users can accelerate exploration and discoveryof valuable insights and apply them for business advantage.The latest BI tools,analytic platforms,and SaaS offerings arespurring users to obtaintechnologies themselvesOnly in recent years have BI tools, as well as those in the newer categories of data discovery andsoftware as a service (SaaS), become easy enough for business users to deploy and implement withoutconsiderable handholding by IT developers and data analysts. Analytic database platforms that arespecifically designed to support data discovery and advanced analytics are also now easier to deploy,load with data, and use. Offering flexible data visualization, dashboard-based information views,analytics, and more, the latest BI tools, analytic platforms, and SaaS offerings are spurring users inbusiness functions and lines of business (LOB) to venture beyond the boundaries of IT managementand obtain technologies themselves.This trend toward “business-driven,” rather than IT-driven BI and analytics, is riding the momentumcreated by technology change and strong interest, if not CEO-driven mandates, to infuse datainto all decisions and actions. This TDWI Best Practices Report explores key drivers behind thistrend and examines how organizations are both taking advantage of it and realigning business-ITcollaboration to avoid pitfalls. Organizations need this collaboration to allocate resources effectivelyand adhere to data governance policies.Our research finds that, overall, IT still plays a major, if not dominant, role in BI and analyticsimplementations. As they have historically, IT and corporate-level leadership still head upsponsorship of most BI and analytics projects. However, it is becoming more important to avoid“technology for technology’s sake” and to define the benefits of technology deployment in termsof business advantages, such as smarter financial management, more effective marketing, or moreefficient operational processes. Business-side leadership and IT leadership need to align business andtechnology objectives so that projects can succeed in satisfying users.Business-sideparticipation in CoEsand competencycenters remains low.One way that some organizations have effectively brought together business and IT leadership is byestablishing a BI and analytics center of excellence (CoE) or competency center. Such an institutioncan bring the sides together to share best practices, identify training needs, tighten alignmentbetween BI and analytics and business processes, manage data governance, and more. Currently,however, our research finds that business-side participation in CoEs and competency centers is low.If business-driven BI and analytics are to be sustained with less direct IT involvement, business-sideleadership must step up to ensure that chaos does not reign and to provide direction for the adoptionof new technologies and practices for the betterment of the enterprise as a whole. Otherwise,organizations could invite data confusion and unnecessarily waste precious budget and resources.4 TDWI research
Driving toward Business-Driven BI and AnalyticsDriving toward Business-Driven BI and AnalyticsFelix Ungar: I put order in this house. For the first time in months, you’re saving money. You’resleeping on clean sheets. You’re eating hot meals for a change and I did it.Oscar Madison: Yes. That’s right. And then at night after we’ve had your halibut steak and yourtartar sauce, I have to spend the rest of the evening watching you Saran Wrap the leftovers.—From The Odd Couple by Neil SimonYin and yang, order and chaos, Felix and Oscar: These and similar comparisons have been used todescribe the necessary but sometimes fractious relationship between business (Oscar) and IT (Felix).The notion is that the business side lives amid the creative chaos of trying to survive in a dynamiceconomic environment while IT fastidiously works behind the scenes to put the data house inorder. More than a few observers have even borrowed the title of John Gray’s 1992 bestseller aboutgender differences, Men Are from Mars, Women Are from Venus, to describe the relationship betweenbusiness and IT. In Gray’s view, men and women communicate effectively during periods of stressonly when each understands the distinctive customs and characteristics of the other’s “planet.” Thesame could be said about business users and IT.IT’s role in business intelligence (BI) and analytics remains vital, primarily for developing andmanaging the BI and data infrastructure and increasingly for data governance. However, thespotlight today is on “business-driven” BI and analytics. Data assets play an ever greater role inbusiness decision making; business users want more data and more control over how they access,analyze, present, and share it. “Business-driven projects will focus on answering questions that arepresented as challenges within your company,” writes Lyndsay Wise, president and founder ofWiseAnalytics.1IT’s role in BI remainsvital, primarily fordeveloping and managinginfrastructure.Business decision makers are closest to the issues involved in these challenges and the type ofinformation they need to address them. As executives and managers at corporate, departmental,and LOB levels, they want to be more self-reliant and less dependent on IT. They are the subjectmatter experts (SMEs) and often know the most about the data and its context. “Informationaccess and design need to be driven by the business units most affected by the [BI and analytics]implementation,” Wise writes. “IT’s involvement is essential, but in support of business-drivensponsorship not in lieu of it.”The traditional business/IT relationship is changing. Most business users have lacked the tools, the know-how, and the budgets to access and interact with data effectively on their own, beyond thefunctionality of personal spreadsheets or simple reports tied to applications. Traditionally, small andmidsize firms have started out with no IT function—or at least, not one with responsibility over dataassets. As these firms grow and employees seek larger volumes of data for reporting and analysis,executives may establish a dedicated IT function with responsibility for data provisioning,management, and performance, typically reporting to the CEO or chief operating officer (COO).Separated from the business side, IT over time becomes an enterprise function, serving users inmultiple departments, LOBs, and corporate offices.Separated fromthe business side,IT becomes anenterprise function.This traditional evolutionary path is changing in the digital age, however. Businesses nowlaunch with ingrained data savvy; led by social networks and ecommerce firms, these modernorganizations view data science and analytics as core to their business models and pursuit of marketsuccess. With the service economy growing, organizations that rely on online channels need tocrunch through customer data that goes beyond transactions to behavior. They need data insights1Lyndsay Wise [2014]. Ten Mistakes to Avoid When Bridging the Business/IT Divide, TDWI, Q1.tdwi.org 5
Business-Driven Business Intelligence and Analyticsto develop strategies for new services and to fine-tune operational efficiency to ensure strongcustomer relationships and profitable customer engagement. Additionally, many industries todayare undergoing dramatic changes due to the Internet, data digitization, and policy changes. Bothnew and established companies in industries such as healthcare and media see data as the rawmaterial from which they can draw insights about how to refocus business models and meet shiftingregulatory requirements.Often, business units in such organizations seek to exercise greater ownership over data resourcesseparately from IT, which is then given responsibility primarily for systems and networkinfrastructure. Along with data analysts and scientists, chief data officers, data architects, and otherdata professionals find themselves reporting to business functions rather than IT management. Mostlikely, as business-side leadership seeks to become more data-driven in its decision making andmanagement of operations, the appetite for business-side data ownership, along with the expertiseand technology to realize value from the data, will continue to grow.“Data-drivenprofessionals don’twant to rely too heavilyon IT to enable theirsuccess and innovation.”“The trend towards business-driven BI and analytics is a permanent one,” said Shawn Rogers, VP atEnterprise Management Associates. “Business users have matured over the past 5-10 years, creating acommunity of data-driven professionals who expect and demand access to the information thatdrives their business. They don’t want to rely too heavily on IT to enable their success and innovation.IT will evolve toward a caretaker role, focusing on enabling access and controlling governance andquality issues.”The business-driven BI and analytics trend is propelling strong interest in tools and platforms thatenable business users to work with data continuously, flexibly, and rapidly. Commercial softwareand cloud service providers as well as open-source developers are competing intensely to address themarket for highly visual, easy-to-use BI, analytics, and data discovery tools that enable self-directeddata exploration. Analytics platforms and appliances today are evolving into more pre-configuredand fully integrated systems, making it easier for users to load different types of data and get started.Cloud and software-as-a-service (SaaS) options are making it simpler to spin up data resources foranalytics and reporting to meet dynamic business demands.Data-driven marketing budgets are growing. In 2012, Gartner analyst Laura McLellan projected that by2017, chief marketing officers (CMOs) will outspend chief information officers (CIOs) on technology.Gartner’s research indicated that the marketing function’s budgets for information technology weregrowing at more than twice the rate of IT budgets, no doubt due to the competitive need to accessand analyze big data sources such as clickstreams and online customer behavior logs.“Marketing in a digital world is deeply entwined with technology,” writes Scott Brinker atwww.chiefmartec.com. Indeed, demand for the newest generations of big data and analyticstechnologies is often strongest in marketing, where leadership sees itself in a race to apply thesetechnologies and is unable to wait for IT. In this report, we examine trends in budgets for BI,analytics, and data warehousing spending headed up by business units such as marketing.Shadow IT Highlights Need for Business/IT CollaborationMarketing, of course, is not the only department so entwined; groups such as finance, productdevelopment, and customer service also want to be data-driven and are exhibiting less patience withIT backlogs. To track, analyze, and measure data about business performance, process efficiency,product effectiveness, and more, they are increasingly willing to strike out on their own, first withsingle-user applications and then with larger “shadow” IT systems intended to supply data to entiregroups of users.6 TDWI research
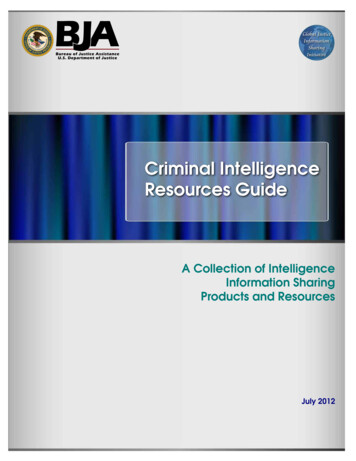
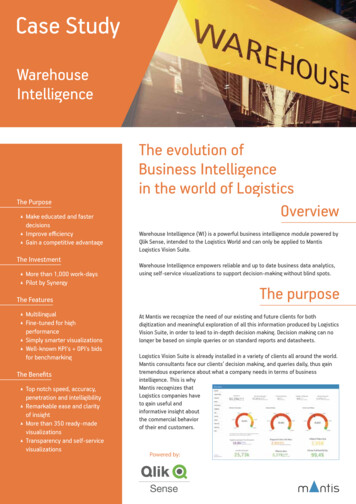
Current Status of BI/Analytics DemocratizationDespite shadow IT growth, TDWI Research finds that today, IT is still the lead sponsor of most BIand analytics projects. However, the trend toward more business-driven BI and analytics will requireadjustment by IT. To smooth the relationship between business and IT, manage enterprise-widepolicies, and foster best practices across business units, many organizations are establishing CoEsand competency centers. This report will discuss survey results to help us understand how commonlyorganizations are establishing such committees, who participates, and whether they are succeeding.This TDWI Best Practices Report will look at these and other trends, directions, and practicesrelated to business-driven BI and analytics. The report will examine budget control, leadership,technology deployment, and the establishment of organizations for joint leadership of projects.TDWI’s goal with this report is to give professionals a research-based understanding of trends in peerorganizations so they can gain insight into where they stand in their organizations. The report willoffer recommendations for rebalancing the business/IT relationship to meet strategic and operationalobjectives with BI and analytics.We offerrecommendationsfor rebalancing thebusiness/IT relationship.Current Status of BI/Analytics DemocratizationThe effort to deploy BI and analytics tools and capabilities to end users of course is not new;organizations have been interested in extending enterprise BI implementations or growingdepartmental installations across units for many years. Thus, to start, we sought a baselineunderstanding of the current level of penetration of BI and analytics tools into the end-usercommunity. TDWI asked research participants what percentage of their organization’s employees isusing BI and/or analytics tools on any platform (see Figure 1). The results show that organizations asa whole are still far from delivering BI to the masses: the often-proclaimed democratization objectiveof supplying the most possible employees in organizations with BI tools for data access, analysis, andpresentation. The largest percentage of research participants (24%) indicated that 10% or less of theirorganizations’ employees are using BI and/or analytics tools, and 17% said that only 11–20% areusing them.Organizations as awhole are still farfrom delivering BIfor the masses.Approximately what percentage of your organization’s employees is using BI and/or analytics tools onany 1%–20%17%10% or lessDon’t know24%8%Figure 1. Based on answers from 668 respondents.tdwi.org 7
Business-Driven Business Intelligence and AnalyticsWe also asked this question of research participants three years ago, in the context of our MobileBusiness Intelligence and Analytics Best Practices Report.2 That report found that for the largestpercentage (43%) of respondents, less than one-quarter of their employees were implementing BI andanalytics tools. For the present report, we sought a finer-grained view of the percentages, as Figure1 shows. However, comparing the responses in the two reports reveals that the results are about thesame, including the percentages at the other end of the spectrum. About one-quarter of participantsin both surveys indicated that more than half of their users are employing BI and/or analytics tools.Thus, in the time between the two research reports, it has remained the case, for the largestpercentage of organizations surveyed, that less than a quarter of their employees are implementingBI and analytics tools. Filtering the results for different sizes of organization does not change thepercentages much; for example, 22% of participants from organizations with more than 10,000employees indicated that 10% or less of their users are working with the tools.Spreadsheets are not going away. Spreadsheet use is often cited as one of the main obstacles to greatergrowth in deploying specialized BI and analytics tools. Spreadsheet applications such as GoogleSpreadsheets or Microsoft Excel are ubiquitous, giving users ready tools for doing calculations,creating graphs, and performing other types of data analysis. In recent releases, Microsoft hasintegrated BI, data access, and transformation functionality into Excel as well as expanded size limitsto enable analysis of more data. Organizations must therefore evaluate whether to adopt specializedBI and analytics tools in the context of what users are already doing with spreadsheets and theinvestment organizations have in their use for data management and analysis.More than half of usersare using spreadsheetsrather than a BI oranalytics tool.In our research, we asked participants what percentage of their organizations’ employees is usingspreadsheets or spreadsheet-related programs as their primary tool for data access, analysis, andpresentation. Just over half (51%) of participants said more than half of users in their organizationsare using spreadsheets rather than a specialized BI or analytics tool; 21% indicated that more than80% of their users are doing so. The percentages in our research stay about the same no matter howlarge the participants’ companies are.Rather than force users to decide between BI and analytics tools and spreadsheets, most leadingvendors have developed routines to connect their tools to spreadsheet data. Users can then integratespreadsheet analysis into their BI dashboards; they can transform and integrate the data for analysisalong with other data sources, enabling them to implement their BI, data discovery, and analyticstools’ expanded functionality for data visualization, pattern discovery, and other advanced analyticson spreadsheet data. Many data warehousing and analytics platform solutions can also loaddata from other sources into users’ spreadsheets and then refresh it periodically if users prefer tomanipulate the data in spreadsheets.The user story below illustrates how Mindjet has moved beyond siloed spreadsheets and primitiveanalysis to support rapid growth and business change.USER STORY Mindjet shifts data strategy into high gear to adapt to business change.Business innovation today often depends on innovation in data analysis. However, when a company is growingfast, it can be difficult for its data management and analysis capabilities to keep pace. Acquisitions, productand service introductions, and expansion into new sales channels can all create new and different types of data.These new data sources often remain siloed in spreadsheets or application data stores, making it hard for users toaccess and analyze them in their quest to discover data insights to support business innovation.8 TDWI research2David Stodder [2012]. Mobile Business Intelligence and Analytics, TDWI Best Practices Report, Q1, p. 8.
Current Status of BI/Analytics DemocratizationThis was the challenge facing Mindjet, a San Francisco-based software and services firm that is all aboutinnovation: that is, “turning ideas into action” through mind mapping, collaborative project planning, budgeting,forecasting, and innovation process management. Founded in 1998, Mindjet merged with Spigit in late 2013,bringing into its portfolio advanced analytics for workplace social networks, prediction markets, crowdsourced forecasting, and other leading-edge offerings. The merger also triggered the company’s transition to asubscription-based model.Business users at Mindjet had been getting by through importing data from multiple siloed data stores intospreadsheets. However, data volume, quality, and latency issues were overwhelming this practice. In early 2013,Anna Gordon, Ph.D., joined Mindjet as its first data scientist. Her initial task was just to get her arms around thedata. “It took months to learn where all the different data sources were; we had product engineering data, customerinformation, product usage data, and more in a variety of systems, including in MongoDB, MySQL, spreadsheets,and in the cloud on Heroku.” Gordon and Mindjet’s resident DBA engineered ETL processes to integrate feeds fromthe 15-plus data sources into a central operational data store running on Microsoft SQL Server.With the data in order, Gordon began to implement Looker’s BI and analytics solution, which could plug intoSQL Server. Gordon worked with Looker’s data analysts to develop the initial business data models throughimplementation of LookML, the vendor’s analytical modeling language. She appreciated the flexibility of LookMLand Looker’s development environment. “Instead of being stuck with one model at the beginning that determinedall your queries, with all of our data sources and different and changing product categorizations, we now havethe ability to go back and modify things and do transformations when we need to.”The new dashboards and analytical capabilities have had a positive impact on finance, sales and renewals,product engineering, and other areas of Mindjet’s business management and operations. With direct access toreal-time data, finance is no longer forced into cumbersome processes for downloading data into spreadsheets;marketing can drill into campaign data to understand how their promotions are contributing to the pipeline.Gordon has integrated Looker with the R language, creating v
Business-side leadership and IT leadership need to align business and technology objectives so that projects can succeed in satisfying users. One way that some organizations have effectively brought together business and IT leadership is by establishing a BI and analytics center of excellence (CoE) or competency center. Such an institution