Transcription
urnal of BioJoechniquesiotssing &oceBprISSN: 2155-9821Carrillo-Avila JA et al., J Bioprocess Biotech 2019, 9:1Journal of Bioprocessing & BiotechniquesResearch ArticleOpen AccessA New Procedure for DNA Isolation from Saliva Samples and ComparativeAnalysis of Quality IndicatorsCarrillo Avila JA1*, De la Puente R1, Pinaglia Tobaruela G1, Aguilar Quesada R1, Rueda Medina B2, Correa Rodriguez M2, Espin Vallejo L3123Andalusian Public Health System Biobank, Coordinating Node, Granada, SpainFaculty of Health Sciences, University of Granada SpainAcademia T De Student, Calle Conde Cifuentes, Granada, SpainAbstractBackground: Large population-based studies involving thousands of participants are needed for research ongenetic diseases and epidemiologic studies. Saliva samples are a non-invasive and efficient DNA source for masscollection. The establishment of new optimized DNA isolation procedures from saliva and the determination of themost effective quality indicator are essential for this purpose.Methods: DNA was extracted from 112 saliva samples utilizing a novel method. Samples were pre-treated withProtease for 1 h at 56 C, and reagents from a kit for blood samples were used in the Chemagic MSM-I automatedinstrument with a specifically designed saliva protocol for the Chemagic software. DNA quality was estimated byspectrophotometry, fluorometry, qPCR, SPUD assay and the Agilent 2200 Tape Station.Results: An average DNA yield of 52.58 33.77 µg was obtained with no significant differences betweenmales and females. A260/A280 and A260/A230 ratios of 1.84 0.123 and 1.56 0.297 were obtained respectively. A DINvalue of 6.83 0.90 was observed with a satisfactory functionality calculated by qPCR analysis. On the other hand,significant differences were observed between spectrophotometry, fluorometry and qPCR quantification methods inspite of the low amount of contaminants detected.Conclusion: Collecting as many samples as possible is necessary to establish DNA cohorts that represent thewhole population. The non-invasive procedure described in this work guarantees a large amount of DNA from salivasamples valid for any downstream molecular applications, with an important reduction in costs. Additionally, aninnovative comparison between the DIN values and conventional DNA quality indicators is shown.Keywords: Epidemiologic studies; Saliva DNA; DNA qualitycontrol; Personalized medicine; DNA bankingIntroductionThe current demand for personalized medicine, the importanceof genetic information in drug development and clinical trials andthe great magnitude of epidemiological studies have made the routinecollection of DNA samples [1,2] necessary. Large population-basedstudies involving thousands of participants are needed for the studyof genetic diseases and epidemiologic studies [3]. Mass collection ofblood samples for DNA extraction is sometimes impossible because itrequires venepuncture by trained staff, which makes sample collectionexpensive. Therefore, less invasive and cost-efficient procedures forobtaining DNA are needed [3]. Because of the previous reasons, salivasamples emerge as a promising alternative [4]. In spite of it beingknown that the co-extraction and contamination of human DNAwith a significant proportion of bacterial and viral DNA can occur [5].DNA banks constitute an important repository of samples, which arecollected, processed, and stored in accordance with rigorous qualitycriteria [6]. A sufficient amount of high-quality DNA must be availablefor downstream applications [7]. Optimization and validation of newprocessing methods for DNA purification from different samplesis necessary for biobanks as part of their quality assurance systems[6]. On the other hand, it is essential to establish a standardized andcost-effective workflow [8]. Specific and high-throughput samplepreservation products and nucleic acid extraction methods from salivahave appeared in recent years, with a low processing time and uservariability [9]. Most of the commercial protocols have been optimizedand coupled to commercial devices such as Oragene (DNA Genotek),SalivaBio (Salimetrics, Carlsbad, USA), and Norgen Saliva DNApreservative (Ontario, Canada) for saliva collection, stabilization andJ Bioprocess Biotech, an open access journalISSN:2155-9821storage until DNA extraction. However, in spite of their advantages,the use of these commercial products involves a high cost persample. The usability of DNA for analytical techniques is determinedthrough DNA quality indicators (purity and integrity). To establishthe concentration and purity of DNA samples, the most widespreadand routine method is spectrophotometry [10]. The absorbance ratiobetween 260 nm and 280 nm is used to estimate DNA purity with avalue of 1.8-2.2 considered as “pure” DNA [11]. The 260 nm/230 nmabsorbance ratio is used as a secondary measure of DNA purity [12].Expected 260/230 values for ‘‘pure’’ DNA are commonly within therange between 2.0 and 2.2, although it is considered a questionableDNA quality indicator because of its instability when a saline elutionbuffer is used to dissolve the DNA [13]. Additional and more selectivemethods based on fluorometry such as PicoGreen, Qubit or qPCR,are used for DNA quantification [5]. The presence of inhibitorsfrom nucleic acid extraction reagents or co-purified components inDNA samples is an important issue when they are used in enzymatic*Corresponding author: Jose Antonio Carrillo Avila, Andalusian Public HealthSystem Biobank, Coordinating Node, Granada, Spain, Tel: 34958894658;E-mail: jantonio.carrillo@juntadeandalucia.esReceived June 27, 2019; Accepted August 30, 2019; Published September 06,2019Citation: Carrillo-Avila JA., de la Puente R, Rueda-Medina B, Correa-RodríguezM, Pinaglia-Tobaruela G. et al. (2019) A New Procedure for DNA Isolation fromSaliva Samples and Comparative Analysis of Quality Indicators. J BioprocessBiotech 9: 344.Copyright: 2019 Carrillo-Avila JA, et al. This is an open-access articledistributed under the terms of the Creative Commons Attribution License, whichpermits unrestricted use, distribution, and reproduction in any medium, providedthe original author and source are credited.Volume 9 Issue 1 1000344
Citation: Carrillo-Avila JA., de la Puente R, Rueda-Medina B, Correa-Rodríguez M, Pinaglia-Tobaruela G. et al. (2019) A New Procedure for DNAIsolation from Saliva Samples and Comparative Analysis of Quality Indicators. J Bioprocess Biotech 9: 344.Page 2 of 6or amplification downstream applications [14]. Different methodsare used to check PCR inhibition such as “SPUD” assay [14]. Otherauthors simply test the absence of inhibitor by genotyping specific genefragments [3,15,16]. DNA integrity has traditionally been checked byelectrophoresis in agarose gel. However, the importance of genomicDNA quality for some downstream applications [8], has led to thedevelopment of systems that assess DNA integrity in an objective andstandardized way. In this sense, 2200 Tape Station instrument (AgilentTechnologies) provides a numerical determination of the DNAintegrity called DNA Integrity Number (DIN). The DIN algorithmwas developed to remove user-dependent interpretation of DNAquality and to provide a standardized assessment [17]. In this workwe show a novel adapted method for saliva DNA extraction withoutthe use of specific and expensive devices for sample collection. DNAconcentration and purity, as well as integrity and functionality, havebeen analysed by different methods and instruments. A comparisonbetween the results obtained is presented and discussed in order topropose the most effective quality indicator.Materials and MethodsHuman biological samplesSamples and information related to age and gender were collectedfrom 112 healthy donors aged between 18 and 45 years old. Sampleswere codified, except for 4 donors that were anonymized (leaving 23males and 85 females). Handling of human biological samples wascarried out according to the national legal framework (Spanish Law onBiomedical Research (July 2007)) following informed consent from thedonors. Local scientific and ethics committees approved the proceduresperformed in this work (Project number PI-0414-2014). Participantswere asked to spit saliva into a sterile 15 ml conical tube up to the 2 mlmark without worrying about bubbles. Participants were warned notto drink, eat, smoke, brush their teeth or chew gum during the hourprior to sample collection. The participants rinsed their mouths withwater prior to collection and waited 10 minutes before commencingthe collection. Samples were immediately put into storage at -20 Cuntil processing [18].DNA extractionDNA from the 2 ml saliva samples was extracted by using theChemagic MSM-I Magnetic Separation Module (PerkinElmer Inc.,Massachusetts, EEUU) based on magnetic beads. Specifically, magneticbeads are conjugated with polymers to capture the DNA liberated aftercell lysis and protein degradation [19]. By means of an electromagneticfield, the beads are attracted to magnetized metal rods. DNA is washedwith different washing buffers to be finally eluted in elution buffer,which breaks down the interaction between the beads and the DNA.Reagents from a kit for blood samples (Chemagic DNA Blood Kitspecial 3 ml, Cat n CMG 763-1; PerkinElmer Inc.) were used to isolateDNA from saliva, but using a specifically designed saliva protocol for theChemagic software from the manufacturer, “chemagic DNA saliva4kH12 prefilling VD110715.che”. Before introducing samples into theautomated machine, a previous manual lysis step was performed byadding 2 ml of lysis buffer and 45 µl of Protease supplied in the kit toeach sample, which were incubated for 1 h at 56 C in a water bath.DNA quantification and purity estimationDifferent methods and instruments were used for quantificationand purity assessment of DNA samples. All the samples were analysedby spectrophotometry with the Infinite F200 (Tecan Trading AG,Männedorf, Switzerland). On the other hand, 12 samples were randomlyJ Bioprocess Biotech, an open access journalISSN:2155-9821selected for a comparative analysis by using the spectrophotometerNanodrop One (Thermo Fisher Scientific Inc., Massachusetts,EEUU), the fluorometer Qubit 1.0 (Thermo Fisher Sientific Inc.,Massachusetts, EEUU) and the Genomic DNA Quantification Assaykit based on quantitative PCR (Primerdesign, Southampton, England).Additionally, the presence of contaminant RNA in these 12 DNAsamples was determined in the Qubit 1.0, and the presence of PCRinhibitors with the SPUD assay.Infinite F200 spectrophotometerYield and purity were spectrophotometrically determined for allthe samples by using the Infinite F200; 2 µl of each sample was usedin duplicate and the average value was determined. Concentration wascalculated considering the A260 absorbance value and yield taking intoaccount the elution volume. Purity was estimated with the A260/A280 nmratio and A260/A230 nm ratio as a secondary value.Nanodrop One C spectrophotometerTwelve samples were spectrophotometrically measured with theNanodrop One; 2 µl of each sample was used in duplicate and theaverage value was determined. A260 absorbance value was used tocalculate the concentration, and yield was estimated using the elutionvolume. A260/A280 and A260/A230 purity ratios were also obtained. Theabsorption spectrum between 220 nm and 350 nm was also obtained toanalyze the presence of DNA contaminants.Qubit 1.0 fluorometerTwelve samples were measured by fluorometry using the Qubit1.0 device (Thermo Fisher Scientific Inc., Massachusetts, EEUU) andQubit dsDNA BR Assay kit (Thermo Fisher Sientific Inc., Cat. No.Q32850), for DNA sample concentrations between 100 pg/µl and 1 µg/µl, or Qubit RNA HS Assay Kit (Thermo Fisher Scientific Inc.; Cat.No. Q32852), for RNA sample concentrations between 250 pg/µl and250 ng/µl. 5 µl of each sample was used, following the manufacturer’sinstructions. Three readings were taken per sample and the averagevalue was calculated. DNA yield was estimated by means of the elutionvolume.qPCR quantification assayGenomic DNA Quantification Assay (Primerdesign Ltd.; Cat.No. gDNA-hu-q-DD) and PrecisionPlus 2 qPCR MasterMix(Primedesing Ltd.; Cat. No. Mini-PrecisionPLUS) were used in aLightCycler 96 thermocycler (Hoffmann-La Roche, Ltd., Basilea,Switzerland) following the manufacturer’s instructions to estimatethe DNA concentration. The kit provides specific primers for theamplification of a 156 bp single copy region of non-transcribed DNA.A standard curve was generated using the positive control providedby the kit and a negative control reaction was included to discard thepresence of contamination, following the manufacturer’s instructions.25 ng of DNA was used per reaction, considering the fluorometricconcentration, in a 15 µl final volume.SPUD assayA quantitative PCR assay for the detection of PCR inhibitors innucleic acid preparations (SPUD assay) [14] was performed in the 12DNA samples selected. An artificially synthesized 101 bp templatebased on the Solanum tuberosum phyB gene fragment, a specificpair of primers (Sigma-Aldrich Co. LLC., Missouri, EEUU) for theamplification of this fragment and 50 ng of DNA, considering thespectrophotometric measure, were added to the 25 µl reaction volume.Volume 9 Issue 1 1000344
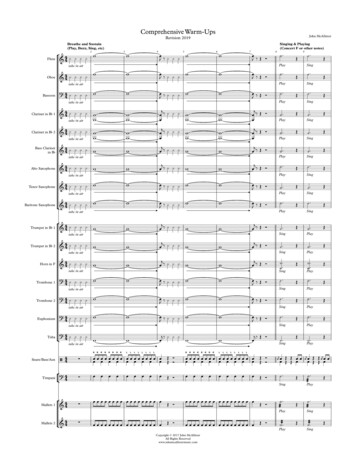
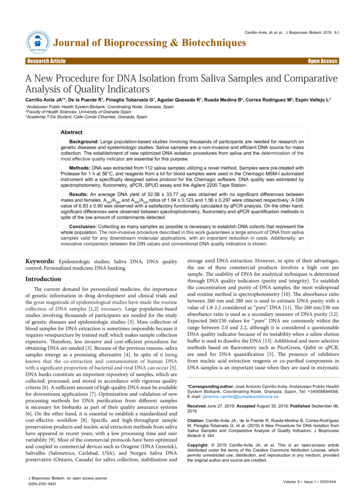
Citation: Carrillo-Avila JA., de la Puente R, Rueda-Medina B, Correa-Rodríguez M, Pinaglia-Tobaruela G. et al. (2019) A New Procedure for DNAIsolation from Saliva Samples and Comparative Analysis of Quality Indicators. J Bioprocess Biotech 9: 344.Page 3 of 6KiCqStart SYBR green qPCR Ready Mix (Sigma-Aldrich Co. LLC.;Cat. No. KCQS00) and LightCycler 96 (Hoffmann-La Roche Ltd.)instrument were used. A negative control was included with UltrapureDNAse/Rnase-free distilled water (Thermo Fisher Scientific Inc.; Cat.No. 10977-035) instead of DNA.DNA integrity and functionality 2200 TapeStation SoftwareMicrofluidic DNA electrophoresis in the 2200 TapeStation(Agilent Technologies Ind., California, EEUU) was performed withthe Genomic DNA ScreenTape (Agilent Technologies Inc.; Cat No.5067-5365) and Genomic DNA Reagents (Agilent Technologies Ind.;Cat No. 5067-5366) for the 112 DNA samples. For integrity estimation,the TapeStation software calculated the DNA Integrity Number (DIN),with values between 1 and 10, considering 1 as highly degraded DNAand 10 as DNA without degradation. Concentration values were alsoobtained.PCR amplificationThirty randomly selected DNA samples were amplified by realtime PCR in a Roche Light Cycler 96 Instrument for the GAPDH, AF4and ZFX genes. PCR products of 87, 400 and 1137bp were obtainedrespectively. 5 ng of DNA from each sample was employed in 20 µlamplification reactions containing 10 µl of FastStart Essential DNAGreen Master (Hoffmann-La Roche, Ltd., Basilea, Switzerland, cat n 06402712001) and 0.4 mM GAPDH, 0.4 mM AF4 or 0.8 mM ZFXprimers as described previously [6]. A PCR program with an initialdenaturation step of 10’ 95 C, and 40 cycles at 95 C for 20’’, 60 C for20’’ and 72 C for 20’’ was used. A melting curve was added to check theabsence of unspecific amplification.Statistical analysisThe SPSS Statistic (IBM, NY, EEUU) program was used for statisticalanalysis. Descriptive statistics module was used for the analysis of themean and standard deviation. Histograms were constructed, in orderto observe the shape of the distributions involved in the study. Giventhe size of the populations analyzed, the normality of the variableswas studied with the Kolmogorof-Smirnov test for women, and withthe Shapiro-Wild test in the case of men. It was concluded that thevariables did not present a normal distribution, so the non-parametricMann-Whitney-Wilcoxon test was applied to study the existence ofsignificant differences for the variables between males and females.ResultsYields and quality after DNA extraction from salivaWhen DNA was isolated from the 112 saliva samples, a highvariability of DNA yields was obtained with an average of 52.58 33.77µg (Figure 1a), although it was not affected by gender as no significantdifferences were found between males (51.22 37.42) and females(54.78 32.58). Consistently, DNA concentration was 133.6 83.74ng/µl and high enough for downstream applications. DNA purity wasestimated by spectrophotometry with the Infinite F200. An optimumA260/A280 ratio of 1.84 0.123 was observed (Figure 1b). In addition,a high A260/A230 ratio of 1.56 0.297 was obtained (Figure 1c). A DINvalue of 6.83 0.90 was observed when we examined the DNA integrityby 2200 TapeStation (Figure 1d). No statistically significant differenceswere obtained between males, 6.97 0.93, and females 6.8 0.91 (p Figure 1: Histograms shown yields (µg) calculated from spectrophotometric measures with the Infinite F200 (a) A260/A280 (b), A260/A230 (c) and DIN values (d) purity ratiosobtained for the 112 DNA samples isolated. Average, standard deviation and normal curve are indicated in the plots.J Bioprocess Biotech, an open access journalISSN:2155-9821Volume 9 Issue 1 1000344
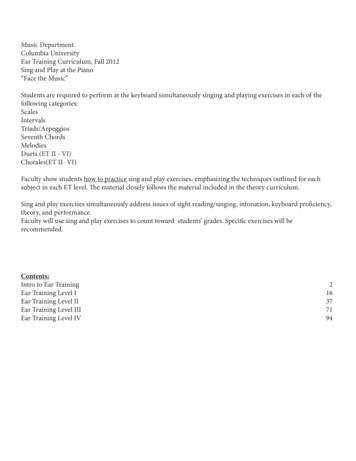
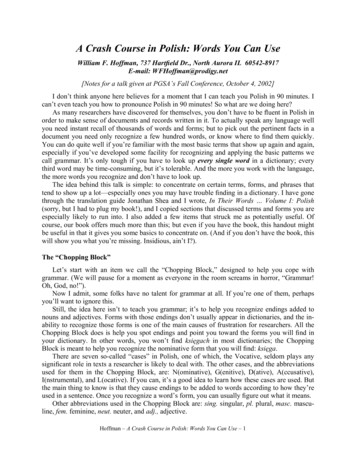
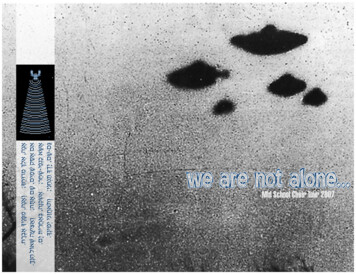
Citation: Carrillo-Avila JA., de la Puente R, Rueda-Medina B, Correa-Rodríguez M, Pinaglia-Tobaruela G. et al. (2019) A New Procedure for DNAIsolation from Saliva Samples and Comparative Analysis of Quality Indicators. J Bioprocess Biotech 9: 344.Page 4 of 60,05). Representative samples for a range of DIN values can be seen inFigure 2. The purified DNA functionality was checked in 30 randomlyselected samples by real time PCR amplification of three differentsizes of PCR fragments GAPDH, AF4 and ZFX (87, 400 and 1137 bprespectively). Amplification of all three fragments was obtained for allthe samples, except for one sample which failed to amplify ZFX gene.Average Cq values of 19.2, 20.5 and 31.5 were obtained for GAPDH,AF4 and ZFX genes respectively (Figure 3).Comparison of DNA quality methodsIn order to check the reliability of previous spectrophotometricmeasures, DNA purity and concentration were determined by differentmethods for a group of 12 randomly selected samples. Results areshown in Table 1 and Figure 4. Concentration and yield calculated fromA260 absorbance, and A260/A280 and A260/A230 purity ratios, were similarfor both the Nanodrop OneC and Infinite F200 spectrophotometers,in spite of the severe and concentration dependent A260/A230 nmfluctuation (Figure 4). Absorption spectra obtained with theNanodrop OneC instrument showed a single well defined absorptionpeak at 260 nm, with a higher signal for the most concentrated samples[1,3,7,11,12]. Regarding concentration and yield obtained by usingthe Qubit 1.0 fluorometer and qPCR quantification assay, these valueswere quite similar, while higher values were obtained with the 2200TapeStation (Table 1). However, all of them were considerably lowerin comparison with the spectrophotometric results on the other hand,RNA presence was quantified by fluorometry (Qubit 1.0), with verylow contamination detected, ranging from 1 to 15.1 ng/µl (4.46 4.03ng/µl) (Figure 4). When the detection of inhibitors was checked forthe DNA samples by SPUD assay, less than one Cq of difference wasobtained in relation to the negative control, with a slight displacementof the amplification curve, except for 2 samples (S11 and S12) whichshowed some minimal inhibition (Figure 5).Figure 3: Diagram of Cq values for GAPDH, AF4 and ZFX genes. Box-plots ofthe data have been represented; Mean is indicated with “ ” sign. The box withhorizontal black line shows the first and third quartiles and the median. Thewhiskers show 1,5 times the interquartile range and the points show outliers.Outliers are indicated.VariablesConcentration (Ng/µl)Yield (µg)Infinite F20080.13 59.5124.04 17.85Nanodrop Onec80.58 62.6424.17 18.79Qubit 1.030.88 29.829.26 8.952200 Tape Station44.85 30.3313.45 9.1Qpcr32.6 6.429.78 1.93Table 1: Average and standard deviation for concentration and yield valuesobtained in the 12 analysed samples with the Infinite F200, Nanodrop One C, Qubit1.0 fluorometer, 2200 Tape Station and qPCR.DiscussionTraditionally blood samples have been used as a source of nucleicacids for research. However, the invasive nature of this type of samplehas led to the search for alternative fluids such as saliva for guaranteeinga high participation of subjects in large-scale studies [20]. Saliva is aimportant source of nucleic acids for molecular diagnostic techniquesFigure 4: Concentration and purity results from 12 selected samples with thedifferent tested methods. Error bars are indicated when multiple measurementswere performed.Figure 2: Representative smears for DNA samples ranged from 4.1 to 8.5 DINvalues.J Bioprocess Biotech, an open access journalISSN:2155-9821Figure 5: SPUD assay Cq results for 12 analyzed samples (S1-S12). SPUDnegative control curve is indicated.Volume 9 Issue 1 1000344
Citation: Carrillo-Avila JA., de la Puente R, Rueda-Medina B, Correa-Rodríguez M, Pinaglia-Tobaruela G. et al. (2019) A New Procedure for DNAIsolation from Saliva Samples and Comparative Analysis of Quality Indicators. J Bioprocess Biotech 9: 344.Page 5 of 6[3]. Otherwise, the pre-analytic management of specimens is a crucialstep for downstream performance. It has been described that differentextraction methods, as well as quantification and quality measurementmethods used, can have an impact on the quality of the samples and theinformation derived from them, and therefore how they can be usedlater [8]. Commercial collection methods for saliva are usually used.In this work, an “in house” procedure has been implemented for DNAextraction from directly cryopreserved saliva by using a specific andcommonly used kit for DNA extraction from blood. A high yield wasobtained (52.58 33.77 µg) according to previous studies performedwith the saliva stabilization Oragene kit. So, a yield of 20.6 3.52 µgwas observed in male children and 17.1 2.51 µg in females [20], whileother authors described a yield of 10.8 µg (0.9 - 64.2 µg) [3] and 24µg (0.2-52 µg) [15], or even, higher yields (154.9 103.05) [21]. Inthe same sense, a high variability was obtained in our DNA yields,probably associated with the number of cells in saliva samples becauseof epithelial peeling, usually linked with the age and alterations anddiseases of the oral mucosa [20]. When large-scale molecular studiesare performed, it is essential to optimize not only collection andquantity but also quality of DNA in a time and cost-effective procedurefor downstream applications [22]. In this work, purity values of 1.84 0.12 and 1.56 0.30 were observed for A260/A280 and A260/A230 ratiosrespectively. Similar results have been obtained in our lab with salivasamples collected with Oragene kit and processed with ChemagicMSMI robot using Chemagic DNA saliva kit Special (PerkinElmer,Inc) [6]. However, A260/A280 ratios of 1.63 (1.13 – 1.88) and 1.74 0.07,and A260/A230 ratios of 0.80 (0.36–1.33) and 1.12 0.2, were reportedinspite of using Oragene kit [3,21]. A comparison of DNA qualificationmethods has also been presented in this manuscript in order tocheck the reliability and utility of spectrophotometric measures inthe frame of a standard procedure. Coincident results were obtainedfor concentration and purity values with both the Infinite F200 andNanodrop OneC spectrophotometric instruments. Also, similarconcentration and yield results were obtained between Qubit 1.0and qPCR, although considerably lower than for spectrophotometry.Finally, intermediate results were observed with the 2200 TapeStation.In relation to these results, contradictory conclusions have beenachieved by different authors. Consistent measurements betweenNanodrop and Qubit have been shown [23], while other authorsconcluded that spectrophotometry was the most precise methodcompared with fluorometry (Picogreen) and qPCR assays [5]. Onthe other hand and according to our results, additional works haveshown that spectrophotometry overestimates DNA concentration[24,25] specifically when compared with densitometric analysis fromagarose gel [8], and concordance between Qubit and qPCR results[8]. Fluorometry was much less influenced by contamination fromproteins, salts, and RNA [5], while spectrophotometric measurementsare affected by RNA traces [8,26]. On the contrary, spectrophotometryis not affected by DNA fragmentation [27], while fluorometry onlydetects dsDNA, but not ssDNA, degraded DNA or single nucleotides[28]. Because of this, similar spectrophotometric and fluorometricconcentrations are obtained when high integrity DNA is present[6]. In this study, differences were not explained because of RNAcontamination since a minimal presence of RNA in DNA samples wasobserved by Qubit 1.0. However, a certain degree of fragmentation inthe DNA samples was revealed by the DIN values in spite of it havingno remarkable impact on the amplification by real-time PCR of 3different sizes gene targets (GAPDH, AF4 and ZFX). Fluorometry ismore accurate based on our results as it is also supported by qPCRresults which detect high molecular weight DNA in a selective way,due to no amplification of non-human DNA from contaminatingJ Bioprocess Biotech, an open access journalISSN:2155-9821sources, as for example, bacterial and viral DNA highly represented insaliva samples [5]. DNA template quality is one of the most importantdeterminants for DNA amplification and assay reproducibility [14].High failure rates of PCR analyses can be explained by the variabilityin DNA quantity and quality [20,29]. A high amplification success hasbeen obtained previously by other authors with the Oragene saliva kit[30]. We performed the SPUD assay to check the absence of inhibitorsafter DNA isolation with the procedure proposed, with minimalPCR inhibition observed. Traditionally DNA integrity has not beenobjectively tested, and usually agarose gel has been used for integritychecking. In this manuscript, DNA integrity has been analysed by the2200 Tape Station instrument in terms of DIN values and an innovativecomparison between the DIN values and conventional DNA qualityindicators is shown. It is highly recommended to perform a qualitycontrol of the input material, especially for expensive workflows suchas NGS, as it saves time, effort and sample preparation overheadsinvested in low quality samples [22,31,32]. It has been establishedthat samples with DIN 7 are acceptable to progress into the next stepof library construction [17]. A DIN value of 6.84 0.952 has beenobtained in this study, and 35.7% of samples showed DIN 7. Partialsaliva DNA degradation has been observed previously in our lab usingOragene kit and processing samples with Chemagic MSMI robot usingChemagic DNA saliva kit Special (PerkinElmer, Inc) [6]. Collecting asmany samples as possible is mandatory to establish DNA cohorts thatrepresent the whole population and cover the genetic variants existingfor different pathologies, in this way giving consistency to the studiescarried out. The development of a non-invasive methodology with amoderate cost is a very useful tool for this purpose.ConclusionThe procedure described in this manuscript guarantees a highamount of DNA from saliva samples valid for any downstreammolecular application, with an important reduction in costs. Inthis sense, the rough cost per extraction is set at 12 euros, while thecosts are 29.5 euros with the Oragene kit. The integrity analysis (DINvalue) supposes additional information relevant to the conventionalDNA quality indicators. The main drawback of our procedure is thatthe saliva samples must be immediately frozen once collected untilprocessing, while the Oragene kit allows keeping the sample at roomtemperature for up to 5 years.AcknowledgementsThis work was supported by Andalussian Regional Government’s MinistryProject number PI-0414-2014), funds from Consejería de Salud - Junta deAndalucía, and Instituto de Salud Carlos III (PT13/0001/0040 - PT13/0010/0050,both co-financed by FEDER).References1. Franc MA, Warner AW, Cohen N, Shaw PM (2011) Current practices for DNAsample collection and storage in the pharmaceutical industry and potentialareas for harmonization perspective of the IPWG. Clin Pharmacol Ther 89:546-553.2. James G, McMullin MF, Duncombe AS, Clarke M (2017) The MOSAICC study:Assessing feasibility for biological sample collection in epidemiology studiesand comparison of DNA yields from saliva and whole blood samples. Ann HumGenet 82: 114-118.3. Hansen TV, Simonsen MK, Nielsen FC (2007) Collection of blood, saliva, andbuccal cell samples in a pilot study on the Danish nurse cohort: comparison ofthe response rate and quality of genomic DNA. Cancer Epidemiol BiomarkersPrev 16: 2072-2076.4. Lee YH, Wong DT (2009) Saliva: an emerging biofluid for early detection ofdiseases. Am J Dent 22: 241-248.Volume 9 Issue 1 1000344
Citation: Carrillo-Avila JA., de la Puente R, Rueda-Medina B, Correa-Rodríguez M, Pinaglia-Tobaruela G. et al. (2019) A New Procedure for DNAIsolation from Saliva Samples and Comparative Analysis of Quality Indicators. J Bioprocess Biotech 9: 344.Page 6 of 65. Haque KA, Pfeiffer RM, Beerman MB (2003) Performance of high-throughputDNA quantification methods. BMC Biotechnol 3: 20.6. Lucena AG, SanchezLopez AM, Barberan AC (2016) DNA source selection fordownstream applications based on DNA quality indicators analysis. BiopreservBiobank 14: 264-270.7. Mathay C, Hamot G, Henry E (2016) Method validation for extraction of nucleicacids from peripheral whole blood. Biopreserv Biobank 14: 520-529.8. Simbolo M, Gottardi M, Corbo V (2013) DNA qualification workflow for nextgeneration sequencing of histopathological samples. PLoS One 8: e62692.9. Tan SC, Yiap BC (2009) DNA, RNA, and protein extraction: the past and thepresent. J Biomed Biotechnol 2009: 574398.10. Glasel JA (1995) Validity of nucleic acid purities monitored by 260 nm/280 nmabsorbance ratios. BioTechniques 18: 62-63.11. Manchester
Qubit 1.0 fluorometer Twelve samples were measured by fluorometry using the Qubit 1.0 device (Thermo Fisher Scientific Inc., Massachusetts, EEUU) and Qubit dsDNA BR Assay kit (Thermo Fisher Sientific Inc., Cat. No. Q32850), for DNA sample concentrations between 100 pg/µl and 1 µg/ µl, or Qubit RNA HS Assay Kit (Thermo Fisher Scientific Inc .