Transcription
August 18, 2005SUBJECT:Residual Risk Assessment for the Industrial Process Cooling Towers SourceCategoryFROM:Maria Pimentel and Scott JenkinsRisk and Exposure Assessment Group, OAQPS (C404-01)TO:David E. Guinnup, Group LeaderRisk and Exposure Assessment Group, OAQPS (C404-01)IntroductionSection 112(f)(2)(A) of the Clean Air Act directs EPA to assess the risk remaining(residual risk) after the implementation of maximum achievable control technology (MACT)standards under section 112(d) of the Act. Under these requirements, EPA will promulgateadditional emission standards for a source category if existing MACT standards do not providean “ample margin of safety” for human health or are not sufficient to prevent adverseenvironmental impacts. The residual risk assessment is performed by EPA as part of the residualrisk rule development process, which is generally completed within eight years of thepromulgation of MACT standards.The purpose of this memorandum is to describe the methodology and results of theresidual risk assessment performed for the Industrial Process Cooling Towers (IPCT) sourcecategory. The results of this analysis will assist EPA in determining whether a residual risk rulefor this source category is appropriate.MethodsScopeThe residual risk assessment for the IPCT source category focused on human health,evaluating the potential of emissions to cause cancer and noncancer risks associated with alifetime of continuous exposure via the inhalation pathway. An assessment of the potential forpublic health impacts associated with acute inhalation exposures to peak hourly emissions wasalso performed using a hypothetical one-hour exposure scenario.
In air toxics risk assessment, the inhalation pathway is commonly assessed. However,multipathway exposures (human contact with the chemical in soil, water, sediment, or food) andecological exposure pathways may also be assessed for a limited set of chemicals released to theair. The EPA has identified a set of persistent and bioaccumulative (PB) hazardous airpollutant(s) (HAP) for which multipathway health and ecological exposure analyses shouldgenerally be conducted. This list of PB HAP is based on information from the PollutionPrevention Program, the Great Waters program, and the Toxics Release Inventory. Refer toVolume I, Section 4.2.5, of the Air Toxics Risk Assessment Reference Library (available at:http://www.epa.gov/ttn/fera/risk atoxic.html) for more information on the list of PB HAP.Since there are no emissions of PB HAP from IPCTs, we believe the potential for adverseecological impacts and the potential for risks from exposure pathways other than air areinsignificant for this source category.Source Category CharacterizationThe IPCT NESHAP banned the use of chromium water treatment chemicals in IPCTsystems. When the NESHAP was promulgated in September 1994, six industries usedchromium water treatment chemicals: petroleum refining, chemical manufacturing, primarymetals processing, tobacco products manufacturing, tire and rubber products manufacturing,textiles finishing, and glass manufacturing. At that time, most facilities in these industriesoperated between two and six IPCTs, and EPA estimated that these six industries operatedapproximately 8,100 IPCTs in total. The industries with the greatest demands for industrialcooling are the petroleum refining and chemical manufacturing industries. Some petroleumrefineries operate 20 to 25 IPCTs. The largest chemical manufacturing plants operate an evenlarger number of IPCTs.While chromium water treatment chemicals are no longer used, other chemicals whicheither contain or form HAP are often added to industrial water cooling systems to preventcorrosion, scaling, fouling, and to limit the growth of microorganisms.1 These HAP may beemitted from any IPCT that serves the cooling water system. Based on a literature review andinformation from water treatment chemical suppliers, three HAP, methanol, ethylene thiourea,and chloroform, can be emitted depending on the types of water treatment chemicals uses.However, it is unlikely that more than one of these HAP would be emitted from a cooling watersystem at a time, since each is the product of a different water treatment chemical, and thesechemicals are not likely to be used together.2 Chlorine emissions from IPCTs would only beexpected to occur under relatively acidic conditions (i.e., cooling water pH of 4.0 or less).Because current cooling water treatment programs operate under alkaline conditions, chlorineemissions from IPCTs are unlikely. For this reason, emissions of chlorine are not evaluated inthis assessment.1Estimated Worst-Case HAP Emissions for IPCTs. Memorandum to PhilMulrine,EPA/OAQPS/ESD/MG, from Richard Marinshaw, RTI. August 20, 2004, revised November 8, 2004.2
Gulf Oil Products Company, in Port Arthur, Texas, was identified as the highest-emitting facilityfor the IPCT source category, based on total IPCT recirculation flow, which is directlyproportional to emission rates. This facility has 19 IPCTs and the highest total emissions for thesource category.2 The facility with the second highest emissions is Dow Chemical Company inFreeport, Texas.3 Since more information was available for the Dow facility, including thelocation coordinates for all 56 of the facility’s IPCTs, it was chosen for modeling in this residualrisk assessment. The impact of this facility selection on the assessment results is furtherdiscussed in the uncertainty section of this document.Emissions DataWorst-case emissions were calculated for the IPCTs at Dow by assuming that all threeHAP are emitted from each IPCT, an unlikely occurrence. Individual IPCT recirculation ratesfrom information collection request (ICR) responses were received during development of theMACT. Estimated HAP concentrations in cooling water were obtained from a review of theliterature and conversations with water treatment chemical suppliers. The estimated HAPemissions can be found in Appendix A. More information about the method used to estimate theHAP emissions can be found in references 1, 2, and 3. A total of 0.321 Mg/yr (0.01 g/s) ofmethanol, 0.803 Mg/yr (0.03 g/s) of ethylene thiourea, and 2.36 Mg/yr (0.07 g/s) of chloroformwas estimated to be emitted from all the IPCTs at Dow.IPCT heights were also obtained from the ICR responses. Emissions exit velocities, exittemperatures, and stack diameters were not provided in the ICR responses. However, a modelplant was created during the development of the IPCT MACT which did contain an exit velocity(8.83 m/s) and exit temperature (305.37 K).4 These parameters were used for all the IPCTs atDow for this analysis. No diameter was provided in the ICR data or developed for the modelplant IPCTs, so a default was created using the average of reported values for IPCTs atpetroleum refineries in the final 1999 National Emissions Inventory (NEI), (3.261 m). TheIPCT-specific emissions and modeling parameters used for this assessment are summarized inAppendix A.Selection of HAP and Dose-Response Information2Letter and attachments from W.E. Dunn, Gulf Oil Products Company, to J.Farmer, EPA/ESD. May 21,1985. Response to Section 114 Information Collection Request for the Port Arthur, Texas facility.3Letter and attachment from R.S. Rose, Dow Chemical U.S.A., to B.Nicholson, Midwest ResearchInstitute. May 6, 1988. Recirculation rates and locations for IPCTs at the Freeport, Texas facility.4Chromium Emissions from Industrial Process Cooling Towers - Background Information for ProposedStandards, U.S. Environmental Protection Agency, Research Triangle Park, NC. September 1992.3
The list of HAP emitted from IPCTs and considered in this assessment, along with theirrespective cancer and chronic non-cancer dose-response values, are presented in Table 1. Thedose-response values used for this assessment of risks from chronic exposure are available onEPA’s air toxics website at http://www.epa.gov/ttn/atw/toxsource/summary.html . Toxicityprofiles for the three HAP were obtained from EPA’s air toxics website athttp://www.epa.gov/ttn/atw/hapindex.html and are provided in Appendix B.Acute non-cancer dose-response assessment values from several sources are presented inTable 2. Because EPA has not defined a prioritization scheme for the use of these acute doseresponse values in the assessment of air toxics (due largely to the differing contexts of theirdevelopment), the predicted short-term exposure concentrations are compared to all of theavailable values for the HAP of interest. Further information on the acute reference valuespresented in Table 2 can be found on the EPA’s air toxics website cited above.Table 1. Chronic Cancer and Non-cancer Dose Response Values Used in This AssessmentHAPbWOE forUREaCancer(1/(µg/m3))Source of UREToxicity ValueRfC or similar Source of RfC ToxicitycValuevalue (mg/m3)Chloroform dB22.3x10-5IRIS0.098Agency for ToxicSubstances and aEnvironmentalProtection Agency0.003California EnvironmentalProtection AgencyMethanol----NA4California EnvironmentalProtection AgencyNotes:Source: EPA’s air toxics website at http://www.epa.gov/ttn/atw/toxsource/summary.html . Accessed October 2004. A dash (–)indicates either no available weight-of-evidence conclusion on potential human carcinogenicity, or there was no adequatequantitative potency estimate for a particular HAP; thus, the HAP was not considered in the quantitative risk analysis forcarcinogenic effects.aWeight of evidence (WOE). B2 Probable human carcinogen based on sufficient evidence in animals and inadequate or noevidence in humans.bUnit risk estimate (URE): The upper-bound excess lifetime cancer risk estimated to result from continuous exposure to anagent at a concentration of 1 µg/m3 in air. The interpretation of unit risk would be as follows: if URE 1.5x10⁻⁶ µg/m3, up to1.5 additional people are expected to develop cancer in their lifetime per 1,000,000 people exposed continuously for a lifetimeto 1 µg of the chemical per 1 m3 of air. “Upper-bound” in this context is defined as a plausible upper limit to the trueprobability. An appropriate interpretation of upper-bound unit risk estimates is that the true value is probably less, and probablynot greater.cReference Concentration (RfC): An estimate (with uncertainty spanning perhaps an order of magnitude) of a continuousinhalation exposure to the human population (including sensitive subgroups) that is likely to be without an appreciable risk ofdeleterious effects during a lifetime.dEven though the OAQPS website does not include a cancer URE for chloroform, we used the current IRIS value for thisassessment as a health-protective screen, since the IRIS value is, in the judgment of OAPQS, an extremely conservative valuewhich likely overestimates cancer risks by a significant amount.4
Table 2. Acute Non-cancer Dose-Response Values Used in This AssessmentAcute Dose-Response Values ourea----Methanol6902,700ERPG-1b ---2601,300790--28Notes: Source: EPA’s air toxics website at http://www.epa.gov/ttn/atw/toxsource/summary.html . Accessed October 2004. Adash (–) indicates that no acute dose-response value of that type was defined for that HAP. No acute dose-response values wereidentified for ethylene thiourea; therefore, this HAP was not included in the acute exposure and risk assessment.aAcute Exposure Guideline Levels (AEGL), developed by EPA’s National Advisory Committee for Acute Exposure GuidelineLevels for Hazardous Substances. The values are available through EPA’s Office of Pollution Prevention and Pesticides andToxic Substances website at http://www.epa.gov/oppt/aegl/chemlist.htm. The AEGL values shown in Table 2 are per a 60minute exposure time and were converted from ppm to mg/m3. AEGL-1 is the airborne concentration of a substance at or abovewhich it is predicted that the general population, including susceptible'' but excluding hypersusceptible'' individuals, couldexperience notable discomfort. Airborne concentrations below AEGL-1 represent exposure levels that could produce mild odor,taste, or other sensory irritations. An AEGL-2 value is the airborne concentration of a substance at or above which it ispredicted that the general population, including susceptible'' but excluding hypersusceptible'' individuals, could experienceirreversible or other serious, long-lasting effects or impaired ability to escape. Airborne concentrations below the AEGL-2 but ator above AEGL-1 represent exposure levels that may cause notable discomfort.bEmergency Response Planning Guidelines (ERPGs) have been developed by the American Industrial Hygiene Association.ERPG–1 is the maximum airborne concentration below which it is believed nearly all individuals could be exposed for up toone hour without experiencing other than mild transient adverse health effects or perceiving a clearly defined objectionableodor. An ERPG-2 is the maximum airborne concentration below which it is believed nearly all individuals could be exposed forup to one hour without experiencing or developing irreversible or other serious health effects or symptoms that could impair anindividual's ability to take protective action.cImmediately Dangerous to Life or Health air concentration values (IDLHs) have been developed by the National Institute forOccupational Safety and Health (NIOSH). IDLHs are exposure concentrations that are likely to cause death or immediate ordelayed permanent adverse health effects or that may prevent escape from such an environment. The IDLH values in Table 2have been divided by a factor of 10, making them roughly comparable to mild-effect level benchmarks.dMinimum Risk Levels (MRLs) have been developed by the Agency for Toxic Substances and Disease Registry (ATSDR) andthe EPA for substances likely to be found at facilities on the Comprehensive Environmental Response, Compensation, andLiability Act (CERCLA) National Priorities List. MRLs are exposure concentrations set below levels that, based on currentinformation, might cause adverse health effects in the people most sensitive to such substance-induced effects.eReference Exposure Levels (RELs) have been developed by California’s Office of Environmental Health Hazard Assessment.RELs represent the concentration level at or below which no adverse health effects are anticipated for a specified exposureduration and are designed to protect the most sensitive individuals in the population by the inclusion of margins of safety.5
Dispersion Modeling for Human Inhalation ExposuresModeling was performed for both chronic and acute exposures. The methodology foreach exposure scenario is explained in the sections below.Chronic exposure modelingThe EPA’s Industrial Source Complex - Short Term Version 3 (ISCST3) model was usedfor the assessment of chronic exposures. Information about ISCST3 is available from EPA athttp://www.epa.gov/scram001/tt22.htm#isc .The ISCST3 air dispersion model is a steady-state Gaussian plume model that can beused to assess pollutant concentrations from a wide variety of sources associated with anindustrial complex. For this assessment, ISCST3 was used to estimate the average annualambient concentration at locations near the facility specified by the use of a polar grid. Thelocation with the highest annual average concentration of HAP was used to estimate themaximum lifetime individual cancer risk and chronic non-cancer hazard index (HI) for thefacility.Necessary source-related inputs for ISCST3 included emission rate, release point locationcoordinates, height of emissions release, emissions exit velocity, stack inside diameter, andemissions exit temperature. These inputs can be found in Appendix A. Other parameters andsettings (e.g., urban or rural setting, downwash-related parameters) must also be specified for themodeled source. The land use surrounding the facility was assumed to be rural, and the terrainwas assumed to be flat. Building downwash, particle deposition, and plume depletion were notconsidered. In this assessment, the regulatory default options were selected, as defined in theUser’s Guide for the Industrial Source Complex Models.5 ISCST3 also requires the input ofmeteorological data for the area and information specifying receptor location. Five years ofmeteorological data were used, 1991-1995, with surface meteorological data from Galveston,Texas and upper air meteorological data from Corpus Christi, Texas. The polar grid receptoroption was chosen, with receptors placed every 10 at 100, 200, 400, 800, 1,500, 2,500, 5,000,10,000, 25,000 and 50,000 meters. ISCST3 uses all of this information to determine HAPconcentrations at the specified receptors.Because ISCST3 is designed to model one pollutant at a time, and there are multiple HAPemitted from IPCTs, a unit emission rate of 1 g/s was input to the ISCST3 model. Since therelationship between the emission rate and the resulting ground-level concentration is linear, theunit emission rate results could be applied to all three HAP. Risks were estimated bydetermining the location with the overall highest concentration (maximally impacted receptor) inthe model output, and protectively assuming that the receptor population resided there. The5User’s Guide for the Industrial Source Complex (ISC3) Dispersion Models. U.S. EPA, OAQPS/EMAD,Research Triangle Park, NC 27711. EPA-454/B-95-003a. September 1995. Available on-line .pdf.6
contribution from each IPCT to the concentration at the maximally impacted receptor wasdetermined from the ISCST3 output. These unit-emission-rate concentrations were multiplied bythe HAP-specific emission rates for each IPCT to obtain HAP-specific concentrations percooling tower at the maximally impacted receptor. These concentrations were then multiplied bythe URE or divided by the RfC (see table 1) for each HAP to arrive at noncancer hazard quotientand cancer risk estimates per chemical per cooling tower. The hazard quotients and cancer riskswere summed across cooling towers and across HAP to arrive at the total cancer risk andnoncancer hazard index from the facility. This calculation of risk is presented in Table C-1 ofAppendix C.Dispersion Modeling for Acute ExposuresThe EPA’s SCREEN3 model was used for the assessment of acute exposures.Information about SCREEN3 is available from EPA EEN3 is a screening-level, Gaussian dispersion model that can estimate the 1-hourmaximum ground-level concentration and the distance to that maximum concentration.6 Themodel contains a set of wind speed and atmospheric stability values that are used in combinationwith facility-specific release parameters to predict the maximum ambient concentration along thecenterline of a plume in the downwind direction.7 SCREEN3 calculates ambient concentrationsassuming worst-case meteorological conditions , no deposition or atmospheric reactions, and flatterrain. SCREEN3 does not incorporate population data, facility coordinates, or actual facilityboundaries. By using SCREEN3, a relatively large degree of conservatism is incorporated in themodeling procedure to provide reasonable assurance that maximum concentrations will not beunderestimated.8Inputs to the SCREEN 3 model include source-related inputs, including the emission rate,height of emissions release, emissions exit velocity, stack inside diameter, and emissions exittemperature. Other parameters include terrain height, building downwash, meteorology options,rural or urban setting, and receptor distances. Of these options, the flat terrain option wasselected because it was assumed that the terrain height did not exceed the stack-base height,building downwash was not considered, and the full meteorology option was selected, whichdirects SCREEN3 to examine all stability classes and wind speeds to identify the worst-casemeteorological conditions. The rural setting was chosen, and receptor distances were selected6SCREEN3 Model User’s Guide. U.S. EPA, OAQPS/EMAD, Research Triangle Park, NC 27711. EPA454/B-95-004. September 1995. Available on-line at: pdf7SCREEN3 Model User’s Guide. U.S. EPA, OAQPS/EMAD, Research Triangle Park, NC 27711. EPA454/B-95-004. September 1995. Available on-line at: pdf8Screening Procedures for Estimating the Air Quality Impact of Stationary Sources, U.S. EPA,OAQPS/EMAD, Research Triangle Park, NC 27711. EPA-454/R-92-019. 1992.7
using the automated distance array option, with a minimum distance for the array of 100 metersand maximum of 50,000 meters. In addition, the default ambient temperature (293 K) was used,no flagpole receptor was used, and fumigation calculations were not performed.The final risk estimates due to acute exposures were determined using the model outputsand several calculations. Because SCREEN3 is designed to model one pollutant at a time, andthere are multiple HAP emitted from IPCTs, a theoretical unit emission rate of 1 g/s was input tothe model. Since the relationship between the emission rate and the resulting receptorconcentration is linear, the unit-emission-rate concentrations were multiplied by the HAPspecific emissions for each IPCT to obtain HAP-specific concentrations from each. Based on thedesire to develop a conservative assessment of acute exposures, the HAP-specific hourlyemission rates used for the acute assessment were chosen to be 10 times the average hourlyemission rates used for the chronic assessment. The resultant predicted maximum concentrationsof each HAP were divided by the acute dose response values in table 2 (AEGL, ERPG,IDLH/10, MRL and REL) to arrive at acute hazard quotient values per chemical per IPCT. Theacute hazard quotients were summed per chemical. This calculation of acute hazard quotient ispresented in Table C-2 of Appendix C.Testing the new HEM-3 model for chronic and acute exposuresThe EPA has developed a new version of the Human Exposure Model (HEM-3), whichincorporates the ISCST3 dispersion model and also includes HAP dose response values,meteorological data, population data, and exposure algorithms to estimate risk from both chronicand acute exposures all in one package. As this model may be used by EPA in the future toperform risk assessments similar to this one for the IPCT source category, HEM-3 was tested inthis assessment for its ease of use and the similarity of risk results as compared with thosederived from ISCST3, combined with the necessary post-modeling calculations. For moreinformation about this model, the draft HEM-3 model and a User’s Guide are available throughthe Fate, Exposure and Risk Analysis website of EPA’s Technology Transfer Network athttp://www.epa.gov/ttn/fera/human hem.html. The same inputs described for the chronic andacute scenarios above were used in the execution of HEM-3.The concentration and risk outputs from the HEM-3 runs are displayed in Tables C-3 andC-4 of Appendix C.Results and DiscussionSummary of Chronic Risk Assessment ResultsThe upper-bound lifetime cancer risk and chronic hazard index (HI) associated with themaximally exposed receptor are summarized in Table 3. The cancer risks and chronic hazardindices presented in Table 3 represent the cumulative across all chemicals and all emissionrelease points. The upper-bound cancer risk estimated with ISCST3 was 4 x 10⁻⁷ and the hazardindex was 2 x 10⁻³. Table 3 also presents the risk results from HEM-3, which are identical.8
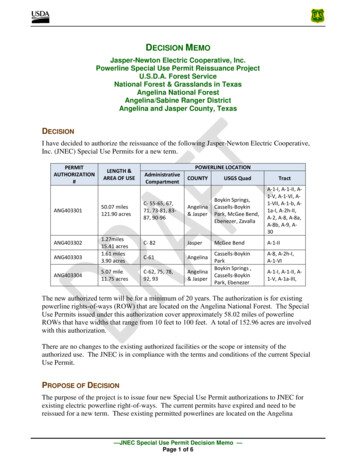
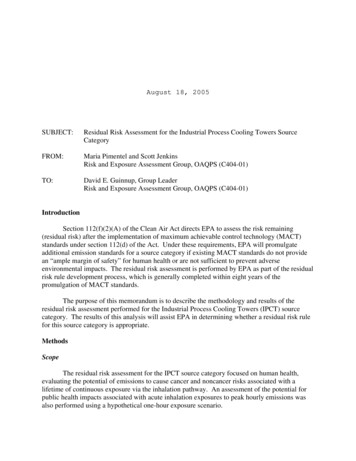
Table 3. Summary of Estimated Cancer and Chronic Hazard ValuesISCST3FacilityDow ChemicalHEM3MaximumCancer RiskaMaximumHazard IndexMaximumCancer RiskbMaximumHazard Index4 x 10-72 x 10-34 x 10-72 x 10-3aThis value includes cancer risks from chloroform. Chloroform does not have a URE in the EPA’s air toxics website summary table;however, the IRIS URE of 2.3x10⁻⁵ was considered in this estimate.bThis value also includes cancer risks from chloroform. The HEM3 model includes dose response values; however, these dose-responsevalues are based on the EPA air toxics website summary table, which does not include chloroform. Chloroform risks were calculated usingthe IRIS URE and included in this estimate for easy comparison with the ISCST3 results.The values in Table 3, as well as the risks presented by individual IPCTs to the maximallyexposed receptor are included in Tables C-1 and C-3 of Appendix C.Summary of Acute Risk Assessment ResultsThe one-hour ambient concentrations estimated by SCREEN3 were compared to acutenon-cancer dose-response values (presented in Table 2) for each of the HAP (with the exceptionof ethylene thiourea for which no acute dose-response values are available). The maximumexposure concentrations for chloroform and methanol were 4 x 10⁻³ mg/m3 and 5 x 10⁻⁴ mg/m3respectively. Charts were generated plotting the maximum exposure concentrations againstavailable acute dose-response concentration values (Figures 1 and 2). Note that theconcentration (on the y-axis) is plotted on a logarithmic scale to accommodate the wide range ofexposure concentrations and acute reference values. Table C-2 of Appendix C contains theacute risk calculations from SCREEN3.As shown in Figures 1 and 2, the maximum estimated one-hour HAP exposureconcentrations from SCREEN3 were below all available acute dose-response reference levels.9
1000AEGL-2ERPG-2IDLH/10Concentration (mg/m3)100Health 1Figure 1. Chloroform Acute Exposure Reference Levels andExposure Concentrations10
1000IDLH/10AEGL-1ERPG-1100Concentration (mg/m3)REL10Health gure 2. Methanol Acute Exposure Reference Levels andExposure ConcentrationsSummary of Human Health Multipathway and Ecological Assessment ResultsAs explained earlier in this document, due to their gaseous nature, lack of persistence inthe environment, and lack of tendency to bioaccumulate the, the HAP emitted from IPCTs arenot believed to pose any significant human multipathway or ecological risk.Qualitative Uncertainty Analysis11
This section summarizes some of the primary uncertainties associated with variouscomponents of this analysis, including the modeling data, the dispersion models as applied in thisassessment, and toxicity information.Emissions Data UncertaintiesAlthough the use of emission factors to estimate emissions from IPCT may overestimateor underestimate emissions at a specific facility, the emissions data used in this analysis werelikely overstated. This is because chloroform, methanol, and ethylene thiourea were all assumedto be emitted from each IPCT while only one of these three HAP would be expected to beemitted from an actual IPCT.The emissions for the IPCTs at Dow were calculated based on the recirculation rate andthe application of an emission factor. The use of an emission factor introduces uncertainty to themodeling exercise, since certain assumptions must be made in the development of the emissionfactor that may not accurately depict the volatilization of these chemicals from the IPCT in everyinstance. However, in the absence of monitored or measured emission values, this method isdeemed to provide a reasonable estimate.The source for the recirculation rate data was a 1988 letter from Dow to an EPAcontractor. Changes may have been made to the IPCTs or to the plant that have affected therecirculation rate, and IPCTs could have been added or taken off-line since then. However,IPCT technology has not changed greatly in this time, and it is estimated that currentrecirculation rates should remain similar to the rates from 1988. In addition, while the number ofIPCTs in operation may be changed, it is unlikely that the resulting change in emissions wouldsignificantly impact the risk estimates, given the low level of emissions from any individualIPCT.Model Plant UncertaintiesThe use of a model plant approach in this assessment introduces uncertainty, in that eachfacility is not examined on a site-specific basis. The modeling parameters for the model plant,including emissions, emission release parameters, meteorology, and the locations of emissionpoints relative to the location of receptors, are presumed to represent the conditions at allfacilities in the IPCT source category. This may or may not be the case and, therefore, representsa source of uncertainty. However, this uncertainty in our ability to extrapolate from the modelplant to other IPCTs was reduced, to the extent possible, by focusing on a very large facility inan area with resident populations nearby. Emissions were also increased to account for thedifferences in emission rates between the model plant and the highest emitting facility, asexplained further below. One facility was chosen to represent the IPCT source category in thisassessment. While the Dow Chemical Company facility in Freeport, Texas had the secondhighest emission rate from IPCTs, it was chosen over the highest emitting facility (Gulf OilProducts Company in Port Arthur, Texas). This selection was made based on the availability of12
emission point latitude/longitude coordinates, which were available for the Dow but not the Gulffacility. This left some uncertainty that the risks presented by the Dow facility were the highestthat would be expected from any source in the source category.To address this uncertainty, a maximum emission scenario was developed. In thisscenario, the Dow facility was treated as a “model plant” where the emission point locations andthe other emissions release characteristics were retained, but the emissions were increased acrossthe IPCTs proportionately to the level emitted overall by the Gulf facility. This amounted toincreasing the emissions of methanol, ethylene thiou
residual risk assessment performed for the Industrial Process Cooling Towers (IPCT) source category. The results of this analysis will assist EPA in determining whether a residual risk rule . 3Letter and attachment from R.S. Rose, Dow Chemical U.S.A., to B.Nicholson, Midwest Research Institute. May 6, 1988. Recirculation rates and lo cations .