Transcription
January 28, 2015A Discussion ofRetention andCompletion
AuthorsAbout the Minnesota Office of Higher EducationAlexandra DjurovichThe Minnesota Office of Higher Education is a cabinet-level stateagency providing students with financial aid programs and informationto help them gain access to postsecondary education. The agencyalso serves as the state’s clearinghouse for data, research andanalysis on postsecondary enrollment, financial aid, finance andtrends.Senior Data AnalystTel: h FergusManager Financial Aid ResearchTel: 651-259-3963meredith.fergus@state.mn.usMaren Gelle HendersonResearch InternTel: 651-259-3917maren.henderson@state.mn.usThomas SanfordFinance and Accountability ManagerTel: 651-259-3960thomas.sanford@state.mn.usNina SheffResearch InternTel: 651-259-3917nina.sheff@state.mn.usNichole SorensonResearch AnalystTel: 651-259-3919nichole.sorenson@state.mn.usShaun Williams-WycheResearch AnalystTel: 651-259-3967shaun.williams-wyche@state.mn.usThe Minnesota State Grant Program is the largest financial aidprogram administered by the Office of Higher Education, awarding upto 180 million in need-based grants to Minnesota residents attendingaccredited institutions in Minnesota. The agency oversees tuitionreciprocity programs, a student loan program, Minnesota’s 529College Savings Plan, licensing and early college awarenessprograms for youth.
Table of ContentsTable of Contents .1Taking Stock .3Postsecondary Access .6High School Graduation .6College Readiness .8College Participation .9Postsecondary Retention . 10Postsecondary Completion . 11Economic Consequences of Noncompletion . 14Maximizing the Returns to Education . 15What about Sub-Baccalaureate Certificates? . 18The Challenge . 21A Reinvigorated Social Compact . 22Student-Centered Strategies to Improve Minnesota’s Postsecondary Completion Rates . 231. Social and Campus Integration . 23Strategy: Expand high-impact support activities . 24Strategy: Expand available summer bridge programs for targeted students . 27Strategy: Develop cohort models of block scheduling for key groups . 29Strategy: Develop low cost, on-campus child care to accommodate student-parents. 292. Academic Policies that Promote Completion . 31Strategy: Implement intrusive advising . 31Strategy: Increase the number of professional advisors . 33Strategy: Implement opt-out scheduling and other alternatives based on degree mapping . 332.1 Developmental Education . 34Strategy: Appropriately structured developmental education . 342.2 Transfer Alignment . 36Strategy: Improve transfer alignment between institutions and make it easier to find which creditstransfer . 36Strategy: Further expand dual enrollment, PSEO and other related opportunities to earn credit whilein high school . 373. Alternative Pathways to Completion . 38Strategy: Expand prior learning assessment . 38Strategy: Develop competency-based degree programs . 39Strategy: Utilize alternative academic schedules . 39Strategy: Broaden alternative delivery models . 40Strategy: Expand apprenticeship and paid internship related to education programs . 414. Affordability . 42Minnesota’s Design for Shared Responsibility . 43Strategy: Expand investment in Minnesota's State Grant program . 44Strategy: Maximize resources available to students . 45Strategy: Design higher education policy to meet a set of agreed-upon goals . 46Strategy: Increase public and policymaker awareness of grant effectiveness to improve economic mobilityfor lower income students . 46Strategy: Continually evaluate outcomes . 46Conclusion . 47Appendix A . 48GUIDED PATHWAYS TO SUCCESS . 48Appendix B . 51The College Completion Gap . 51
2Minnesota Office of Higher Education
Taking StockThe purpose of this report is to identify best practices that stakeholders in postsecondary education canput in place to improve retention and completion rates at postsecondary institutions across Minnesota. Indoing so, this report will also identify existing barriers students face that potentially prevent them fromcompleting their education. This report recommends that all stakeholders in postsecondary educationmust share responsibility in order for retention and completion rates to see improvement across the state.At the heart of the social compact between states and the public is the belief that a postsecondaryeducation offers students the opportunity for social and economic mobility. This social compact hasalways been student-centric, with the goal of providing the state’s citizens with a pathway to asustainable wage, improved quality of life and the ability to constructively participate in Minnesota’scivic culture. Recognizing the transformational role higher education can play in its citizen’s lives, in1963 the Minnesota Legislature created the “35 mile rule,” which expanded the number of publicinstitutions in the state to ensure that every citizen would have access to a postsecondary institutionwithin 35 miles of their home. 1 As a result of the rule, Minnesota created more community colleges percapita than any other state over the next twenty years.In 1983, Minnesota created a new policy framework for allocating the state’s need-based grant funds. 2The policy framework, the Design for Shared Responsibility, specified each stakeholder’s responsibilityin financing a student’s postsecondary education (the student, their family and state and federaltaxpayers). A key tenant of the framework is the student’s ability to choose any higher educationinstitution within the state that best meets their needs and educational goals. Such policy reinforces astudent-centered financial aid framework which is cited as an exemplar for other states.Minnesota also adopted, around 1983, a state appropriations funding policy of providing at least 67percent of the combined tuition and fee and state appropriations revenue for both public systems ofhigher education. 3 The policy acknowledges both the state’s and the students’ role in fundingpostsecondary education. In fiscal year 2015, Minnesota fell short of its objective, funding only 43percent of the cost. To fully fund the policy, Minnesota would need approximately an additional 694million (or 1.4 billion over a biennium), a 57 percent increase, for fiscal year 2015. 4Recent research shows that when compared to states with similar characteristics, Minnesota funds itspublic postsecondary institutions at higher than expected levels. In their longitudinal study on factorsaffecting state appropriations over time, Weerts, Sanford and Reinert (2012) found that after accountingfor state and institutional factors, Minnesota has historically funded its postsecondary institutions at1Fine, K.K. (1993, January). A history of Minnesota higher education policy. A policy analysis. St. Paul, MN: MinnesotaHouse of Representatives.2Misukanis, M. (2008, October). Overview of the prior model: Minnesota State Grant review. Minnesota Office of HigherEducation.3Funding Policy, Minnesota Statutes, Section 135A.01, 2007.4Fiscal year 2015 state appropriations were 1.22 billion ( 600 million for the University of Minnesota [UMN] and 622million for the Minnesota State Colleges and Universities [MnSCU]). According to MnSCU’s and the UMN’s FY15operating budgets, tuition revenue for MnSCU ( 794 million) and the UMN ( 844 million) is estimated to be 1.64billion. The combined tuition and fee and state appropriations revenue is 2.86 billion, of which 67 percent should be fundedby the state ( 1.9 billion) according to the policy.
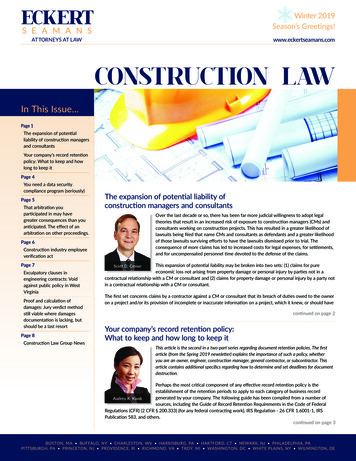
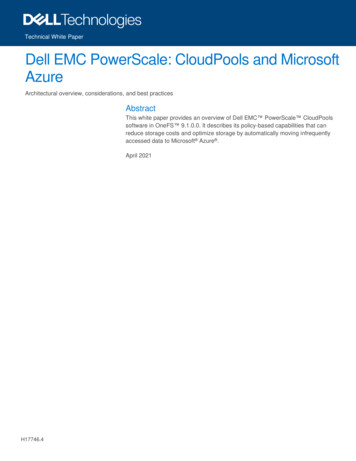
higher than expected rates until the recession in the early 2000s. 5 While state appropriations have yet toreturn to their fiscal year 2008-2009 pre-recession highs, Weerts et al. found that variation in statefunding over time is related to the state’s ability to fund the higher education enterprise due to stateeconomic conditions, rather than the result of conscious policy decisions.Number of Undergraduates140,000Figure 1: Undergraduate enrollment in Minnesota by age andtype of institution118,780 049,36240,00024,16726,00620,000024 and Younger25 and Older2-Year InstitutionsFall 200424 and Younger25 and Older4-Year InstitutionsFall 2008Fall 20132-year institutions include state colleges and private career schools. 4-year institutions include stateuniversities, University of Minnesota campuses and private colleges.Source: Minnesota Office of Higher EducationThe cumulative effect of Minnesota’s longstanding commitment to providing access to a postsecondaryeducation for its citizenry is evident in the educational attainment rate of the state’s adult population. In2012, Minnesota led the nation in the proportion of its adult population (age 25-64) with at least somecollege 6 or above (70 percent). 7Minnesota, however, is in the midst of key demographics transitions. The Minnesota State DemographicCenter (2014) currently projects Minnesota’s minority population will grow from 14 percent to 25percent by 2035. In addition, the proportion of the state’s population age 65 and older will double ascompared to the population under age 18 which will experience only moderate growth. 8 Within highereducation, students of color and older students have grown and will continue to be a larger share ofundergraduate enrollment in the state. Students of color enrollments have doubled from 13 percent oftotal students in 2003 to 24 percent in 2012. Enrollments of older students have increased 37 percentover the same time period as compared to eight percent growth for students age 24 and younger. Thisrapid growth rate may be abating with the improving economy, but a trend to lifelong learning seemsevident, for both retraining and obtaining post-baccalaureate degrees.5Weerts, D. J., Sanford, T., & Reinert, L. (2012). College funding in Context: Understanding the difference in highereducation appropriations across the states. Dēmos.6The American Community Survey’s educational attainment categories include, “Some College or Above,” which does notdistinguish between individuals who obtained a postsecondary certificate or diploma and those did not obtain eithercredential. For a more nuanced discussion on postsecondary certificates in Minnesota, see Appendix A.7U.S. Census Bureau, American Community Survey, 1-year estimates8Minnesota State Demographic Center. (2014). Minnesota population projects. Retrieved September 29, 2014 opulation-data/our-projections/index.jsp4Minnesota Office of Higher Education
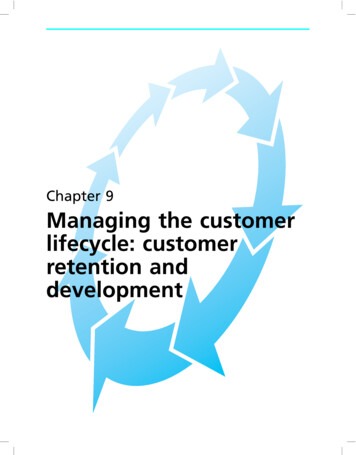
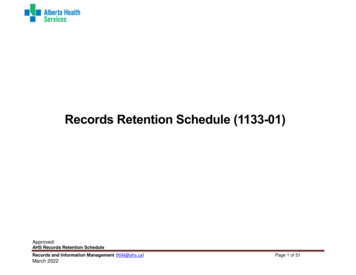
In a widely quoted estimate, the Georgetown Center for Education and the Workforce projects 74percent of jobs in Minnesota will require education or training beyond high school by 2020. 9 To meetsuch projected workforce demands within changing demographic trends, Minnesota’s higher educationsystem must identify and implement effective strategies to increase postsecondary completion rates forunderserved populations.Percent of Population Age 25 and Older withDegreesSignificant disparities exist in educational attainment by race and ethnicity. As shown in Figure 2, only29 percent of Black adults and 23 percent of Hispanic adults have obtained an associate degree or highercompared to 45 percent of White adults. 10 Additionally, younger Black and Hispanic adults (ages 25 to34) are less likely to have obtained an associate degree than Black and Hispanic adults between the agesof 45 to 54, indicating the state may be losing ground in educational attainment for communities ofcolor. 11 The disparity is present in grade school, as there are significant gaps between different races inhigh school graduation rates. The trend continues with initial college enrollment as fewer Black studentsenroll in four-year institutions (Figure 3) and when they do enroll they graduate at lower rates.Furthermore, Black, Hispanic and American Indian students are more likely to attend two-year collegesover four-year institutions than Whites or Asians, indicating that there is racial stratification as to whichgroups opt for two-year or four-year institutions.100%Figure 2: Educational attainment (associate degree or above) ofMinnesota’s population age 25 and older by race/ethnicity, 3%0%AmericanIndianAsianBachelor's Degree or HigherBlack2 or MoreRacesWhiteHispanic*Associate Degree or Higher*Hispanics may be of any race. Data for Hispanics may overlap with data for other race groups.Source: U.S. Census Bureau, 2013 American Community Survey 1-Year Estimates9Carnevale, A. P., Smith, N., & Strohl, J. (2013). Recovery: Job growth and education requirements through 2020.The Hispanic origin category represents individuals from all race categories. The Hispanic category reported should not becompared to the Caucasian population. Understanding this definitional difference further highlights the disparities that existacross race/ethnicity groups.11Prescott, B. T., & Bransberger, P. (2012). Knocking at the college door: Projections of high school graduates. WesternInterstate Commission for Higher Education.10
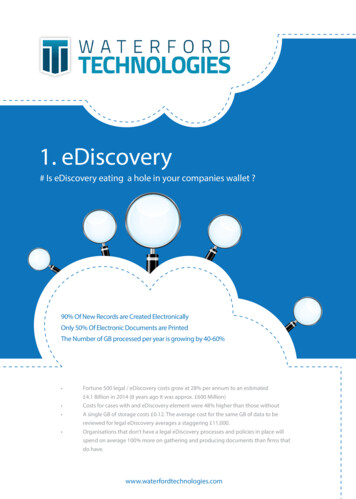
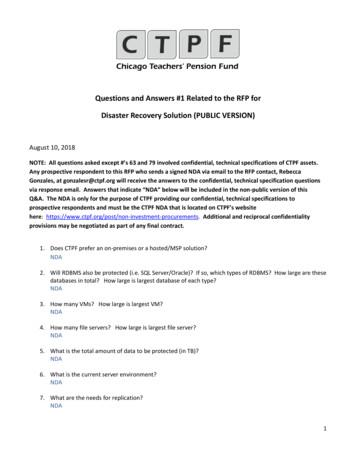
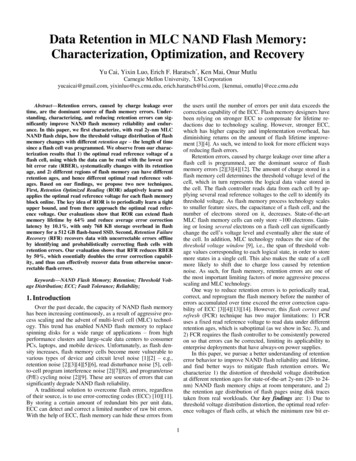
100%80%60%Figure 3: Undergraduate enrollment by race/ethnicity inMinnesota, fall ck4-year College Full TimeHispanic Two or MoreRacesWhite4-Year College Part TimeSource: Minnesota Office of Higher EducationPostsecondary AccessGaps in postsecondary success start before college with high school graduation and subsequentenrollment in college. While Minnesota’s high college participation rate is encouraging, not allpopulations are participating equally.High School GraduationFigure 4 presents the public four-year high school graduation rates by race/ethnicity for both Minnesotaand the nation in 2011-2012 (the most recent year of available data). With the exception of Whitestudents (84 percent for both Minnesota and the nation), Minnesota’s public high school graduation rateslag behind the nation and within Minnesota across every race/ethnicity category and amongeconomically disadvantaged populations. For example, only 49 percent of Minnesota’s Black studentsgraduate from public high schools within four years compared to 67 percent nationally. 12 Figure 5 showspublic four-year high school graduation rates from 2009-2013 by race. The graduation rate of Whitestudents has remained stable, and there have been slight increases in graduation rates for students ofcolor.12Stetser, M., and Stillwell, R. (2014). Public High School Four-Year On-Time Graduation Rates and Event Dropout Rates:School Years 2010–11 and 2011–12. First Look (NCES 2014-391). U.S. Department of Education. Washington, DC:National Center for Education Statistics. Retrieved September 29, 2014 from http://nces.ed.gov/pubsearch.6Minnesota Office of Higher Education
Figure 4: Public 4-year high school graduation rates (adjusted cohort) byrace/ethnicity and selected demographics for Minnesota and the United States,2011-201288%86%100%80%84%80% %MinnesotaSource: National Center for Education Statistics Race/EthnicitySpecial PopulationsFigure 5: Public 4-year high school graduation rates (adjusted cohort) byrace/ethnicity and selected demographics for Minnesota, American IndianSource: Minnesota Department of ts with DisabilitiesUSEnglish ProficiencyEconomically DisadvantagedWhiteBlackHispanicAsianAmerican IndianTotal0%
College ReadinessThere are also significant differences in academic preparation. Figure 6 shows the percentage ofMinnesota ACT test-takers who obtained a college-ready score in all four subject areas (English, math,science and reading) by race/ethnicity in 2013. 13 ACT defines college-ready as having a 75 percentchance of earning a “C” or better in related college-level courses. Ten percent of Black, 19 percent ofHispanic and 44 percent of White students have a 75 percent chance of earning a “C” (the minimumvalue for maintaining satisfactory academic progress) in all four of the respective college-level courses.Students who are not prepared academically are more likely to enroll in developmental coursework,which is associated with a lower probability of completion. 14Figure 6: College-readiness* of Minnesota ACT test-takers, 2014100%80%60%40%44%39%34%24%20%13%19%10%0%All StudentsAmericanIndianAsianBlackHispanicTwo or MoreRacesWhite*Meeting college-ready benchmarks in all four subjects: English, Math, Reading and Science.Source: ACTStudents of color enrolled in developmental education at higher rates than White students.15 While 28percent of 2011 public high school graduates took developmental courses statewide, Minnesota’s publichigh school class that year had the highest percentage of Black students (55 percent) taking collegedevelopmental education. The Asian, American Indian and Hispanic class of 2011 graduates enrolled indevelopmental courses at rates between 38 and 45 percent as compared to 24 percent for White students.This mirrors national trends, especially for Black or African American public high school graduates. 1613The ACT. (2014). ACT profile report – Minnesota: Graduating class 2014. Retrieved September 14, 2014 ile/Minnesota.pdf.14Adelman, C. (1999). Answers in the Tool Box: Academic Intensity, Attendance Patterns, and Bachelor's DegreeAttainment. Washington, DC: US Department of Education Office of Educational Research and Improvement.15Minnesota Office of Higher Education. (2014). Getting Prepared 2014.16National Center for Education Statistics. (2013). “First-year undergraduate remedial course-taking: 1999-2000, 2003-04,2007-08”. Statistics in Brief. January 2013. NCES 2013-013.8Minnesota Office of Higher Education
College ParticipationAs shown in Figure 7, students of color enrolled in college at lower rates than their White peers,especially for Hispanic and American Indian graduates. In 2011, the enrollment gap was 21 percentagepoints between Asian and White graduates (79 percent) enrolling in college within the first two years ascompared to Hispanic and American Indian graduates (58 percent). In comparison, 72 percent of Blackor African American graduates from the class of 2011 enrolled in college within two years. This trend isconsistent across years.Percent of Public High School GraduatesFigure 7. College enrollment within two years of high school graduation byrace/ethnicity100%78% 78%72% 74%80%60%52%50%55% 60% 58%57% 58%65%70% 73% 72%75%79% 80% 79%45%40%20%0%2006 2008 2010 2011American Indian or AlaskaNative2006 2008 2010 2011Asian2006 2008 2010 2011Hispanic/Latino2006 2008 2010 2011Black or African American2006 2008 2010 2011WhiteYear of High School GraduationEnrolled in MinnesotaEnrolled Out-of-StateSource: Minnesota Office of Higher EducationIn addition to racial/ethnic disparities, disparities in access across family income levels exist. Graduatesenrolled in free lunch enrolled in college at the lowest rates (63 percent) as compared to reduced pricelunch status students (72 percent) and non-free and reduced price lunch graduates (81 percent). All threeeconomic groups have shown growth in college enrollments over time, but the gaps are not closing.Students who were not enrolled in free and reduced price lunch also enrolled in college outside ofMinnesota at higher rates than lower-income students. This indicates that students from low-incomehouseholds are more likely to attend an institution based on affordability and geographic location, ratherthan what is truly the best fit for them.Furthermore, the students most at-risk of not completing postsecondary education are most likely toattend postsecondary institutions that have less funding and lack the resources to fully assist them. Astudy by Georgetown University found that since 1995, more than 80 percent of new white studentsenrolled at the top 468 colleges in the country, while more than 70 percent of new black and Hispanicstudents enrolled at the country’s open-enrollment 2- and 4-year institutions. 17 As a result, manystudents who attend these institutions end up leaving before graduating. 1817Carnevale, A, and J. Strohl. (2013). “Separate and Unequal: How Higher Education Reinforces the IntergenerationalReproduction of White Racial Privilege.” Georgetown University Center on Education and the Workforce.18Bowen, W., M. Chingos, and M. McPherson. (2011). Crossing the Finish Line: Completing College at America’s PublicUniversities. Princeton University Press.
Nationally, 81 percent of recent high school completers from high-income families participated incollege in 2011-2012 compared to 51 percent for students from low-income families (a 30 percentagepoint gap) and 65 percent for students from middle-income families (Figure 8). 19 The 30 percentagepoint gap in postsecondary participation between low-income and high-income has remained stablesince 1975, while the gap between students from middle-income and high-income families has slightlydeclined over the same period (from 20.2 percentage points in 1975 to 16.1 percentage points in 2012).Figure 8: College participation rate of recent high school graduatesin the United States, by family income type, income65%Middle-income51%Low-incomeSource: National Center for Education StatisticsPostsecondary RetentionUnderstanding when students enroll and exit the system without a credential is crucial for developingtargeted policies and interventions to support them in achieving certificate or degree requirements. Table1 presents Minnesota’s first-to-second year retention rates by sector. It should be kept in mind that theserates do not capture those students who transferred to another institution, or graduated that year. 20 21Retention rates at four-year institutions (81 percent) ranked 14th nationally, slightly higher than both thenational average and retention rates at four-year institutions in peer states. 22 Over half of the attrition atfour-year institutions occurs in students’ first year in college. At two-year institutions, first-to-secondyear retention rates (57 percent) rank in the bottom half nationally (34th), four percentage points lowerthan the national average. The first- to second-year retention rates do not capture those students whomay have transferred to another college or university, or graduated.19Snyder, T. D., & Dillow, S. A. (2013). Digest of Education Statistics, 2012. NCES 2014-015. National Center forEducation Statistics.20By the second fall term after entry, 10 percent of Minnesota two-year state college students have transferred to anotherinstitution, while another 9 percent have graduated.21The Minnesota Transfer Curriculum (MnTC) gives students at state colleges incentives to transfer credit before graduationas well.22The retention rates presented do not account for students that transfer to another intuition, thereby artificially inflating theattrition rate. Two-year institutions are likely to be more affected by this omission.10Minnesota Office of Higher Education
Table 1: Undergraduate first-time, full-time, first-to-second year retention rates at the same instiution, fall20134-Year Institutions2-Year InstitutionsTop StatesTop StatesCalifornia87% Alaska89%Massachusetts86% California71%Rhode Island85% South Dakota69%Minnesota (14th)81% Minnesota (34th)57%Peer States80% Peer States58%Nation80% Nation61%Source: U.S. Department of Education, IPEDS Enrollment SurveyFor many adults, the path to higher education is nonlinear and is often characterized by several entry andexit points over longer periods of time. Historically, Minnesota led the nation in developing strategies toserve adult students, including the founding of Metropolitan State University, one of the first publicinstitutions designed to meet the needs of older working adults.Nonlinear education pathways lead many students to return to college to complete their program or toenhance existing skills later in life. Even though students age 24 and younger represent the largest shareof total undergraduate enrollment, over the last decade, the enrollment of undergraduate adult students(age 25 and older) in Minnesota increased 37 percent, compared to eight percent for students age 24 andyounger. 23 At Minnesota two-year institutions, adult students now represent the largest share ofenrollment. These trends could intensify as the growth rate of Minnesota’s population age 19 andyounger slows in the coming decades.Postsecondary CompletionStates are beginning to gather more comprehensive data about the completion rates of studentpopulations. Graduation rates reported to the U.S. Department of Education are based on a cohort offirst-time, full-time students which represents a small share of enrollment at public two-year institutions.Furthermore, graduation rates reported by the U.S. Department of Education exclude students whoenrolled into an institution as a transfer student. This limited cohort also hind
Fiscal year 2015 state appropriations were 1.22 billion ( 600 million for the University of Minnesota [UMN] and 622 million for the Minnesota State Colleges and Universities [MnSCU]). According to MnSCU's and the UMN's FY15 operating budgets, tuition revenue for MnSCU ( 794 million) and the UMN ( 844 million) is estimated to be 1.64 billion.