Transcription
.assessment reportTimed Versus UntimedTesting Conditions andStudent Performance.Thomas E. Brooks, Ph.D.Betsy J. Case, Ph.D.Michael J. Young, Ph.D.June 2003(Revision 2, May 2004)Copyright 2003, 2004 by Pearson Education, Inc. or its affiliate(s). All rights reserved.Pearson and the Pearson logo are trademarks of Pearson Education, Inc. or its affiliate(s).
ASSESSMENT REPORTTimed Versus Untimed Testing Conditions and Student PerformanceAcknowledgementsThis Pearson Report was prepared with the assistance of:Greg AyresNancy SeveranceNathan WallHolly Zhang2Copyright 2003, 2004 by Pearson Education, Inc. or its affiliate(s). All rights reserved.Pearson and the Pearson logo are trademarks of Pearson Education, Inc. or its affiliate(s).
.ASSESSMENT REPORTTimed Versus Untimed Testing Conditions and Student PerformanceTimed Versus UntimedTesting Conditions andStudent PerformanceIntroductionThe adherence to fixed time limits during group administrations of norm-referencedstandardized tests has been an accepted practice from the early part of the 20th century(Anastasi, 1976; pp. 32–34).According to Ebel and Frisbie (1991), standardized tests or measures provide:The means for making score comparisons among examinees who attemptthe same tasks under the same testing conditions and time constraints, andwhose responses are scored with the same procedures (p. 286).As Ebel and Frisbie (1991; pp. 286–288) also point out, standardized testing proceduresserve the same function in education as they do when applied to goods and servicesencountered every day. Without standardized weights and measures, things as simple aspurchasing fresh produce or a gallon of gasoline would be quite chaotic.For example, if Environmental Protection Agency’s published miles-per-gallon (MPG)ratings were not the result of tests conducted under standard conditions, a distortedpicture of true fuel efficiencies would emerge. A full-sized sedan tested at a constant,moderate speed under ideal weather conditions could appear (falsely) to have a betterMPG rating than a sub-compact car tested at high speed under extremely hot conditions.Until recently, research examining differences in student performance under fixed timeversus untimed testing conditions has been relatively infrequent. An early empiricalstudy (Baxter, 1931) was repeated in 1952 by Myers. Both studies looked at therelationship of speededness and power to the level of difficulty of the test. Theconclusion was that the scores on these timed tests were a function of two unrotated(orthogonal) underlying factors: test-takers’ ability and the rate of answering, with abilitybeing more influential. Lord (1956) continued this line of research. Virtually all of theother research conducted from 1931 to 1987 on timed versus untimed testing conditionsincluded only high school or college students.3Copyright 2003, 2004 by Pearson Education, Inc. or its affiliate(s). All rights reserved.Pearson and the Pearson logo are trademarks of Pearson Education, Inc. or its affiliate(s).
ASSESSMENT REPORTTimed Versus Untimed Testing Conditions and Student Performance.The need to reconsider of the use of fixed time limits on standardized tests has grown inrecent years. Tindal and Fuchs (1999) identified ten empirical studies conducted from1987 through 1999 that examined the effects of timed versus untimed testing conditionson students in kindergarten through grade 12. All of these studies included students withdisabilities and varying ability levels.As a result of legislation such asthe Elementary and Secondary Education Act (ESEA) as reauthorized under theNo Child Left Behind Act of 2001 (NCLB) (Pub. L. 107–110),the Individuals with Disabilities Education Act, as amended (IDEA) (20 U.S.C.§§ 1400 et seq.), andTitle II of the Americans with Disabilities Act of 1990 (ADA) (42 U.S.C. §§12101 et seq.),the impetus for a re-examination of timed versus untimed testing conditions has becomestronger and includes new concerns about fairness in testing (i.e., accommodations).Accommodations, as opposed to modifications, are changes in standardized assessmentconditions that are incidental to the construct being measured. Traditionally, untimedadministrations of norm-referenced tests, when they did occur, meant the sacrifice of theassociated norms and other derived score information. With the current focus onaccommodations and inclusive testing conditions, the appropriateness of fixed testingtimes has become an important aspect of research conducted by Pearson Inc.(Pearson).This Assessment Report presents background information on timed versus untimedconditions as they relate to standardized testing. It also summarizes the results of researchstudies examining student performance under timed and untimed testing conditionsconducted as part of the Stanford 10 standardization program.What Does the Research Say?The research conducted to date by others that specifically addresses the consequences oftimed versus untimed testing conditions for students in kindergarten through high schoolis primarily focused on test validity.Validity is the ability of the test to provide a fair and accurate assessment of what hasbeen learned. At stake are the NCLB-driven efforts of states, districts, and schools toaccount for students’ performance as well as improved knowledge and skills over time.Each state has developed, or is developing, a set of instructional standards or criteria thatmay or may not match those developed by other states. Educational assessments are thenadministered by the states to determine the degree to which (below basic, basic,proficient, and advanced, for example) students have achieved these instructionalstandards.Standards-based tests typically have high stakes for students, teachers, and stateeducation agencies. When a standards-based or criterion-referenced score as opposed to a4Copyright 2003, 2004 by Pearson Education, Inc. or its affiliate(s). All rights reserved.Pearson and the Pearson logo are trademarks of Pearson Education, Inc. or its affiliate(s).
.ASSESSMENT REPORTTimed Versus Untimed Testing Conditions and Student Performancenorm-referenced score is the objective of an assessment, some would advocate therelaxation or abandonment of traditional fixed time administrations. The thinking is thatadministration procedures such as fixed times have no relevance to the standards-basedperformance being assessed and may unfairly disadvantage some students. In contrast,however, objections may be raised against any variation in testing conditions thought toprovide an advantage to some students over others.This is where the desire to administer a test under the same conditions under which it wasstandardized (so that norm-referenced scores can be generated and used) comes intoconflict with the desire to offer reasonable accommodations to students with disabilitieswho are otherwise unable to fully demonstrate their achievement of relevant instructionalstandards. The ideal middle ground in this conflict would seem to be one where studentswith disabilities are accommodated—without changing the educational content or processskills being assessed—so that they may show their abilities without the negativeinfluence of factors relevant to their disabilities, (AERA, 1999).A relatively small number of studies have investigated the impact of timed versusuntimed conditions specific to the performance of students with disabilities (Alster, 1997;Halla, 1988; Harker, 1991; Hill, 1984; Munger and Loyd, 1991; Perlman, Borger,Collins, Elenbogen and Wood, 1996; Runyan, 1991a, 1991b).Huesman and Frisbie (2000) studied the performance of students with and withoutdisabilities on a standardized norm-referenced test and found that students withdisabilities perform significantly better under extended time conditions than they dounder fixed time conditions.Pearson’s ResearchAs part of the 2002 standardization of Stanford 10, which was administered for the mostpart under untimed conditions, Pearson conducted research that compared theperformance of students taking the test under timed and untimed testing conditions.StandardizationThe following important note to teachers appeared in the spring and fall standardizationeditions of the Stanford 10 Directions for Administering below a table of proposed testingtimes:Times are included for planning purposes only. Stanford 10 is to beadministered so that all children have sufficient time to complete it. Thetime allotment indicated for each subtest should be adequate for manystudents. However, if necessary, additional time must be provided for astudent to complete the test. Allow any student to have as much time as heor she needs to complete the test while working productively.5Copyright 2003, 2004 by Pearson Education, Inc. or its affiliate(s). All rights reserved.Pearson and the Pearson logo are trademarks of Pearson Education, Inc. or its affiliate(s).
ASSESSMENT REPORTTimed Versus Untimed Testing Conditions and Student Performance.(NOTE: The above notice now appears in the Directions for Administering for all levelsof the currently published Stanford 10 series.)For the Stanford Achievement Test Series, Ninth Edition (Stanford 9) and itspredecessors, untimed norms (separate norms for students who took the test usingextended time accommodations), though requested, were not available because the testswere not standardized under untimed conditions. The standardization of Stanford 10under untimed conditions has eliminated any need for separate untimed norms, whileallowing for the reporting of both standards-based and norm-referenced scores forstudents with and without disabilities.During the Stanford 10 standardization process, teachers were provided with suggestedadministration times (based on the fixed times used for the administration of Stanford 9)for each subtest. Teachers were also instructed to allow additional time beyond thesuggested times as necessary for students to complete each subtest while still workingproductively. In addition, teachers were asked to record the starting and ending times aseach subtest was administered. These data, obtained from about 500 classrooms for eachgrade tested, were used to determine the extent to which additional time was allowed andto evaluate the extent to which extended time varied from grade to grade.The StudyThe Pearson research was designed to determine if administering Stanford 10 under bothtimed and untimed conditions would affect test results differentially.The approximately 360,000 students in the Stanford 10 Standardization Sample weretested under untimed conditions. A separate, additional group of students (about 150classrooms at each grade) was tested under timed conditions. The “timed” group wasselected to represent the same demographic characteristics as the larger untimed group. Inaddition, students from the larger, untimed standardization group were selected at randomto form an “untimed” group similar in size (about 150 classrooms at each grade) anddemographic characteristics to the timed group. The grade-appropriate Stanford 10battery was administered to all students.The table of proposed testing times contained in the standardization editions of theStanford 10 Directions for Administering were used as fixed times for the group testedunder timed conditions.ResultsData from the study were processed at the Pearson Scoring Center in San Antonio, TX.All data are reported as raw scores and are summarized in Table 1.Differences in the average raw scores of students tested under timed and untimedconditions were typically very small. In the majority of cases, the differences amountedto less than one raw score point. Although the differences were quite small and nonsignificant for the most part, all students tested under untimed conditions showedimproved performance through grade 6. However, above grade 6, students actuallyperformed slightly better under timed conditions.6Copyright 2003, 2004 by Pearson Education, Inc. or its affiliate(s). All rights reserved.Pearson and the Pearson logo are trademarks of Pearson Education, Inc. or its affiliate(s).
.ASSESSMENT REPORTTimed Versus Untimed Testing Conditions and Student PerformanceTable 1. Difference Between Average Raw Scores for Students Tested under Timed and eSignificant?1Word Study SkillsWord ReadingSentence ReadingMathematics Problem SolvingMathematics age �NoNo––––––2Word Study SkillsReading VocabularyReading ComprehensionMathematics Problem SolvingMathematics age 4–––28.7–––0.20.7––– 0.2––0.2–NoNo–––No––3Word Study SkillsReading VocabularyReading ComprehensionMathematics Problem SolvingMathematics ProceduresLanguageSpellingScienceSocial ScienceListeningAverage 0.13.11.70.50.4–0.8NoNoNoNoNoYesYesNoNo–(– indicates that data are not included because the test was dictated to students.Significance level for differences between means is .05.)7Copyright 2003, 2004 by Pearson Education, Inc. or its affiliate(s). All rights reserved.Pearson and the Pearson logo are trademarks of Pearson Education, Inc. or its affiliate(s).
.ASSESSMENT REPORTTimed Versus Untimed Testing Conditions and Student PerformanceTable 1. Difference Between Average Raw Scores for Students Tested under Timed and UntimedConditions ficant?4Word Study SkillsReading VocabularyReading ComprehensionMathematics Problem SolvingMathematics ProceduresLanguage MechanicsLanguage ExpressionSpellingScienceSocial ScienceListeningAverage .41.4 �5Reading VocabularyReading ComprehensionMathematics Problem SolvingMathematics ProceduresLanguage MechanicsLanguage ExpressionSpellingScienceSocial ScienceListeningAverage 1.832.228.618.715.815.225.422.824.3–0.40.51.10.5 0.20.1 0.10.31.8–0.5NoNoNoNoNoNoNoNoYes–6Reading VocabularyReading ComprehensionMathematics Problem SolvingMathematics ProceduresLanguage MechanicsLanguage ExpressionSpellingScienceSocial ScienceListeningAverage 0.30.50.20.4 0.3–0.4NoNoNoNoNoNoNoNoNo–(– indicates that data are not included because the test was dictated to students.Significance level for differences between means is .05.)8Copyright 2003, 2004 by Pearson Education, Inc. or its affiliate(s). All rights reserved.Pearson and the Pearson logo are trademarks of Pearson Education, Inc. or its affiliate(s).
.ASSESSMENT REPORTTimed Versus Untimed Testing Conditions and Student PerformanceTable 1. Difference Between Average Raw Scores for Students Tested under Timed and UntimedConditions ficant?7Reading VocabularyReading ComprehensionMathematics Problem SolvingMathematics ProceduresLanguage MechanicsLanguage ExpressionSpellingScienceSocial ScienceListeningAverage 9.531.522.016.115.714.924.022.219.9– 0.6 0.5 0.41.2 0.4 0.8 0.8 1.0 0.8– 0.4NoNoNoYesNoNoNoNoNo–8Reading VocabularyReading ComprehensionMathematics Problem SolvingMathematics ProceduresLanguage MechanicsLanguage ExpressionSpellingScienceSocial ScienceListeningAverage 1.320.021.114.713.914.724.920.217.6–0.0 3.4 1.0 2.4 2.4 1.3 0.40.6 0.9– 1.2NoYesNoYesNoYesNoNoNo–10Reading VocabularyReading ComprehensionMathematicsLanguageLanguage MechanicsLanguage ExpressionSpellingScienceSocial ScienceAverage 34.221.554.513.815.425.320.315.9 0.4 1.7 1.9 2.1 0.7 1.3 0.2 1.1 1.0 1.2NoYesYesNoNoYesNoNoNo(– indicates that data are not included because the test was dictated to students.Significance level for differences between means is .05.)9Copyright 2003, 2004 by Pearson Education, Inc. or its affiliate(s). All rights reserved.Pearson and the Pearson logo are trademarks of Pearson Education, Inc. or its affiliate(s).
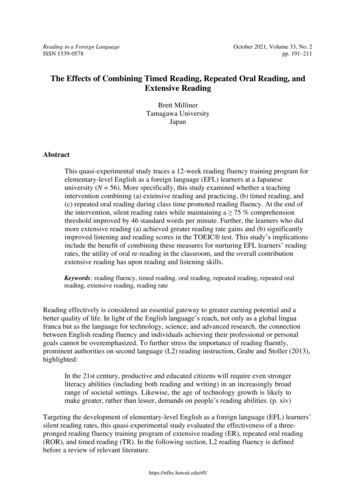
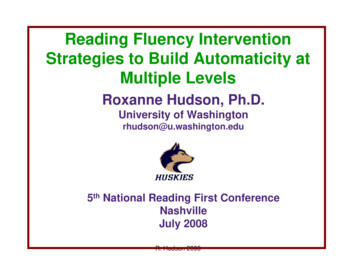
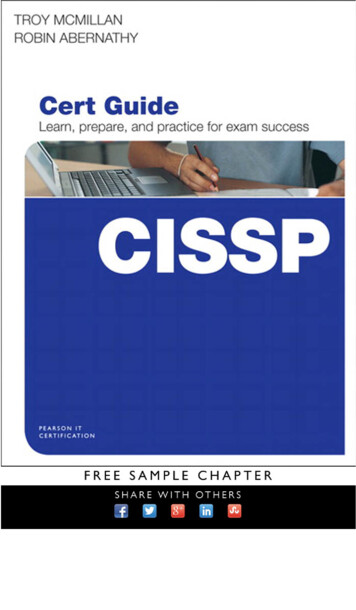
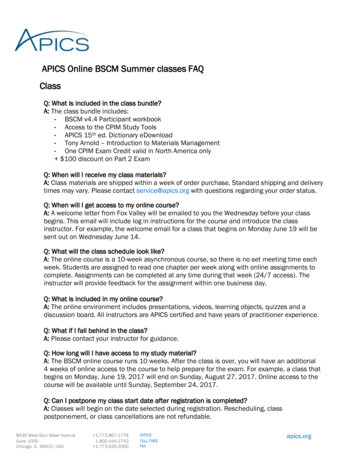
ASSESSMENT REPORTTimed Versus Untimed Testing Conditions and Student Performance.The Effect of Untimed Conditions on Non-disabled StudentsAnother aspect of Pearson’s research investigated the effect of extended time limits onthe performance of non-disabled students. Research by others examining students ingrades K through 12 showed that students with disabilities generally performed betterunder untimed conditions. Furthermore, research by others (Bridgman, et al, 2002;Alster, 1997) showed that the extra time did not enhance the performance of non-disabledstudents. Pearson’s research supported the prior research in that differences in theperformance of non-disabled students under timed or untimed conditions during thestandardization of Stanford 10 were very small, as shown in Table 1.SummaryInterestingly, the small differences in performance shown in Table 1 indicate thattraditional fixed time limits allow ample time for the great majority of students tocomplete the test. This demonstrates that procedures established by Pearson over thepast 80 years for setting time limits have allowed adequate time for non-disabled studentsto complete the test without undue strain or errors owing to time pressure. Moreimportant, however, is the evidence that the allowance of extended times accommodatesdisabled students so that they may demonstrate what they have learned while not unfairlyinflating the scores of non-disabled students.How Much Extended Time was Typically Allowed?Extensions beyond the testing times proposed in the spring and fall standardizationeditions of the Directions for Administering were allowed by teachers in fewer than 50percent of classrooms participating in the Stanford 10 standardization program. As can beseen in Figures 1a through 1i, the larger amounts of additional time were allowed morefrequently in grades 1 through 3 and less frequently in grades 9 through 11. For nearly allclassrooms, no more than 20 additional minutes were needed to finish any subtest.Results for nine Stanford 10 subtests are depicted in Figures 1a-1i.More additional time was allowed on the Reading Vocabulary subtest than on theReading Comprehension subtest, and more additional time was allowed on theMathematics Procedures subtest than on the Mathematics Problem Solving subtest. Theproposed testing times for the Reading Vocabulary and Mathematics Procedures subtestsare considerably less than the proposed testing times for Reading Comprehension andMathematics Problem Solving; therefore, this greater additional time allowance mayreflect a perceived need on the part of the teachers. In any case, because at least 95% ofthe classrooms finished testing with no more than 20 additional minutes allowed on anysubtest, concerns about untimed tests taking significantly more time to administer may beunfounded.10Copyright 2003, 2004 by Pearson Education, Inc. or its affiliate(s). All rights reserved.Pearson and the Pearson logo are trademarks of Pearson Education, Inc. or its affiliate(s).
.ASSESSMENT REPORTTimed Versus Untimed Testing Conditions and Student Performance92.110081.771.38047.4INTERM EDIA TEA DVA NCED10 MINNONE20 MINNONE30 MIN10 MINP RIM A RY6.61.4 0.71.1 0.230 MIN15.04.1 1.21.3NONE20 MIN010 MIN7.030 MIN2020 MIN22.830 MIN4010 MIN43.220 MIN60NONEPercent of ClassroomsReading VocabularySECONDA RYNote: Percentage values shown subject to rounding.Figure 1a. Amounts of Additional Time Allowed for Untimed AdministrationReading Comprehension85.981.48066.460 51.135.5INTERM EDIA TE10.4A DVA NCEDNONE30 MIN20 MINNONE1.9 0.22.8 0.730 MIN2.720 MIN16.330 MIN10 MINNONEP RIM A RY20 MIN7.12.430 MIN10 MIN020 MIN9.910 MIN22.92010 MIN40NONEPercent of Classrooms100SECONDA RYNote: Percentage values shown subject to rounding.Figure 1b. Amounts of Additional Time Allowed for Untimed Administration11Copyright 2003, 2004 by Pearson Education, Inc. or its affiliate(s). All rights reserved.Pearson and the Pearson logo are trademarks of Pearson Education, Inc. or its affiliate(s).
.ASSESSMENT REPORTTimed Versus Untimed Testing Conditions and Student Performance10088.88026.335.8P RIM A RYA DVA NCED30 MIN20 MIN0.0 0.210 MIN10 MINNO NE30 MIN20 MIN10 MININTERM EDIA TE10.80.3NO NE7.81.9NO NE20 MIN10 MIN3.830 MIN13.820042.225.730 MIN4049.647.242.620 MIN60NO NEPercent of Classroom sLanguageSECONDA RYNote: Percentage values shown subject to rounding.Figure 1c. Amounts of Additional Time Allowed for Untimed Administration93.510095.391.481.0806040P RIM A RYADVANCED30 MIN20 MINNO NE10 MIN4.1 0.50.00.6 0.230 MINNO NE30 MININTERM EDIATE10 MIN7.90.4 0.220 MIN10 MINNO NE30 MIN20 MIN10 MIN05.82.1 0.220 MIN16.720NO NEPercent of Classroom sSpellingSECONDARYNote: Percentage values shown subject to rounding.Figure 1d. Amounts of Additional Time Allowed for Untimed Administration12Copyright 2003, 2004 by Pearson Education, Inc. or its affiliate(s). All rights reserved.Pearson and the Pearson logo are trademarks of Pearson Education, Inc. or its affiliate(s).
.ASSESSMENT REPORTTimed Versus Untimed Testing Conditions and Student Performance1008081.075.078.86040TA SK 25.430 MIN3.120 MINNONE10 MIN11.22.630 MIN10 MINNONETA SK 13.220 MIN11.13.230 MIN7.320 MIN010 MIN12.120NONEPercent of ClassroomsTotal MathematicsTA SK 3Note: Percentage values shown subject to rounding.Figure 1e. Amounts of Additional Time Allowed for Untimed Administration1008058.032.623.922.7P RIM A RYINTERM EDIA TEA DVA NCEDNote: Percentage values shown subject to rounding.Figure 1f. Amounts of Additional Time Allowed for Untimed Administration13Copyright 2003, 2004 by Pearson Education, Inc. or its affiliate(s). All rights reserved.Pearson and the Pearson logo are trademarks of Pearson Education, Inc. or its affiliate(s).1.930 MINNONE20 MIN3.82.430 MIN10 MIN20 MIN6.21.7NONE10 MIN7.230 MIN2010 MIN40071.365.520 MIN60NONEPercent of ClassroomsMathematics Problem Solving
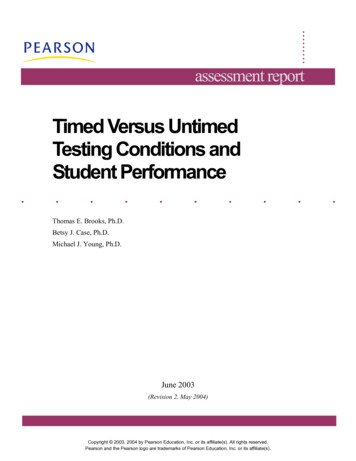
.ASSESSMENT REPORTTimed Versus Untimed Testing Conditions and Student PerformanceMathematics Procedures80P RIM A RYINTERM EDIA TE8.710 MIN4.530 MIN4.5NONE7.030 MIN28.120 MIN10 MINNONE4.630 MIN10 MIN06.920 MIN2032.720 MIN35.24058.755.860 53.3NONEPercent of Classrooms100A DVA NCEDNote: Percentage values shown subject to rounding.Figure 1g. Amounts of Additional Time Allowed for Untimed Administration10085.48043.027.422.9P RIM A RY12.1INTERM EDIA TE30 MIN10 MINNO NE30 MINNO NEADVANCED20 MIN2.3 0.22.1 0.60.930 MIN10 MIN20 MIN5.10.8NO NE20 MIN10 MIN7.830 MIN2020 MIN4010 MIN60 48.3074.365.8NO NEPercent of C lassroom sScienceSECONDARYNote: Percentage values shown subject to rounding.Figure 1h. Amounts of Additional Time Allowed for Untimed Administration14Copyright 2003, 2004 by Pearson Education, Inc. or its affiliate(s). All rights reserved.Pearson and the Pearson logo are trademarks of Pearson Education, Inc. or its affiliate(s).
.ASSESSMENT REPORTTimed Versus Untimed Testing Conditions and Student Performance10063.241.3P RIM A RYINTERM EDIATE15.230 MIN10 MIN2.4 0.0NO NENO NEADVANCED30 MIN3.0 0.50.730 MIN10 MIN20 MIN6.40.6NO NE20 MIN10 MIN4.930 MIN2023.920 MIN28.920 MIN4010 MIN60 53.1081.972.680NO NEPercent of C lassroom sSocial ScienceSECONDARYNote: Percentage values shown subject to rounding.Figure 1i. Amounts of Additional Time Allowed for Untimed AdministrationImpact of Additional Testing Time on Non-Disabled Student PerformanceThe results of Pearson’s study showed that allowing additional time on tests gave nodemonstrable advantage to non-disabled students. However, there was a concern thatsome teachers may have allowed excessive amounts of additional time in an effort tomaximize their students’ scores. To investigate this possibility, the actual testing timesrecorded by the teachers were merged with actual test scores of the non-disabled studentsin their classes. Thus, it was possible to calculate the mean raw score for all classroomsat each grade that received a certain amount of additional time.The results of this analysis for the Reading Comprehension and Mathematics ProblemSolving subtests for grades 1 through 8 and grade 10 are presented in Table 2. It is clearthat, for a particular grade, there is no consistent increase or decrease in mean raw scoresfor non-disabled students receiving from none to 25 minutes of additional time. There isalso no consistent advantage gained by allowing what might be considered an excessiveamount of additional time. Mean raw scores for classes that allowed more than 25minutes of additional time are not consistently higher or lower than scores for classes thatwere allowed any other amount of additional time. Therefore, the data show that it is veryunlikely that excessive time extensions for non-disabled students would be problematic inpractice.15Copyright 2003, 2004 by Pearson Education, Inc. or its affiliate(s). All rights reserved.Pearson and the Pearson logo are trademarks of Pearson Education, Inc. or its affiliate(s).
.ASSESSMENT REPORTTimed Versus Untimed Testing Conditions and Student PerformanceTable 2. Mean Raw Score as a Function of Additional Time AllowedReading ComprehensionAdditionalTimeAllowednonePrimary 1 Primary 2 Primary 3 Intermed. 1 Intermed. 2 Intermed. 3Adv. 1Adv. 2TASK30.927.334.530.932.034.633.436.032.85 min.29.825.838.535.832.933.638.433.734.910 min.28.524.435.936.135.136.928.237.531.615 min.28.727.935.128.432.131.534.340.444.020 min.31.825.636.339.930.732.435.6NC32.925 min.28.522.334.933.835.433.536.0NCNCover 25 min.29.229.1NC32.836.536.0NCNCNCMathematics Problem SolvingAdditionalTimePrimary 1* Primary 2* Primary 3 Intermed. 1 Intermed. 2 Intermed. 3Allowednone30.428.428.125.6Adv. 1Adv. 2 TASK**24.324.121.015 min.31.730.629.225.930.824.317.7910 min.31.225.728.625.822.023.920.1115 min.24.834.527.625.619.130.817.0020 min.29.428.031.426.425.027.123.2925 min.32.628.825.328.332.526.619.00over 25 min.38.027.119.024.6NC29.3NCNC No classrooms at this test level allowed additional time.* The Mathematics Problem Solving subtest is dictated to students at this test level. Time limits are not applicable.** Since there is no separate Mathematics Problem Solving subtest at this level, the Total Mathematics score was used.ConclusionAlthough there was considerable variability in the numbers of classrooms in whichadditional testing time was allowed, as well as the amount of additional time allowed,teachers did not appear to have allowed excessive amounts of additional testing timeduring the standardization of Stanford 10. Differences in the performance of non-disabledstudents under timed and untimed conditions on Stanford 10 are essentially non-existent.Although this may be an unexpected result, it is not inconsistent with the results ofstudies conducted by other researchers in the field. This result tends to confirm thatPearson’s procedures for determining suggested testing times, developed over the past80 years, have set accurate suggested times for non-disabled students to complete the testwithout undue strain or errors owing to time pressure. More important is the observationthat allowing additional testing time will not boost the scores of non-disabled studentsover students with disabilities. Therefore, there is little cause for concern that flexible16Copyright 2003, 2004 by Pearson Education, Inc. or its affiliate(s). All rights reserved.Pearson and the Pearson logo are trademarks of Pearson Education, Inc. or its affiliate(s).
.ASSESSMENT REPORTTimed Versus Untimed Testing Conditions and Student Performancetiming guidelines will be abused by test administrators. The single most crucial result ofall this work is the knowledge that Stanford 10 norms are unaffected by theadministration of tests under untimed conditions. Thus, students with disabilities who areallowed additional testing time can receive unqualified norm-referenced scores.ReferencesAlster, E. H. (1997). The effects of extended time on algebra test scores for college students withand without learning disabilities. Journal of Learning Disabilities, 30(2), 222–227.American Education Research Association, American Psychological Association, NationalCouncil of Measurement in Education. 1999 Standards for education and psychologicaltesting. Washington, D.C.: American Education Research Association.Americans with Disabilities Act of 1990 (ADA) (Pub. L. 101–336), as amended.Anastasi, A. (1976) Psychological Testing (pp. 32–34). New York: Macmillan.Braun, H., Ragosta, M., & Kaplan, B. (1988). Predictive validity. In W. W. Willingham, M.Ragosta, R. E. Bennett, H. Braun, D. A. Rock, & D. E. Powers (Eds.), Testing handicappedpeople (pp. 109–132). Boston, MA: Allyn and Bacon.Bridgman, B., Curley, E., & Trapani, C. (2002). Impact of fewer questions per section on SAT Iscores. Manuscript submitted for publication.Cahalan, C., Mandinach, E., & Camara, W. (2002). Predictive validity of SAT I: Reasoning testfor test-takers with learning disabilities and extended time accommodations. (College BoardResearch Report No. 2002-5). New York: College Entrance Examination Board.Ebel, R. L., & Frisbie, D. A. (1991). Essentials of educational measurement, pp. 286–288.Englewood Cliffs, NJ: Prentice-Hall.Halla, J. E. (1998). A psychological study of psychometric differences in graduate recordexaminations general test scores between learning disabled and non-learning disabled adults(Doctoral dissertation, Texas Tech University, Lubbock). Dissertation Abstracts
Timed Versus Untimed Testing Conditions and Student Performance . Timed Versus Untimed Testing Conditions and Student Performance. Introduction The adherence to fixed time limits during group administrations of norm-referenced standardized tests has been an accepted practice from the early part of the 20th century (Anastasi, 1976; pp. 32-34).