Transcription
QUS Departmentot TransportationNational HighwayTraffic SafetyAdministrationDOT-HS-807-446August 1989DOT-TSC-NHTSA-89-3Final ReportStatistical Estimation of Rollover RiskPeter MengertSanto SalvatoreRobert DiSarioRobert WalterTransportation Systems CenterOffice of Research and AnalysisCambridge, MA 02142Prepared forResearch and DevelopmentOffice of Crash Avoidance ResearchWashington, DC 20590This document isavailable to the publu fium tin.- National technical Information Seivice, Springfield, Virginia 22161
NOTICEThis document is disseminated under the sponsorship of the Department ofTransportation in the interest of information exchange. The United StatesGovernment assumes no liability for its contents or use thereof.NOTICEThe United States Government does not endorse products of manufacturers.Trade of manufacturers'names appear herein solely because they are considered essential to the object of this report.
Technical Report Documentation Page1.Report No.2.3.Government Accession No.Recipient's Catalog No.D0T-HS-807-4464.Title and Subtitle5.Report DateAugust 1989STATISTICAL ESTIMATION OF ROLLOVER RISK6. Performing Organization CodaDTS-458. Performing Orgonizotion Report No.7.Author'])DOT-TSC-NHTSA-89-3P. Mengert, S. Salvatore, R. DiSario, R. Walter9. Performing Orgonizotion Name and Address10. Work Unit No. (TRAIS)HS902/S9001U.S. Department of TransportationResearch and Special Programs AdministrationTransportation Systems CenterCambridge, MA 0214211. Controet or Grant No.13. Type of Report and Period Covered12. Sponsoring Agency Name end AddressFinal ReportU.S. Department of TransportationNational Highway Traffic Safety AdministrationResearch and DevelopmentWashington, DC 20590March 1988 - May 198914. Sponsoring Agency CodeNRD-51IS. Supplementary Notes16.' AbstractThis report describes the results of a statistical analysis to determine theprobability of a rollover in a single vehicle accident. Over 39,000 accidents,which included 4910 rollovers in the states of Texas, Maryland, and Washington wereexamined for 40 vehicle make/models using logistic regression analyses.Mathematical models were developed that related vehicle factors such as wheelbaseand stability factor, (one-half the track width divided by the center of gravityheight) and accident factors, (driver and the environmental variables), to rolloverprobability.It was found that at the accident level (predicting rollover versus nonrollover)the vehicle stability factor and whether the accident occurred on an urban or ruralroad are important predictors of rollover probability. At the vehicle make/modellevel (comparison of predicted and actual rollover rates for the 40 make/models),the index of agreement (r2) exceeded 0.90 with the stability factor in theregression model. Without the stability factor, the r2 dropped to 0.53 indicatingthe importance of this factor.Other factors added little to predicting rolloverat the make/model level.17. Key Words18.Distribution StatementOOCUMENT IS AVAILABLE TO THE PUBLICRollover, Logistic Regression,Single Vehicle AccidentsTHROUGH THE NATIONAL TECHNICALINFORMATION SERVICE. SPRINGFIELD.VIRGINIA 2216119. Security Classif. (of this report)20. Security Classif. (of this page)21- No. of PagesUnclassifiedUnclassified72Form DOT F 1700.7 (8-72)Reproduction of completed page authorized22.Price
PREFACEThis report describes a statistical estimate of the risk of avehicle rolling over when involved in a single vehicle accident.With increasing sales of utility vehicles, vans, and trucks, morevehicles with higher centers of gravity are on the road. It isimportant for NHTSA to better understand the relationship of thevehicle design factors and the driver and the environment in arollover accident. This report is part of that effort tounderstand this complex mix of factors that can contribute tosuch an accident.This effort was sponsored by the U.S. Department ofTransportation, National Highway Traffic Safety Administration,Office of Research and Development. The support and technicaladvice of Dr. H. Keith Brewer, Chief of the Light VehicleDynamics and Simulation Division and Anna Harwin of his divisionare gratefully acknowledged.111
METRIC CONVERSION FACTORS-23Approximate Conversions from Metric MeasurApproximate Conversionsto Metric Measures-22Symbol When You Knowhen You KnowMultiply byTo FindSymboMultiply byTo Find-21LENGTH-20LENGTHinchesfeetyerdimiles metersm-18kilometerskmmetersmm*square materscm*square centimeterssquare meterssquare 0.040.43.31.10.6-17kmAREA-16square inchessquare feetsquare yardssquare milesacresm*km*ha-14cm*m*km*hasquare centimeterssquare meterssquare kilometershectares (10.000 m*)0.161.20.42.5square inchessquare yardssquare miles eras-13MASS (weight)-12MASS (weight)ouncespoundsshort tons280.460.9gramskilogramstonnestonnes (1000 dsshort tons-10(20001b)VOLUMEfluid s0.963.80.03cubic feat0.47pintsquartsgallons6/9 (aftersubtractingVOLUME— 9300.24cups0.76cubic yardsmillilitersliterslitersmlcubic 8mlml1liters-— 67111literscubic meterscubic metersmlml CCelsiustemperature4 C0.032.11.060.269/5 (thenadd 32)Celsiustemperaturefluid ouncespintsquartsgallonscubic leetcubic yerdsFahrenheittemperature—3—inches361.3cubic metersTEMPERATURE (exact)— 5—TEMPERATURE (exact)Fahrenheittemperature32)m (exactly). For othor execi conversions and mora detail tables tseOF-4021—r '1il321400i1il ii98.61208011 Ji— r—n1-20200 C—i lf ' i' ' ' — 1—40bl. 286. Units ot Weight and Measures. Price Z25 SD Catalog86.1i I i iIII4060i37
TABLE OF CONTENTSSectionPage1.0BACKGROUND12.0TECHNICAL APPROACH22 .1CARDf ile ACCIDENT DATABASE22.2DATA STRUCTURING62 .3COMPUTER TECHNIQUE83.0METHODS94.0RESULTS134.1LOGISTIC REGRESSION134 .2GRAPHICAL RESULTS184.3RELATIVE STRENGTH OF MODEL COEFFICIENTSWHEN APPLIED TO DATA5.0CONCLUSIONSAPPENDIX A-SOMEAPPENDIXB-EXAMINATION OF THE LOGISTIC MODELAPPENDIXC-REFERENCES35INITIAL VARIABLE SELECTIONFURTHER EXPLORATIONSRURAL VARIABLE27A-lB-lOF THE URBANC-lR-l
LIST OF FIGURESFigure1.PageACTUAL VERSUSPREDICTED ROLLOVER RATESFOR 11-FACTOR BASIC MODEL (11F)2.ACTUAL VERSUSPREDICTED ROLLOVER RATESFOR SEVEN-FACTOR BASIC MODEL (7F)3.ACTUAL VERSUSACTUAL VERSUSFOR MODEL5.FOR MODEL6.23PREDICTED ROLLOVER RATES11F-SFACTUAL VERSUS22PREDICTED ROLLOVER RATESFOR MODEL 11F-SF-WB4.2124PREDICTED ROLLOVER RATES11F-WB25ACTUAL VERSUSPREDICTED ROLLOVER RATESFOR MODEL SF ONLYVI26
LIST OFTABLESTable1.PageSUMMARY OF CARDfile STATE CRASH EXPERIENCE(1983-1985)32.CARDfile DATA STIC REGRESSION MODELS7FOR ROLLOVERPROBABILITY CONDITIONAL ON SINGLE VEHICLEACCIDENT146.MODEL DESCRIPTION167.MAKE/MODELS CONSIDERED IN ROLLOVER STUDY198.NOMINAL VALUESFOR VARIABLES ANDSPECIFICATIONS FOR CASES ONE,TWO, AND THREE.299.DISTRIBUTION OF p VALUES:CASE 13010.DISTRIBUTION OF p VALUES:CASE 23111.DISTRIBUTION OF p VALUES:CASE 33212.MEAN PROBABILITIES BY MAKE/MODEL FOR CASES1,2,AND 334vii/viii
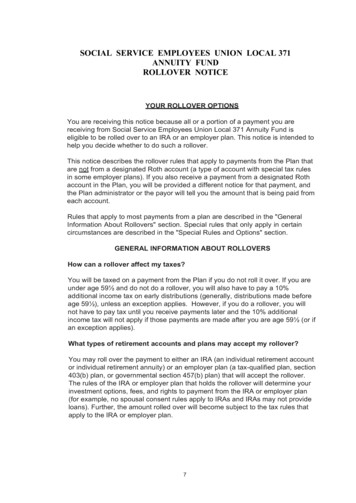
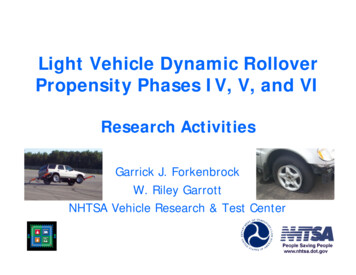
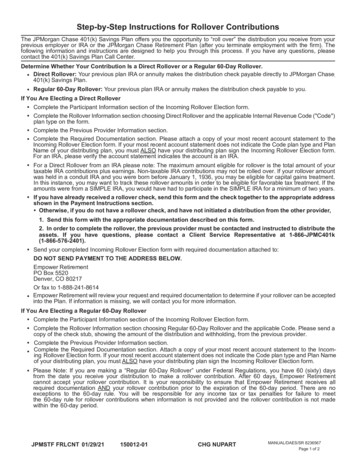
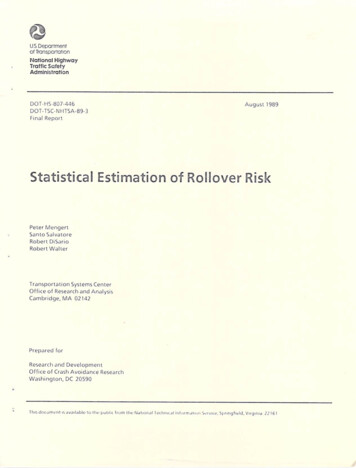
EXECUTIVE SUMMARYThe purpose of this paper is to determine the probability of arollover (RO) in a single vehicle accident (SVA) as a function ofboth accident and vehicle variables.The method used was theanalysis of 39,956 accidents in the states of Texas, Maryland,and Washington (of these, 4910 accidents were rollovers). Theanalyses used 40 make/models of both passenger cars and utilityvehicles.* Using logistic regression techniques, mathematicalmodels were developed relating vehicle factors, includingwheelbase (WB), and stability factor (SF) (one-half track widthdivided by center of gravity height), and accident factors(driver and environment) to rollover probability. These modelscontained between 7 and 11 predictor variables (see Table ES-1).The results of the analyses were examined at the accident level(predicting rollover versus nonrollover) and at the make/modellevel (comparison of predicted and actual rollover rates for eachof the 40 make/models).Both levels of analysis are summarizedbelow.Accident LeveloThe vehicle stability factor and land-use variable(urban/rural) are important predictors of whether ornot the accident resulted in rollover.Other variablessuch as the driver's age and sex contribute less topredicting rollover.oThe predictive power of the stability factor changedlittle with the inclusion or exclusion of all non-vehicle, variables including the urban/rural variable,indicating that the effect of SF is not due toconfounding with any of these variables.Make/Model Levelor2 (an index of the agreement between the actual and(model predicted rollover rates) exceeds 0.90 with thestability factor in the regression model (see FigureES-1).oThe r2 drops to 0.53 without the stability factor (seeFigure ES-2).*Note:The term "make/model" refers to vehicle type, while"model" alone will refer to a statistical or mathematical model.IX
TABLEES-1.VARIABLESINCLUDED IN 11-FACTOR MODELVariableDescriptionStability Factor (SF)1/2 Track width/centerof gravity heightWheelbase (WB)Distance between frontand rear tiresRuralAccident occurred inrural vs. urban settingDurbanRural variable presentvs. missingCurveAccident occurred onstraight vs. curved roadDriver ErrorError vs.StableTracking vs. skidding,spinningno errorDriver age less than 25Youthvs.Alcohol and Drug Use25 and olderDriver under theinfluence, vs. notBeltSeat belt used vs.usedSurfRoad surface dry vs. wet,snow, icexnot
ACTUAL(l.iiO.iO0.450. 400.350.300.25lK0.20yf0.15hV.V.U. 10viit;n0. U5II»IIwc0(l. 00t-i--O.'MII. u(l0.000.12(I. IS(l.200.240.2011.32(I.3C(1.40(1.440.4Urill- III CTFIGURE ES-1.ACTUAL VERSUS PREDICTED ROLLOVER RATES FOR BASIC 11-FACTORMODELINCLUDINGSF
ACTUAL0. Ml0.45(1.4(10.3b0.300.2bII. 20It. I!2]II0.05K0. 10M iUmixBHCU0.0(1 -«--I'll. 0.3C0.33I'llKIUCTFIGURE ES-2.ACTUAL VERSUS PREDICTED ROLLOVER RATES FOR BASIC 11-FACTORMODEL EXCLUDING SF
oThe importance of the stability factor is enhanced atthe make/model level, whereas the importance of theland-use variable is reduced.oNonvehicle factors are of little use for predictingrollover at the make/model level.From these results, it was concluded that a mathematical modelcan be constructed that is an accurate predictor of theprobability that a vehicle will roll over during a single vehicleaccident. At both the accident and make/model level, the derivedmodel was highly influenced by vehicle geometric factors,especially the stability factor. Other variables such as whetherthe accident occurred in the city or country or if a driver errorwas involved were also of importance, especially at the accidentlevel.However, the effect of these environmental or drivervariables was diminished at the make/model level.xiii/xiv
TECHNICAL SUMMARYPROBLEMStudies have indicated that vehicles with a high center ofgravity and narrow track width are involved in a disproportionatenumber of rollover (RO) single vehicle accidents (SVAs).1'2Utility vehicles intended for off-road operationcharacteristically incorporate such geometric design features.The popularity of the utility vehicle, which can be driven offroad as well as on-road, has prompted both Congressional andNational Highway Traffic Safety Administration (NHTSA) action tofurther examine this issue.Studies of the risk of vehiclerollover use accident data to compare utility vehicles withpassenger vehicles. These studies attempt to constructmathematical models using the accident data that predict avehicle's rollover potential during a single vehicle accidentbased upon vehicle properties and accident variables.* Thesemodels are usually developed with linear regression techniques.The most recent studies by Robertson and Kelly1 and by Harwin andBrewer,2 using linear regression techniques, developed modelsthat indicated that vehicle factors are the most importantindicators of rollover potential in a single vehicle accident.Specifically, the stability factor (SF), which is defined as theratio of one-half the tread width to the center of gravityheight, was most highly correlated with rollover rates in singlevehicle accidents.The addition of other "accident factors"relating to the accident environment or the driver did notsignificantly improve the ability of the model to predictrollovers.NHTSA's review of these results suggested thatimprovements could be made in these analyses by the use oflogistic regression techniques. This paper reports on theresults of that analysis.APPROACHThe U.S. Department of Transportation, Research and SpecialPrograms Administration, Transportation Systems Center (TSC)performed logistic regression analyses using the accident datapreviously analyzed by Harwin and Brewer. The accident data wasderived from the Crash Avoidance Research Database (CARDfile)which contains the police accident reports from six states -*This is usually an estimate of the fraction of single vehicleaccidents which result in rollover. All the analyses in thisreport are based on single vehicle accidents and rollovers as asubset of these accidents.xv
Texas (TX), Maryland (MD), Washington (WA), Indiana (IN),Michigan (MI), and Pennsylvania (PA). From over two millionaccidents in TX, MD, and WA (1983 to 1985), 39,956 single vehicleaccidents were analyzed. This analysis used 40 make/models ofutility vehicles, and domestic and imported passenger cars withknown stability and other vehicle factors (see Table TS-1*).Inthe data-set, the stability factor varied from 1.01 to 1.57.**The data contained 4910 rollovers.The ratio of ROs to SVAsvaried by make/model from 0.021 to 0.489. Using both theStatistical Analysis System (SAS) and the Biomedical Data Package(BMDP) at the National Institutes of Health computer facility, weperformed logistic regression analyses with single vehicleaccidents which involved the selected vehicles and their relatedaccident variables. Mathematical models were developed thatcontained both vehicle factors (stability factor and wheelbase)and accident variables relating to the driver, the vehicle, andthe environment. The complete list of CARDfile variables andthose used in the analysis can be found in Table TS-2. During apreliminary analysis, those variables that were most highlycorrelated with rollover were identified.These variables werethen used in various combinations to predict the actual rolloverexperience during a single vehicle accident.RESULTSThe main results of the logistic regression analyses are given inTable TS-3.These results show that at the accident level thevariables which are very useful in predicting the probability ofrollover in single vehicle accidents are SF, wheelbase, land-use(rural/urban), and driver error. However, the primary importanceof the stability factor is seen as the result of severalobservations:1.Leaving SF and WB out of a large 11-factor modellowered the likelihood ratio (as measured by the LISexplained in Section 3) more than leaving out allvariables except SF (compare LIS of 781 for the formercase with 1109 for the latter case).2.Leaving SF out of the 11-factor model lowered the LISmuch more than leaving out WB (LIS 1478 vs.LIS 1856).*Note: Tables TS-1, TS-2, and TS-3 are identical to Tables 3, 4,and 5, respectively, in the body of this report.**These values were obtained from References 2 and 7.xvi
ro z -coo t a i o v K i N m — o m i n — e o i n f O M f l f n o - - ocacu(T «Tr\oeor.vOff fr,i — in -* onooinvfio«m»mm«-ffvo N'rinMn flinin'rWMn- » oir)ij)if)niNmo(vnrNNv m w m m m m m o - « - » o - « « o o o o o o o o o o o o - * o « o o « « n « m n n n - mm'rcovoo* v im* X(DOetaj avo«vac inoaioo(MONvincoNMnoinoTa)Noaoo rNton- inoooa 4l — cmncm u.- cm- — — m cm cm h in « im s r m inn m — w-«—-moinvwin-OT-iomTON»»»»cm cm-»-. cm *uicr icr imw«- cj j enCOTti* oocnr-sor otnM incM — — mM)mmcMCMOOovo — — mcMC ooca.*M c*m — r inr ooootn C 9O OU U-»oo oo — — ncmm n oom n m v-s-in cr oom o nm —-«-«cmcm«- cm o in rr -* m -« co in cm m o co co hcm—cm inm m in cmtoi- IONivurg — a: O Oto aa« 0inC09i(dlOM)- (DQC0(0 ANNNaOOOONNW(VIN;;ONO9iNMnOC0Ouloo- oo— oomI r n f n m r n i n i n i n T r - ' r ' r v - ' r v - v ' r r n r n i T i m T r - — cm cm — cm cmvCOortCOff NO 00" ( l Ofl*CftC ffiO * 'TWrWCMMMM»llrtWNff NWin(iniO ONC Sa . . . * .CM* ANOOIMMI7iC' OCOOCOONfflff «VOOOOOC C V CACOCOOaCOvOi«N r7 einvp"0 —.-. -.CM CMI CMr" CM CM CM CM CM CM CM CM CM CM CM CM CMCMCMrnrncMmcMCMmcMCMCMCMCMCMCMCMrnmmrnrrti QCM 04l CM1-iftm\oo N-.NNNOoooooNNNNNNNNrnmeoooooNN«awm NMn' inoH* «XHaiC c./NU)0\ONNOSN-- - --0»fflfflffl- « ' «-000000-HO\oaiOOOON«0(MCMCMCMCMCMCMOJCMCMCMCMCM — — — — CUCMCMCMCMCMCMCMCMCMCMCMCg CM CMCMCMCMCMCMCM CO VI41H1COH—41 ininr*.Mninoo,«,ojiff«c a»mooooooooNr -rvr ' r '00oooro-«ininminm — . .# . . ON.mm»TOoooo- v rsfNCO«g»a)coco8"TVNNOowco«v-wrrmw —coovooooo onoooo«io ooooooo----oo--o o cr a* r» cr« r u1 c—cj: w-r t—tv, . .».».».».*.-. —0000000000Wi-li.fSto wmmr co co iiiiiiovm en ooNrnmrnmcMr. — o o o o & moo oo co oo oo r - r- r r cr o* cr« cr oco (v cooor cof NCOCO c cococoooo3r r jjr r Nh-h-r rvrv.f -Ni (,»f co i i i iix.o ' i(T nrtcr cvcf o o o -j— c c o chc cr o jcr*o c cACf*o CNC c cr» c cr cr»j»jj-j «'4- —j- rHCO"v. -«4i 4l axJCTJa: anomoCCcc a:souoon-I jjouj «occ» m i : oco— uUJr-Oi —-J zo»-oS* o v x x j cc 111 003 up. a. a.uIll ui IDU1UUJ5 5 3 cc r- - to co cc goLU CC C00 OS ON33CycSccccujoo:ao"NrnvifioNOji'aot xi- s — cvirnvinvorwcoo o — CMmTrinor oooso — CMmvinMjr-oocvo — . * — — CMCMCMCMCMCMCMCMCMNmmmrnmrnrrirnmfn'ir u o zXV11
TABLE NGE.56SFALC-DRUGVARIABLEVARIABLE 3232412754413065 1.57:83.5i121.4:CARDFILE SUBCATEGORIES INCLUDEDDICHOTOMIZED MODEL VARIABLESNO INDICATION, MISS, UNK.DRY, MISS, UNKNET, SNOW/ICE, OTHERICYNO AVOIDANCE, MISS, UNK,AVOID VEHICLE, PEDESTRIAN, ETCLEVELGRAOEON ROADOFF ROADURBANRURALFEMALEMALESTABLENONSTABLENO AVOIDAVOID!!!!i!ii!!i::!NO USEUSENO OL, DRUGSNOT USED, NOT EQUIP, MISS, UNKUSEDCLEAR, CLOUDY, MISS, UNKRAIN, SNOW/ICE, OTHERSTRAIGHT, MISS, UNKCURVEDMISSING, UNKURBAN, RURALNONE, MISS, UNK,SPEEO,SIGN/SIGNAL, PASSING,ASLEEP,ETC.LEVEL, MISS, UNKGRADEON ROADWAY, MISS, UNKON SHOULDER, OFF ROADWAYURBAN, MISS, UNKRURALFEMALEMALE, MISS, UNKTRACKING, NOT APPLICABLE, MISSING, UNKSKIDDING, SPINNING, JACKKNIFING25 ANO OVERLESS THAN 25SO.147102.817.3
TABLETS-3.LOGISTIC REGRESSION MODELSFOR ROLLOVER PROBABILITY CONDITIONAL ONSINGLE VEHICLEMODEL FACTOR1 SFSF ONLY7F7F 2).456340(19.00)*****-.030302(8.437)-.029990 10.83)*****-3.965900 ***-4.9038002 WB3 RURAL4 OURBAN5 CURVE6 HERR7 STABLE8 YOUTH9 ALCAD10 *********** **********1109LIS (See Text).9448.907r-squared (Make/7.318400(22.37)6.598100(29.36) 32.56)4.620500***************CONSTANTACCIDENT11 .25)11F-SF-MB*********** 0(8.95)4.9588(33.41).9296Model Based)1478190718327811856
3.Although SF and WB are collinear (r 0.64) and tend toproxy for each other in predicting rolloverprobability, there is evidence in the coefficients thatthe major predictive power is in SF. This is becausethe coefficient of SF shrinks by only 17% upon theintroduction of WB (from -4.934 to -4.090) while thecoefficient of WB shrinks by almost a factor of 3 onthe introduction of SF (from - 0.0805 to -0.0281).4.The coefficient of SF does not shrink on theintroduction of all nonvehicle variables.It changesonly by a trivial amount: from -4.904 to -4.934.A regression analysis that excluded Texas accidents (56% of thecases) indicated that the importance of the land-use variable(rural/urban) was underestimated in the previous models as Texashad no land-use variable (see Appendix C). This resultindicated that land-use may be as important as SF in predictingrollover at the accident level. However, of more importance inthe evaluation of SF as a predictor of rollover is the fact thatthe regression coefficient of SF changed little when land-use wasadded to or taken out of the model. Moreover, the predictivecapability of land-use is greatly reduced at the make/model leveland will not affect the conclusions given below.With regard to the performance of the models with predicted andactual rollover rates aggregated to the make/model level, theprimary importance of stability factor is accentuated.1.The vehicle make/model r2 of the model with SF only isfar higher than that for the model with all otherfactors (compare 0.907 to 0.5272).2.Several plots discussed in the body of the text showthat any model containing stability factor predictsrollover rate at least fairly well and any model whichdoes not contain SF predicts rollover rate verypoorly.3.The larger models containing both WB and SF lead toexceptionally accurate predicted rollover rates.When the distributions of predicted probabilities based on actualand nominal data are observed, there is confirmation of theimportance of SF in predicting rollover rate. There is alsoevidence that with regard to the influence on predicted rolloverrates, the nonvehicle variables are remarkably well balanced overmake/models.xx
1.0BACKGROUNDRecent studies by Robertson and Kelly1 and Harwin and Brewer2using statistical regression analysis, indicated that a vehicle'spropensity to rollover is directly related to a "stabilityfactor" (SF).The stability factor is defined as the ratio ofone-half the track width to the center of gravity height.Based partly on the Robertson-Kelly study, Congressman T. Wirth(D-CO) petitioned the National Highway Traffic SafetyAdministration (NHTSA) to establish a rule, based on thestability factor, to limit a vehicle's rollover potential(Congressman Wirth proposed a stability factor of 1.2 as beingthe minimally acceptable level). He also requested that NHTSAfurther study, this issue, open a defect investigation, and warnthe public of this potential problem. The major parts of thispetition were denied, based in part on the limitations of theRobertson-Kelly study as well as the need for more evidence ofthe connection between rollover and stability factor and the needto study the role of other vehicle parameters in this question.The Robertson-Kelly limitations included the use of 14make/models which tended to cluster the data and the use of theFatal Accident Reporting System (FARS) data which made theresults applicable to fatal accidents only. Harwin and Brewerimproved on the Robertson and Kelly study by using 40 make/modelsand approximately 40,000 single vehicle accidents (SVAs),including but not limited to fatals, from the Crash AvoidanceResearch Database (CARDfile). Their results indicated a strongrelationship between the stability factor and rollover accidents.An internal NHTSA review agreed that this study was a significantimprovement over the previous study, but suggested that thenumber of observations was insufficient for the number ofpredictors that were tested. It was also suggested that alogistic regression be performed where each single vehicleaccident would be treated as an observation rather than thevehicle make/model as the observation. The dependent variablewould be rollover.Logistic regression lends itself well toanalysis when using a dichotomous dependent variable such asrollover/nonrollover.NHTSA requested that TSC enhance the Harwin-Brewer study byperforming the logistic regression. This report details theresults of an analysis of the relationship of the stabilityfactor to rollover propensity using logistic regression analysisat the individual accident level.Note:The term "make/model" refers to the vehicle type, while"model" alone will refer to a statistical or mathematical model.
2.0TECHNICAL APPROACHThe approach that TSC used was to restructure the Harwin-BrewerCARDfile data on single vehicle accidents so that a logitanalysis could be performed at the accident level. The HarwinBrewer database that contained all SVAs, including rollovers,from the states of Maryland and Texas for 1984 and 1985 andWashington for 1983, 1984, and 1985 was used. Other predictorswere also used in addition to the stability factor. Theseincluded those available from CARDfile relating to thedriver,the vehicle, and the accident together with other variablesrelating to the vehicle geometry.2.1CARDfile ACCIDENT DATABASEThe Crash Avoidance Research Database (CARDfile) was developed byNHTSA to define problem areas and support research in crashavoidance. The police accident reports from the states of Texas,Maryland, Washington, Pennsylvania, Indiana, and Michigan areassembled into a common format in a Statistical Analysis System(SAS) structure.CARDfile had approximately four millionaccidents from these states for 1983 through 1985 that wereavailable for analysis (see Table 1).(CARDfile for 1986 is nowavailable and will be used in future analyses.) The CARDfiledatabase is subdivided into three subfiles relating to theaccident, the driver, and the vehicle.The data elements in eachof these files is shown in Table 2. Another study has indicatedthat CARDfile is representative of both national demographics andthe accident experience.3For a more detailed description of theCARDfile database, the reader is referred to the studies byHarwin and Brewer2 and Edwards.4The SVAs for Texas and Maryland for 1984 and 1985 and Washingtonfor 1983 through 1985 were extracted from CARDfile for 40make/models.These make/models were selected based on theavailability and range of their stability factors and torepresent a selection of passenger cars and utility vehicles,both domestic and imported. The selected makes and models, theirgeometry and stability factors, and the counts of SVAs of eachvehicle from the selected states for each year are shown in Table3, along with the number of rollovers for each vehicle.The 40make/models were composed of 20 passenger cars and eight utilityvehicles.Also included were 12 vehicles built on the identicalbody-line that also share many common body parts such as theChevrolet Citation and the Pontiac Phoenix. The model yearsranged from 1972 through 1985, and the stability factor from 1.01to 1.57. The final data-set contained 39,956 SVAs of which 4910were rollovers (ratio of rollovers to SVAs 0.1229).On a
TABLE 1.SUMMARY OF CARDfile STATE CRASH EXPERIENCE als
TABLE 2.CARDfile DATA ELEMENTSAccident FileCase ID (CASE)State of Crash (STATE)Day of Crash (DD)Month of Crash (MM)Year of Crash (YY)*Accident Type (ACC-TYPE)Time of Crash (TIME)*Roadway Alignment(RD-ALIGN)*Weather Conditions (WEATHER)*Road Surface (RD-SUR)*Land-Use (LAND-USE)Primary Impact (IMPACT 1)Crash Severity (ACC-SEV)Light Conditions (LIGHT)Relation to Intersection (INT-REL)*Roadway Profile (RD-PRO)Roadway Separation (RD-SEP)*Number of VehiclesInvolved (NO-VEH)of PrimaryImpact (IMPILOC) LocationIntersection Characteristics(INT-CHAR)Vehicle FileCase ID (CASE)Vehicle Number (VEH)Vehicle Impact Number(VATYPE)Vehicle ID Number (VIN)Component Failure (FAILCOMP)Fatally Injured OccupantsState of Crash (STATE)*Make/Model Code (MAKE-MOD)*Model Year (MOD-YR)Vehicle Type (VEH-TYPE)*Pre Crash Stability (PRE-STAB)*Avoidance Attempt (AVOID)Uninjured Occupants (UN-INJ)(FATAL)Possible Injury Occupants(POS-INJ)Unknown Occupant InjurySeverity (UNK-OCC)Incapacitating InjuryOccupants (INCAP)Nonincapacitating InjuryOccupants (NONINCAP)Driver FileCase ID (CASE)State of Crash (STATE)Vehicle Number (VEH)*Driver Age (AGE) Restraint Use (RESTRAIN)Helmet Use (HEL-OP) Driver Sex (SEX)*Driver Error (DR-ERROR)*Alcohol/Drug Use (ALC-Drug) Indicatesuse in logistic regression
0§—to ffiv 2'T, :!n. 0 '1'rt"" eotncfONinmo — — octiNO-T isN cMri-m- nNmoNrrNN7miMmmmmmo-- o«-oooooooooooo- o-oo--.NW(ij(ijN«(MmcmV»rt) Occ cca . u u- cmr-CM« cm — -. m cm cm -i— in — cm \t t min— m co in v cm in -« o tt «om ScmNfflHW -*—iCM CM- - CM - IM)noicr IONimin — ccj j o C CO41Jjcou o.cocniv.vo atoM2toCM»- rnM)mrocMCMOcoTro mcMONOOco- o rn-Hr inr .eoooinooco-«;
1. actual versus predicted rollover rates for 11-factor basic model (11f) 21 2. actual versus predicted rollover rates for seven-factor basic model (7f) 22 3. actual versus predicted rollover rates for model 11f-sf-wb 23 4. actual versus predicted rollover rates for model 11f-sf 24 5. actual versus predicted rollover rates for model 11f-wb 25 6.