Transcription
European Journal of 9ORIGINAL CONTRIBUTIONAssociations of long chain polyunsaturated fatty acids with bonemineral density and bone turnover in postmenopausal womenOrlagh Feehan1 · Pamela Jane Magee1 · Laura Kirsty Pourshahidi1 · David John Armstrong1,2Mary Martina Slevin1 · Philip James Allsopp1 · Marie Catherine Conway1 · J J Strain1 ·Emeir Mary McSorley1·Received: 30 September 2021 / Accepted: 7 June 2022 The Author(s) 2022AbstractPurpose The immunomodulatory properties of n-3 long chain polyunsaturated fatty acids (LCPUFA) are reported to reducebone loss through alteration of bone remodelling and n-3 LCPUFA, therefore, may benefit bone health in post-menopausalwomen, a vulnerable group at high risk of osteoporosis.Methods Measures of bone mineral density (BMD) were determined using dual energy X-ray absorptiometry (DEXA)in 300 post-menopausal women. The bone turnover markers osteocalcin (OC), C-terminal telopeptides of type 1 collagen (CTX) and total alkaline phosphatase were quantified in serum along with urinary creatinine corrected deoxypyridinoline (DPD/Cr) and CTX/Cr and the CTX:OC ratio calculated. Total serum n-6 PUFA (LA AA) and n 3 LCPUFA(ALA EPA DPA DHA) were measured and the n 6:n 3 ratio was calculated.Results Mean (SD) age and body mass index (BMI) were 61 (6.4) years and 27.4 (4.8) kg/m2, respectively with participantsbeing 12.6 (7.6) years post-menopause. Multiple regression analysis identified no association between n-3 LCPUFA andany of the measures of T-score or BMD albeit a significant positive association between total n 3 LCPUFA and femurBMD (β 0.287; p 0.043) was observed within those women with a low n 6:n 3 ratio. There was a significant inverseassociation between ALA and urinary DPD/Cr (β 0.141; p 0.016).Conclusion A favourable low n 6:n 3 ratio was associated with higher femur BMD and a higher n 3 LCPUFA (ALA)was associated with lower bone resorption. These results support a beneficial role for n 3 LCPUFA in reducing postmenopausal bone resorption and favourably influencing BMD.Trial number & date of registration ISRCTN63118444, 2nd October 2009, “Retrospectively registered”.Keywords LCPUFA · Bone mineral density · Postmenopausal women · Bone resorptionIntroductionOsteoporosis is a chronic debilitating condition characterisedby a decrease in bone mineral density (BMD) and alteredbone microarchitecture, which can lead to structural fragilityand a subsequent increased risk of fracture [1, 2]. Osteoporosis affects 3 million people in the United Kingdom (UK)and annually over 8.9 million osteoporotic fractures occur* Emeir Mary McSorleyem.mcsorley@ulster.ac.uk1Nutrition Innovation Centre for Food and Health (NICHE),Ulster University, Coleraine BT52 1SA, UK2Department of Rheumatology, Altnagelvin Hospital, WesternHealth and Social Care Trust, Londonderry BT47 6SB, UKworldwide [3, 4]. Postmenopausal women are at increasedrisk of developing osteoporosis and associated fractures asa result of the natural decline of oestrogen after the menopause [5]. Declining oestrogen concentrations increase boneresorption by enhancing osteoclastogenesis and also reducenew bone formation activity by osteoblasts, causing a netloss of bone tissue [6]. Greater expression of pro-inflammatory cytokines as seen after menopause and in later ageis one possible contributing factor in the development ofosteoporosis. Hormones (such as oestrogen), pro- and antiinflammatory cytokines play an important role in regulating osteoblast and osteoclast differentiation and activity. Abalance of these systems is needed to prevent the development of osteoporosis [7, 8]. It has been postulated that n 3LCPUFA can up-regulate the absorption of calcium from13Vol.:(0123456789)
European Journal of Nutritionthe intestine and reduce the production of prostaglandin E2(PGE2) which is a key eicosanoid involved in the modulation of inflammation [9]. Elevated concentrations of P GE2can lead to a reduction in the production of osteoprotegerin(OPG), an important osteoclastogenesis inhibitory factor expressed by osteoblasts. This production in turn canincrease the expression of receptor activator of nuclear factorkappa-Β ligand (RANKL) as a result of decreased OPG [10]leading to overall negative effects on bone health.Nutrition is a modifiable factor important in optimisingbone health [11] with well-defined roles for protein, calcium and vitamin D in reducing the risk of osteoporosisand fragility fractures post menopause [12]. Recent evidencesuggests that n 3 long chain polyunsaturated fatty acids(LCPUFA) may benefit bone health and prevent bone loss[13–16]; however, there is limited evidence in postmenopausal women. Furthermore, the majority of research to datehas focused on dietary intakes of n 3 LCPUFA rather thanthe biological status of n 3 LCPUFA in postmenopausalwomen. Dietary n 3 LCPUFA have been proposed to benefit overall bone health [15] and have a role in reducing therisk of hip fracture in all age groups [17]. A higher intake oftotal n 3 LCPUFA and fish have been positively associatedwith BMD [17–19] and a reduced risk of hip fracture [20]as well as total fracture risk in postmenopausal women [11,21]. Positive associations between n 3 LCPUFA status,dietary n 3 LCPUFA and skeletal outcome measures suchas lumbar spine and femur BMD have been demonstrated inolder people and in postmenopausal women and are postulated to be owing to higher fish consumption [13, 22]. Totaldietary n 6 PUFA and the n 6:n 3 ratio have been shownto be negatively associated with spine and femur BMD incohorts of older adults [13, 23] and postmenopausal women[24] albeit studies were limited by use of a nutrient databaseor dietary records to quantify dietary n 3 LCPUFA intakerather than status [23, 24]. Relative amounts of n 6 andn 3 LCPUFA should be taken into consideration for overall health, with research suggesting a lower n 6:n 3 ratiocould be of greater benefit to bone health [23].Recent analysis of the UK biobank including 492,713adults showed a significant association between habitualfish oil supplement use and lower risk of both incident andrecurrent fractures [25]. A limited number of supplementation studies with n 3 LCPUFA have been conductedin postmenopausal women with the majority reporting aninverse association between n 3 LCPUFA and markers ofbone resorption including C-terminal telopeptides of type 1collagen (CTX) and urinary pyridinoline (Pyd), and othersreporting beneficial effects of n 3 supplementation on thebone formation markers bone-specific alkaline phosphatase(BALP) and osteocalcin (OC) in postmenopausal women[2, 26]. Although the reported changes were small in magnitude, they warrant further investigation particularly given13that inclusion of rich sources of n 3 LCPUFA, such as oilyfish, in the diet could be a simple effective dietary alterationin these women [26]. To date, the evidence is limited bysmall sample sizes and short study durations and researchis needed to further investigate this association betweenn 3 LCPUFA and BMD in post-menopausal women [27].Therefore, the aim of this study was to investigate the relationship between serum n 3 LCPUFA status with BMDand BTMs in a large cohort of postmenopausal women.Materials and methodsStudy designA convenient sample of a total of 300 non-osteoporotic postmenopausal women (45–75 years) were recruited to takepart in a study conducted in Ulster University to investigatethe effect of a combination of Aquamin and Nutraflora on bone health [28]. The current study utilises baseline datafrom this trial. Women were excluded if they were pre- orperi-menopausal, went through menopause earlier than40 years old, used medication or supplements known toaffect bone health, had osteoporosis or a medical conditionknown to affect bone health. Dietary intake of total dailyfish (g/day) and lifestyle factors were determined by a 4-daysemi-quantitative food diary and food frequency questionnaires. Food composition database Weighed Intake SoftwarePackage (WISP) (WISP for WINDOWS, version 3; TinuvielSoftware, Anglesey, United Kingdom) was used to analysethe dietary intakes. Information on total physical activity wasassessed by means of a shortened version of the InternationalPhysical Activity Questionnaire [29] and was representedas MET (metabolic equivalent tasks) hours per week. Participants also completed a questionnaire about past/currentmedical history. Ethical approval was received from UlsterUniversity Research Ethics Committee (REC/08/0083) andthe original study was registered as a clinical trial (www. contr olled- trials. com as ISRCTN63118444). The studywas conducted in accordance with the declaration of Helsinki and written informed consent was obtained from allparticipants.MeasurementsA non-fasted blood sample was collected from each participant. Duplicate weight (kg) and height (cm) were taken tocalculate body mass index (BMI) (weight (kg)/height (m)2).Lumbar spine and femur BMD (g/cm2) and T-scores weredetermined using dual energy X-ray absorptiometry (DEXA)(Lunar corporation, Madison, WI). BMD was recorded fromthe total hip or the femoral neck depending on which wasthe lowest value. According to the cut-offs established by
European Journal of Nutritionthe World Health organisation [30], osteoporosis is definedas BMD at least 2.5 SD below that of a healthy young adult(T-score is 2.5), osteopenia when the T-score is between-1.0 and -2.5 and a normal bone density value above 1.0.BMD was expressed to 3 decimal places and T-scores to1 decimal place according to the International Society forClinical Densitometry [31]. Diagnosis was made accordingto the site with the lowest T-score.Sample analysisBlood and urinary bone turnover markersBlood samples were collected from all participants for analysis. Serum bone formation marker osteocalcin (OC) (normalreference value: 26.5 (12.8–55.0 95% CI) ng/ml) and boneresorption marker C-terminal telopeptides of type 1 collagen(CTX) (normal reference value: 0.439 (0.142–1.351 95% CI)ng/ml) were measured using enzyme-linked immunosorbent assay (ELISA) (Immunodiagnostics Systems Ltd (IDS);intra-assay CV was 1.8% & 4.7%; respectively). Serum totalalkaline phosphatase was quantified by Roche Modular Analyser and expressed as a bone formation marker (u/L). Urinary bone resorption markers CTX (normal reference range:324 (121–874 95% CI) µg/mmol/Cr) and deoxypyridinoline(DPD) (7.56 (2.27)/7.94 (3.25) nmol DPD/mmol Cr) weremeasured using enzyme immunosorbent assay (EIA) (UrineCrossLaps EIA, IDS, intra-assay CV was 4.7% and UrineDPD EIA, Metra DPD EIA kit; Quidel, intra-assay CV was4.3%). Urinary CTX and DPD results were both correctedfor urinary concentrations of creatinine (Cr). CTX:OC ratiowas calculated. A high CTX:OC ratio means higher boneresorption relative to bone formation.Polyunsaturated fatty acid (LCPUFA) analysisSerum LCPUFA were quantified using an adaption of themethod by Folch et al. [32]. In brief, fatty acid methyl esterswere detected and quantified by gas chromatography–massspectrometry (7890A-5975C; Agilent) using heptadecanoic acid (C17:0) as the internal standard [33]. All analyticstandards were of 99% purity and purchased from SigmaAldrich. Serum LCPUFA status was chosen as a biomarkerto encompass recent LCPUFA concentrations of the triacylglycerol fraction. The individual n 6 PUFAs; linoleicacid; 18:2 n 6 (LA), arachidonic acid; 20:4 n 6 (AA) andthe individual n 3 LCPUFA, α-linolenic acid; 18:3 n 3(ALA), eicosapentaenoic acid; 20:5 n 3 (EPA), docosapentaenoic acid; 23:5 n 3 (DPA) and docosahexaenoic acid;22:6 n 3 (DHA) were quantified. Results were presentedas milligrams per millilitre (mg/mL). Total n 6:n 3 ratiowas calculated. A high n 6:n 3 ratio is considered lessfavourable as this means higher total n 6 PUFA relative ton 3 LCPUFA.Statistical methodsAll data analysis was performed using Statistical Package forthe Social Sciences (SPSS, IBM SPSS Statistics version 25).Nominal data were presented as mean (SD) and categoricalvariables presented as frequencies (n) and percentages (%).Data were tested for normality using Kolmogorov–Smirnovstatistic test and variables were transformed using the naturallogarithm where appropriate. Pearson correlation analysiswas conducted to test for correlation sample size.Primary analysis assessing the associations between thenatural logarithm of LCPUFA (total n 3, n 6, n 6:n 3ratio) with femur and lumbar spine BMD and T-score wasconducted using Spearman correlation analysis. Separatemultiple regression analysis was also performed betweenfemur and lumbar spine BMD and T-score as a dependentvariable and LCPUFA additionally adjusting for age, BMI,years’ post-menopause, total physical activity and smokingstatus as independent variables. Secondary analysis wasconducted to test for associations between the natural logarithm of LCPUFA (total n 3, n 6, n 6:n 3 ratio) andBTMs (OC, CTX, DPD/Cr, CTX/Cr, CTX:OC ratio) usingthe same statistical approach. Tertiles were created and participants were classified as having a high ( 6.5), medium(between 4.9 and 6.5) or low ( 4.9) n 6:n 3 ratio. Participants who were classified as having a low, medium orhigh n 6:n 3 ratio were selected as individual groups andregression analysis was repeated to take into considerationrelative amounts of n 6 and n 3 LCPUFA and to determine if n 6 or n 3 LCPUFA was associated with boneparameters and BTMs, after adjusting for independent variables. To better satisfy regression assumptions, we used thenatural logarithmic transformation of all markers in the models. As some of the T-scores were negative values, we addeda constant of 3 to each individual T-score data prior tonatural logarithmic transformation. All values presented intables are log transformed. Significance was set at p 0.05.ResultsBaseline characteristicsTable 1 summarises the characteristics for the 300 post-menopausal women. Data for BTMs and PUFA concentrationswere available for 299 postmenopausal women. Mean (SD)age and BMI of subjects were 61 (6.4) years and 27.4 (4.8)kg/m2, respectively. Mean values for years post-menopauseand physical activity were 12.6 (7.6) years and 25.4 (24.3)MET hours/week. Age of menarche and menopause were13
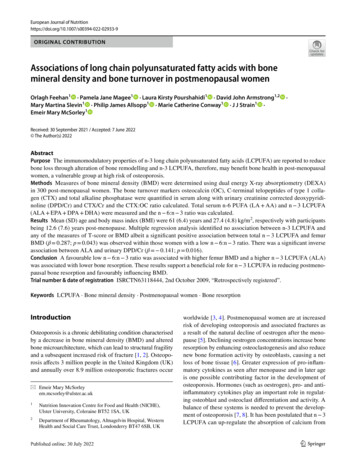
European Journal of NutritionTable 1 Descriptive(n eMean (SD)Age (years)Height (cm)Weight (kg)Body mass index (kg/m2)Years post-menopauseTotal physical activity (MET hours/week)Femur BMD (g/cm2)Lumbar spine BMD (g/cm2)Femur T-scoreLumbar spine T-scoren Normal based on T-score (%)n Osteopenia based on T-score (%)BTMsSerum CTX (ng/mL)Serum total alkaline Phosphatase (u/L)Serum Osteocalcin (ng/mL)Urinary CTX/Cr (ug/mmoL Cr)Urinary DPD/Cr (nmol DPD/mmol Cr)CTX:Osteocalcin ratioLCPUFATotal n 3 (mg/mL)Total n 6 (mg/mL)LA (C18) (mg/mL)AA (C20) (mg/mL)ALA (C18) (mg/mL)EPA (C20) (mg/mL)DPA (C23) (mg/mL)DHA (C22) (mg/mL)n 6:n 3 ratio61.0 (6.4)160.6 (6.2)70.7 (12.8)27.4 (4.8)12.6 (7.6)25.4 (24.3)0.895 (0.1)1.099 (0.1) 0.7 (0.9) 0.6 (1.2)127 (42.3)173 (57.7)n 2990.63 (0.20)77.3 (19.5)19.68 (0.22)309.2 (146.6)8.1 (2.3)3.4 (1.1)0.241 (0.110)1.328 (0.375)1.014 (0.304)0.313 (0.099)0.030 (0.017)0.071 (0.064)0.037 (0.015)0.103 (0.045)6.4 (3.3)SD standard deviation, MET metabolic equivalent of task, BMD bonemineral density, BTMs bone turnover markers, serum CTX serumC-terminal telopeptides of type 1 collagen, urinary CTX/Cr urinaryC-terminal telopeptides of type 1 collagen/creatinine, urinary DPD/Cr urinary deoxypyridinoline/creatinine, LCPUFA long chain polyunsaturated fatty acids, total n3 total omega 3, total n6 total omega 6,LA linoleic acid (18:2 n 6); AA, arachidonic acid (20:4 n 6); ALA,α-linolenic acid (18:3 n 3); EPA, eicosapentaenoic acid (20:5 n 3);DPA, docosapentaenoic acid (23:5 n 3); DHA, docosahexaenoicacid (22:6 n 3); n 6:n 3 ratio, total n 3:total n 6 ratio13.1 (1.5) and 48.5 (5.2) years. Mean (SD) total dietaryintake of fish was 30.2 (31.8) g/day. Mean (SD) dietaryintake of polyunsaturated fat was 11.43 (4.57) g/day.Correlation analysisA significant negative correlation was observed betweenthe bone resorption marker urinary DPD/Cr and total n 3LCPUFA (r 0.137; p 0.018) as well as with EPA(r -0.150; p 0.009) and DPA (r -0.118; p 0.042). A13significant negative correlation was observed between thebone resorption marker urinary CTX/Cr and AA (r -0.121;p 0.036) and ALA (r -0.123; p 0.033). There were nosignificant correlations observed between any measure ofBMD or T-score with n 6 or n 3 LCPUFA. There wasno significant correlation between any of the bone densityparameters and the n 6:n 3 ratio.CovariatesAge was a significant negative predictor of femur (β -0.221;p 0.012) and lumbar spine BMD (β -0.208; p 0.019)but not a significant predictor of BTMs. BMI was a significant positive predictor of femur (β 0.261; P 0.001) andlumbar spine BMD (β 0.327; P 0.001). BMI was alsoa significant negative predictor of serum CTX (β -0.324;P 0.001), serum osteocalcin (β -0.249; P 0.001) andurinary CTX/Cr (β -0.396; P 0.001). The number ofyears’ post-menopause was a significant negative predictorof serum total alkaline phosphatase (β -0.194; p 0.033)and total physical activity was a significant negative predictor of urinary DPD/Cr (β -0.124; p 0.044) but neitherwere significant predictors of bone parameters. Smokingstatus was a significant negative predictor of femur T-score(β -0.494; p 0.002) but was not a significant predictorof BTMs.Relationships between bone parametersand LCPUFAAssociations between LCPUFA and bone parameters areoutlined in Table 2. After adjusting for age, BMI, physicalactivity, smoking status and years’ post-menopause, the n 3LCPUFA, ALA, EPA, DPA, DHA and n 6 PUFA, AA, LAwere not significantly associated with the bone parametersfemur and lumbar spine BMD or with T-score (P 0.05).There was also no significant association observed betweenthe n 6:n 3 ratio and bone parameters after adjustingfor covariates. When split into tertiles according to then 6:n 3 ratio, a significant positive association betweentotal n 3 LCPUFA and femur BMD (β 0.287; p 0.043)within those with a low n 6:n 3 ratio was observed(Fig. 1).Relationships between BTMs and LCPUFAAssociations between BTMs and serum LCPUFA concentrations are summarised in Table 3. After adjusting for covariates, there were no significant associations observed betweentotal n 3 LCPUFA, EPA, DPA or DHA with any of themarkers of bone turnover or the CTX:OC ratio. There was asignificant inverse association between the n 3 LCPUFAALA and urinary DPD/Cr (β -0.141; p 0.016). Each
European Journal of NutritionTable 2 Associations between LCPUFA and femur and lumbar spine bone mineral density and T-score in postmenopausal women (n 299)Femur BMD (g/cm2)Lumbar spine BMD (g/cm2)Femur T-scoreMultivariate modelR2Std βp valueR2Std βp valueR2Std βp valueR2Std βp valueTotal n 3 LCPUFA (mg/mL)ALA (mg/mL) (C18)EPA (mg/mL) (C20)DPA (mg/mL) (C23)DHA (mg/mL) (C22)Total n 6 PUFA (mg/mL)LA (mg/mL) (C18)AA (mg/mL) (C20)n 6: n 3 0.018 0.0470.015 0.1260.1260.1290.1250.030-0.0130.033 0.0070.0500.0330.0190.066 0.1490.1510.1490.1490.1500.1530.1510.1570.1490.023 60.1260.1270.1290.1270.1340.1260.022 80.7620.7920.5420.3660.5500.1190.843Lumbar spine T-scoreStd β Standardised Coefficients Beta, BMD bone mineral density, LCPUFA long chain polyunsaturated fatty acids, total n3 total omega 3, totaln6 total omega 6, LA linoleic acid (18:2 n 6), AA arachidonic acid (20:4 n 6), ALA α-linolenic acid (18:3 n 3), EPA, eicosapentaenoic acid(20:5 n 3), DPA docosapentaenoic acid (23:5 n 3), DHA docosahexaenoic acid (22:6 n 3), n 6: n 3 ratio, total n 3:total n 6 ratio*Denotes significance (p 0.05). Multivariate model adjusted for age, BMI, physical activity, smoking status and years’ post-menopauseDiscussion10.9Femur BMD otal n-3 LCPUFA (mg/mL)Fig. 1 Significant positive association between total n 3 LCPUFAand femur BMD within those with a low n 6:n 3 ratio (n 100).Significance determined using Multiple regression adjusted for age,BMI, physical activity, smoking status, years’ post-menopause andn 6 PUFA (β 0.287, R2 with covariates only 0.122, total modelR2 with LCPUFA 0.162, p 0.043)unit increase in ALA was associated with a -0.141 mg/mLdecrease in urinary DPD/Cr. The n 6: n 3 ratio was notsignificantly associated with any BTMs. Furthermore, therewas no significant association between total n 6 PUFA, AAand LA and any of the markers of bone turnover. When splitinto tertiles for the n 6: n 3 ratio, a significant negativeassociation between total n 3 LCPUFA and osteocalcin(β -0.767; p 0.036) within those with a medium n 6:n 3 ratio was observed. There was a significant positiveassociation between total n 3 LCPUFA and urinary CTX/Cr (β 0.224; p 0.024) within those with a high n 6: n 3ratio.This observational study showed no significant association between n 3 LCPUFA and any of the measured boneparameters in this cohort of postmenopausal women; however total n 3 LCPUFA was shown to be positively associated with femur BMD in those postmenopausal women witha low n 6: n 3 ratio. Consideration should also be given toreducing n 6: n 3 ratio through improving dietary intakeof n 3 LCPUFA along with reducing n 6 PUFA. In termsof BTMs, a higher ALA concentration (n 3 LCPUFA) wassignificantly associated with lower urinary DPD/Cr, suggesting lower bone resorption. Overall, this study highlights thatincreasing n 3 LCPUFA may have benefits to bone healthin postmenopausal women, a vulnerable group at high riskof developing osteoporosis and associated fractures.A number of studies have investigated associationsbetween total PUFA status or n 3 LCPUFA dietary intakeand BMD in women [18, 19, 23, 34, 35] as well as in postmenopausal women [21, 22, 24, 36]. A significant positiveassociation between dietary n 3 LCPUFA and lumbarspine and femoral neck BMD has previously been reported[19, 22], but only after adjusting for covariates [22] including age, BMI, duration of menopausal state, grip strength,and intakes of calcium, vitamin D, vitamin K, n 6 PUFA,polyunsaturated fatty acid, serum N-terminal propeptide oftype I collagen, and urinary type-I collagen cross-linkedN-telopeptide. These studies assessed dietary intake of n 3LCPUFA rather than serum n 3 LCPUFA concentrationsand therefore were not able to verify the correlation betweenn 3 LCPUFA and BMD using a validated biomarker ofstatus [19, 22]. In a recent study in 301 Spanish postmenopausal women, a significant positive association between13
13Denotes significance (p 0.05). Multivariate model adjusted for age, BMI, physical activity, smoking status and years’ post-menopause*Std β Standardised Coefficients Beta, serum CTX C-terminal telopeptides of type 1 collagen, serum OC serum osteocalcin, urinary CTX/Cr urinary C-terminal telopeptides of type 1 collagen/creatinine, urinary DPD/Cr, urinary deoxypyridinoline/creatinine, CTX:OC ratio, serum C-terminal telopeptides of type 1 collagen:serum osteocalcin, LCPUFA long chain polyunsaturated fattyacids, total n3 total omega 3, total n6 total omega 6, LA linoleic acid (18:2 n 6); AA arachidonic acid (20:4 n 6), ALA α-linolenic acid (18:3 n 3), EPA eicosapentaenoic acid (20:5 n 3),DPA docosapentaenoic acid (23:5 n 3), DHA docosahexaenoic acid (22:6 n 3); n 6:n 3 ratio, total n 3:total n 6 ratio0.5110.4290.3620.3890.3780.3150.2870.5860.193 0.039 0.047 0.055 0.052 0.9160.9830.088 0.104 0.141 0.105 0.088 0.062 0.004 .702 0.031 0.0400.069 0.007 0.03 0.080 0.082 0.059 0.5650.7210.9660.6700.1740.5030.5280.5370.888 0.034 0.021 0.003 0.025 0.081 0.039 0.037 0.022 0.0150.0360.0200.031 0.063 0.071 0.024 0.1000.0980.0980.0980.0980.0980.0980.098Total n 3 PUFA (mg/mL)ALA (mg/mL) (C18)EPA (mg/mL) (C20)DPA (mg/mL) (C23)DHA (mg/mL) (C22)Total n 6 PUFA (mg/mL)LA (mg/mL) (C18)AA (mg/mL) (C20)n 6: n 3 ratio 0.010 0.056 0.008 0.022 0.012 0.0160.0030.003 0.001Std βP value R2Std βP value R2Std βP value R2Std βP value R2Std βP value R2Std βR2Multivariate modelSerum alkaline phosphatase (u/L)Serum OC (ng/mL)Serum CTX (ng/mL)Table 3 Associations between LCPUFA and bone turnover markers in postmenopausal women (n 299)Urinary CTX/CR (ug/mmol/L)Urinary DPD/CR (nmolDPD/mmol Cr)CTX:OC ratioP valueEuropean Journal of Nutritionplasma n 3 LCPUFA and spine and femur neck BMD wasobserved after adjusting for covariates [21]. It is importantto note that the Spanish cohort included osteoporotic womenwhereas anyone with osteoporosis was excluded from thisstudy making it more challenging to determine associationswith BMD. Nevertheless, taken together, this research supports a beneficial role n 3 LCPUFA for bone health in postmenopausal women.It has been postulated that higher intakes of n 6 PUFAresults in raised pro-inflammatory cytokine productionthat stimulates osteoclastic activity and thereby negativelyimpacting on bone health [37, 38]. Additionally, PGE2 produced from arachidonic acid (n 6 LCPUFA), is the mainprostaglandin involved with the bone turnover cycle withlower PGE2 promoting bone formation whereas higherconcentrations of PGE2 have been shown to inhibit boneformation [18, 39]. The optimal n 6: n 3 PUFA ratiofor favourable effects on bone health is currently unknown;however, a contemporary western diet high in n 6 PUFAand therefore a higher n 6: n 3 ratio, may not contain theoptimum amount of n 3 LCPUFA needed to benefit bonehealth [40]. It has been hypothesised that a balance betweenn 6 and n 3 LCPUFA is of greater importance for resultant health benefits than either class of PUFA by itself [41].This hypothesis has been supported in our study where inparticipants with a low n 6: n 3 ratio, a significant positive association between n 3 LCPUFA and higher femurBMD was observed. Overall, circulating n 6: n 3 ratiowas approximately 6:1 in the present study and this mightsuggest women in our cohort had a favourable dietary intakeof n 3 LCPUFA as the circulating ratio is relatively lowwhen compared to a western diet ratio of around 15–20:1[42, 43]. Previous studies in similar groups of older womenhave reported a range of dietary n 6: n 3 ratios, between4:1 to 8:3 [21, 22, 24, 34]. In the current study, dietary intakeof fish was 30.2 g/day which is equivalent to 211.4 g/week.Dietary intake of rich n 3 LCPUFA sources such as oilyfish can be low, with the current average adult intake in theUnited Kingdom 56 g/week which is 2.5 times lower thanthe current guidance of at least one portion of oily fish/week(140 g) [44]. Although fish intakes in our study were shownto be sufficiently high to meet the UK recommendation, datawere not available on the types of fish consumed and therefore it was not possible to quantify oily fish consumption.Fish intakes may have been primarily from non-oily fishsources. Furthermore, the inclusion of fish in the diet provides a significant source of protein and other nutrients withknown benefits for musculoskeletal health and although thisresearch was focused on PUFA it is plausible that other factors may be adding to the benefits seen. It has been reportedthat greater intakes of dietary n 3 LCPUFA or use of supplementation may be essential for resultant benefits to bonehealth [24]. Dietary recommendations for fish consumption
European Journal of Nutritionare based on the nutritional benefits of consuming fishespecially as a rich source of n 3 LCPUFA but also takeinto consideration the risks from potential pollutants [45].In addition, there are no recommendations for n 3 supplements [46] and therefore it is difficult to recommend anoptimal n 3 LCPUFA supplementation dose for benefit tobone heath.BMD and BTMs have been assessed as outcome variablesin several studies to investigate relationships between n 3LCPUFA and bone health. BTMs change more rapidly thanBMD and therefore BTMs can be used to observe responseto treatment before changes in BMD occur [47]. Althoughn 3 LCPUFA was not significantly associated with boneformation markers, ALA (n 3 LCPUFA) was shown to besignificantly associated with less bone resorption in the present study. Similar findings have previously been reported ina group of elderly patients in which no significant association between n 3 LCPUFA on the bone formation markerBALP but an inverse association with the bone resorptionmarker TRAP-5b [13]. Although intervention with a lowdose (1.2 g) of n 3 LCPUFA or fish oil showed no significant effect on bone formation markers [26, 48], intervention with 900 mg n 3 LCPUFA for 6 months led to asignificant decrease in the bone resorption ma
Package (WISP) (WISP for WINDOWS, version 3; Tinuviel Software, Anglesey, United Kingdom) was used to analyse the dietary intakes. Information on total physical activity was assessed by means of a shortened version of the International Physical Activity Questionnaire [29] and was represented as MET (metabolic equivalent tasks) hours per week. Par-