Transcription
Donoghue Forlines Dividend VIT FundClass 1 sharesClass 2 sharesDonoghue Forlines Momentum VIT FundClass 1 sharesClass 2 sharesAnnual ReportDecember 31, 20211-877-779-7462Distributed by Northern Lights Distributors, LLCMember FINRA
POWER INCOME VIT FUND (Liquidated)DONOGHUE FORLINES DIVIDEND VIT FUNDDONOGHUE FORLINES MOMENTUM VIT FUNDANNUAL LETTER TO SHAREHOLDERSBY JEFFREY R. THOMPSON, CHIEF EXECUTIVE OFFICER, PORTFOLIO MANAGERFebruary 16, 2022Dear Investors,We are pleased to address our annual letter to shareholders of the Power Income VIT Fund, theDonoghue Forlines Dividend VIT Fund, and the Donoghue Forlines Momentum VIT Fund (eacha “VIT Fund” and collectively the “VIT Funds”).The Power Income VIT Fund was liquidated in March 2021. During the year ended December31, 2021, the Donoghue Forlines Dividend VIT Fund, and the Donoghue Forlines Momentum VITFund had the following performance relative to their respective benchmark indices:Returns for Year ended December 31, 2021Dividend VIT FundS&P 500 Total Return IndexS&P 500 Value Total Return Index30.30%28.71%24.90%Momentum VIT FundS&P 500 Total Return Index29.66%28.71%Source: Ultimus Fund SolutionsStock markets continued to climb higher in 2021, hitting a series of all-time closing highs andending the year near a record. A robust economic environment provided tailwinds for all riskassets. While Covid continued to dominate headlines, concerns flipped to inflation and itspotential impact. With high inflation and strong job growth, markets prepare for the beginningof a shift toward less accommodative monetary policy.1
UPDATE ON THE POWER INCOME VIT FUNDThe Power Income VIT Fund was liquidated in March 2021.UPDATE ON THE DONOGHUE FORLINES DIVIDEND VIT FUNDTo better serve our shareholders, we enhanced the strategy used to manage the DonoghueForlines Dividend VIT Fund effective March 9, 2021. The major impact to the portfolio is thatsector allocations will be neutral to the benchmark. This will reduce active share and help theportfolio participate through rapidly changing sectoral trends. Additionally, we extended theduration of one of our tactical sell signals. This will allow half the portfolio to remain investedover time. These changes were implemented by changing the underlying index that theportfolio attempts to track from the W.E. Donoghue Power Dividend Index to the FCF RiskManaged Sector Neutral Dividend Index.The Donoghue Forlines Dividend VIT Fund’s primary objective is total return from dividendincome and capital appreciation. Capital preservation is a secondary objective of the fund. TheFund seeks to beat the total return performance of the both the S&P 500 Index and the S&P500 Value Index over a full market cycle on a risk adjusted basis.The Donoghue Forlines Dividend VIT Fund began the year in a bullish stance invested individend stocks. The Fund received no technical triggers the year. The Fund had quarterlyreconstitution and rebalanced on March 9, June 4, September 8, and December 6, 2021.The Donoghue Forlines Dividend VIT outperformed its benchmarks during 2021 in large partdue to the changes that we implemented during the year. We stayed invested for the entireperiod in a risk-on environment and our quantitative approach was able to provide positiveattribution. Our holdings in Energy, Financials, and Healthcare provided the largest contributionto return.Our focus continues to be risk-adjusted returns over a full market cycle. This is where we maymiss upside in some instances for the greater good of missing the catastrophic downside, whichcan be devastating to a pre-retiree or retiree.UPDATE ON THE DONOGHUE FORLINES MOMENTUM VIT FUNDTo better serve our clients, we enhanced the strategy used to manage the Donoghue ForlinesMomentum Fund effective March 9, 2021. The major impact to the portfolio is that sectorallocations will be neutral to the benchmark. This will reduce active share and help the portfolioparticipate through rapidly changing sectoral trends. Additionally, we extended the duration of oneof our tactical sell signals. This will allow half the portfolio to remain invested over time. Thesechanges were implemented by changing the underlying index that the portfolio attempts to track2
from the W.E. Donoghue Power Momentum Index to the FCF Risk Managed Sector NeutralMomentum Index.The Donoghue Forlines Momentum Index VIT Fund’s primary objective is capital growth andincome. Capital preservation is a secondary objective of the fund. The Fund seeks to beat thetotal return performance of the S&P 500 Index over a full market cycle on a risk adjusted basis.During the year, the strategy had one total tactical trigger. The fund sold out of the utilitiessector on February 26, 2021. The fund became fully invested again when the index changebecame effective on March 9, 2021. The Fund had quarterly reconstitution and rebalanced onMarch 9, June 4, September 8, and December 6, 2021.The Donoghue Forlines Momentum VIT outperformed its benchmark during 2021 in large partdue to the changes that we implemented during the year. We stayed invested for the majorityof the period in a risk-on environment and our quantitative approach was able to providepositive attribution. Our holdings in Energy, Consumer Staples, and Information Technologyprovided the largest contribution to return.Our focus continues to be risk-adjusted returns over a full market cycle. This is where we maymiss upside in some instances for the greater good of missing the catastrophic downside, whichcan be devastating to a pre-retiree or retiree.DIVIDENDS AND DISTRIBUTIONSThe Donoghue Forlines Dividend VIT Fund made the following dividend and capital gaindistributions during the year ended December 31, 2021:Distribution Date03/30/202106/29/20219/29/2021Source: Ultimus Fund SolutionsLong-TermCapital Gains0.00000.00000.0000Short-TermCapital .0884DistributionTotal0.05130.05530.0884The Donoghue Forlines Momentum VIT Fund did not have any dividend or capital gaindistributions during the year ended December 31, 2021.MARKET OUTLOOK AND POTENTIAL POWER VIT FUND IMPLICATIONWe are only a few weeks into the year, but investors must hope the adage “as January goes, sogoes the year” does not hold true for 2022. After all, at the recent lows, the S&P 500 was down3
almost 10% while the Nasdaq 100 was down almost 15%. And behind this pullback, pain in themost speculative parts of the market is starting to add up. SPACS, meme stocks, unprofitabletech, and crypto have all struggled. Momentum seems to have turned so, is there anything tolike about risk markets?Surging COVID cases, the FOMC’s hawkish pivot, fiscal headwinds from Washington, extreme2021 equity flows, and valuations are all legitimate concerns for investors, but the fact that we’reall talking about them suggests they’re already well known and mostly reflected in the market.And selling the market based on headlines has never been a successful path to long-termoutperformance.And we believe, despite higher volatility, there are several reasons to remain constructivetowards risk assets for 2022.So, let’s throw away the headlines and review the current macro landscape and its implicationson financial markets:GrowthFirst, while growth will slow this year, we expect it will remain above trend. As we saw in 2021,average growth during economic expansions tends to be strongest early as pent-up demand leadsto strong economic activity. While we believe we have reached “peak growth” for the cycle, at20 months, the current expansion is still a baby. Post-WWII expansions have an average of 67months, including three which have been longer than 100 months. It’s highly unlikely for theeconomy to move back into a recession so early in an expansion, and two indicators we trackclosely - the ratio of leading to coincident indicators and the US treasury yield curve - indicatethat the recovery remains on track.Leading indicators tend to always roll over well in advance of a recession. Now, the ratio is rightat cycle highs indicating the health of the expansion remains sound.One of the most reliable predictors of an impending recession is the US Treasury yield curve andspecifically the spread between the 2-year and 10- year notes. Almost every inversion of yieldcurve has been followed by a recession, and no recession since at least the mid-1970s hasoccurred without an inversion of the yield curve beforehand.While the curve has flattened substantially since March 2021, it still hasn’t inverted, suggestingthat outside of a major policy error by the Fed (or an exogenous shock), a recession starting in2022 is unlikely.We also discount the effect rising covid cases will have on the economy. Households and firmshave learned to transact through covid over the last 2 years and the new Omicron variant appearsto be less severe. We believe cases may have already peaked for the current wave.4
InflationSecond, we believe that inflation is peaking, and in any case is not as bad as it looks. Inflationshould dip over the next six to nine months as the demand for goods moderates and supply-chaindisruptions abate. When you strip out temporary distortions, inflation is not high by historicalstandards. The year over year inflation rates everyone is panicking about are misleading becausethey include large paybacks for the collapse in prices in the first year of the pandemic. If we lookat two-year core rates that exclude energy and strip out Covid base effects, we find annualizedUS core PCE inflation is only 2.8%. Granted, even when the Covid reopening and energy effectsdrop out, inflation is unlikely to subside to the official 2% target rates. But after the shock of 7%headlines, inflation in the range of 3-4% in the US and even milder in other developed economiesshould be met with relief. On a longer timeline, inflation may continue to be structurally higherthe next decade and investors will need to consider new diversifiers.PolicyFinally, we expect these growth and inflation dynamics will allow the Fed to not significantlytighten monetary policy in 2022 despite current headlines. While the Federal Reserve willexpedite the tapering of asset purchases and will probably begin raising rates in March, the Fedis unlikely to raise rates significantly. The respite from inflation this year will give the Fed somebreathing space and a major tightening campaign is less likely before mid-2023. The Fed hasturned more hawkish, but the market has made a habit of over-estimating Fed moves. Reflectiveof this environment, real bond yields remain low and financial conditions remain easy. On thefiscal side, there will be much less stimulus, but with the dysfunction coming out of DC, tax hikesmay also be less likely.Financial Market ImplicationsOur golden rule of investing is simple: Don’t bet against stocks unless you think that there is arecession around the corner, because equities and bear markets tend to overlap. Equitycorrections can occur outside of recessionary periods. In fact, we are experiencing such acorrection right now. Yet, with the percentage of bearish investors reaching the highest level inover 12 months in this week’s American Association of Individual Investors survey, chances arethat the correction will not last much longer. A sustained decline in stock prices requires asustained decline in corporate earnings; the latter normally only happens during economicdownturns.Equity valuations are still at lofty levels, but equities still look much more attractive than otherasset classes. Don’t expect the outsized returns of the past year and a half, but the bull marketshould continue. Our equity exposure remains focused on quality.Investors need to adapt their portfolio for today’s low return environment or accept low (ornegative) expected returns. Advisors are challenged to rethink foundational portfolio elementsof investor portfolios – which means seeking out strategies that bolster the “core” going forward.With no cheap assets, tactical and unconstrained management is now more important than ever.5
In order to produce positive returns over the next 5-10 years, investors will likely need to activelymanage growth cycles. Tactical management is an excellent alternative for advisors trying tonavigate this new environment for their clients. In today’s markets, the 60/40 retirement rule isstuck in the past.Regards,Jeffrey R. ThompsonChief Executive OfficerPortfolio Manager9104-NLD 02/18/20226
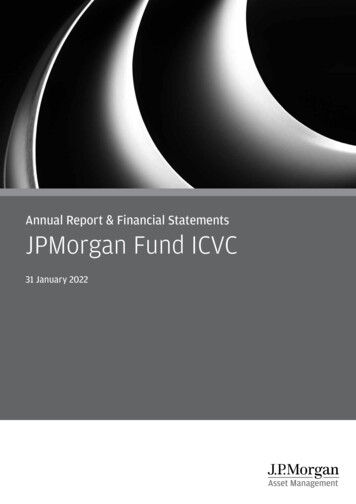
Donoghue Forlines Dividend VIT FundPORTFOLIO REVIEW (Unaudited)December 31, 2021The Fund's performance figures* for the periods ended December 31, 2021, compared to its benchmarks:One Year30.30%26.89%28.71%Donoghue Forlines Dividend VIT Fund - Class 1S&P 500 Value Total Return Index (b)S&P 500 Total Return Index (c)AnnualizedFive Year3.67%16.31%18.47%AnnualizedTen Year5.08%14.25%16.55%AnnualizedSince Inception (a)4.06%8.27%10.52%Comparison of the Change in Value of a 10,000 Investment 50,000 45,000 43,351 40,000 35,000 32,067 30,000 25,000 20,000 17,934 15,000 10,000 5,000Donoghue Forlines Dividend VIT Fund - Class 1S&P 500 Value Total Return IndexS&P 500 Total Return Index* The performance data quoted is historical. Past performance is no guarantee of future results. Current performance may be higher or lower than the performance dataquoted. The principal value and investment return of an investment will fluctuate so that your shares, when redeemed, may be worth more or less than their original cost.The returns shown do not reflect the deduction of taxes that a shareholder would pay on Fund distributions or on the redemption of Fund shares, as well as other charges andexpenses of the insurance contract or separate account. Returns greater than 1 year are annualized. The total annual operating expenses as stated in the fee table of theFund's Class 1 and Class 2 prospectus dated May 1, 2021 is 2.41% and 2.66% for Class 1 and Class 2 shares, respectively. The Fund’s advisor has contractually agreed towaive its fees and reimburse expenses of the Fund, at least until October 31, 2022, to ensure that Total Annual Fund Operating Expenses After Expense Waiver andReimbursements (exclusive of any (i) front-end or contingent deferred loads, (ii) brokerage fees and commissions, (iii) acquired fund fees and expenses, (iv) fees andexpenses associated with investments in other collective investment vehicles or derivative instruments (including for example option and swap fees and expenses), (v)borrowing costs (such as interest and dividend expense on securities sold short), (vi) taxes, and (vii) extraordinary expenses, such as litigation expenses (which may includeindemnification of Fund officers and Trustees, contractual indemnification of Fund service providers (other than the advisor)) , will not exceed 2.00% and 2.50% of theFund’s average daily net assets for Class 1 and Class 2 shares, respectively. As of December 31, 2021 Class 2 shares have not commenced operations. For performanceinformation current to the most recent month-end, please call 1-877-779-7462.(a) Inception date is May 1, 2007(b) The S&P 500 Value Total Return Index measures the performance of the large-capitalization value sector in the US equity market. It is a subset of the S&P 500 Indexand consists of those stocks in the S&P 500 Index exhibiting the strongest value characteristics. Investors cannot invest directly in an index.(c) The S&P 500 Total Return Index is an unmanaged market capitalization weighted index of 500 of the largest capitalized US domiciled companies. Index returns assumereinvestment of dividends. Investors may not invest in the indexes directly; unlike the Fund's returns, the indexes do not reflect any fees or expenses.Portfolio Composition as of December 31, 2021% of Net Assets98.4%Holdings By Investment TypesCommon Stock13.7%Short-Term Investments(12.1)%Other Assets in Excess of Liabilities100.0%Please refer to the Portfolio of Investments in this report for a detailed listing of the Fund's holdings.7
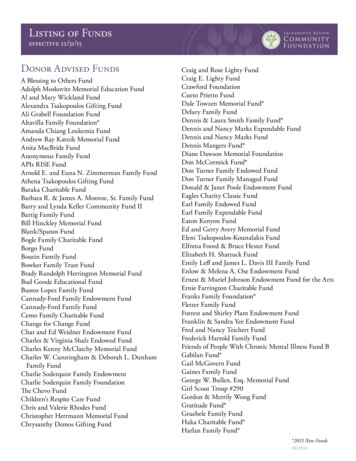
Donoghue Forlines Momentum VIT FundPORTFOLIO REVIEW (Unaudited)December 31, 2021The Fund's performance figures* for the periods ended December 31, 2021, compared to its benchmarks:One Year29.66%28.71%Donoghue Forlines Momentum VIT Fund - Class 1S&P 500 Total Return Index (b)AnnualizedFive Year10.22%18.47%AnnualizedTen Year11.29%16.55%AnnualizedSince Inception (a)6.72%10.52%Comparison of the Change in Value of a 10,000 Investment 50,000 45,000 43,351 40,000 35,000 30,000 25,975 25,000 20,000 15,000 10,000 5,000Donoghue Forlines Momentum VIT Fund - Class 1S&P 500 Total Return Index* The performance data quoted is historical. Past performance is no guarantee of future results. Current performance may be higher or lower than the performancedata quoted. The principal value and investment return of an investment will fluctuate so that your shares, when redeemed, may be worth more or less than their originalcost. The returns shown do not reflect the deduction of taxes that a shareholder would pay on Fund distributions or on the redemptions of Fund shares, as well as othercharges and expenses of the insurance contract or separate account. Returns greater than 1 year are annualized. The total annual operating expenses as stated in the feetable of the Fund's Class 1 and Class 2 prospectus dated May 1, 2021, is 1.60% and 1.85% for Class 1 and Class 2 shares, respectively. The Fund’s advisor hascontractually agreed to waive its fees and reimburse expenses of the Fund at least until October 31, 2022, to ensure that Total Annual Fund Operating Expenses AfterExpense Waiver and Reimbursements (exclusive of any (i) front-end or contingent deferred loads, (ii) brokerage fees and commissions, (iii) acquired fund fees andexpenses, (iv) fees and expenses associated with investments in other collective investment vehicles or derivative instruments (including for example option and swapfees and expenses), (v) borrowing costs (such as interest and dividend expense on securities sold short), (vi) taxes, and (vii) extraordinary expenses, such as litigationexpenses (which may include indemnification of Fund officers and Trustees, contractual indemnification of Fund service providers (other than the advisor)), will notexceed 2.00% and 2.50% of the Fund’s average daily net assets for Class 1 and Class 2 shares, respectively. As of December 31, 2021 Class 2 shares have notcommenced operations. For performance information current to the most recent month-end, please call 1-877-779-7462.(a) Inception date is May 1, 2007(b) The S&P 500 Total Return Index is an unmanaged market capitalization weighted index of 500 of the largest capitalized US domiciled companies. Index returnsassume reinvestment of dividends. Investors may not invest in the indexes directly; unlike the Fund's returns, the indexes do not reflect any fees or expenses.Portfolio Composition as of December 31, 2021% of Net Assets98.9%Holdings By Investment TypeCommon Stock9.6%Short-Term Investments(8.50)%Other Assets in Excess of Liabilities100.0%Please refer to the Schedule of Investments in this report for a detailed listing of the Fund's holdings.8
DONOGHUE FORLINES DIVIDEND VIT FUNDSCHEDULE OF INVESTMENTSDecember 31, 2021SharesFair ValueCOMMON STOCKS — 98.4%ADVERTISING & MARKETING - 2.0%3,231Omnicom Group, Inc. 236,735AEROSPACE & DEFENSE - 5.8%1,149General Dynamics Corporation239,5321,226Huntington Ingalls Industries, Inc.228,943Lockheed Martin Corporation231,727652700,202ASSET MANAGEMENT - 3.7%3,982Carlyle Group, Inc.218,6111,087T Rowe Price Group, Inc.213,748432,359BEVERAGES - 4.1%4,137Coca-Cola Company (The)244,9521,358PepsiCo, Inc.235,898480,850BIOTECH & PHARMA - 9.9%872Eli Lilly & Company240,8653,145Gilead Sciences, Inc.228,3581,392Johnson & Johnson238,1292,896Merck & Company, Inc.221,9494,035Pfizer, Inc.238,2671,167,568CABLE & SATELLITE - 1.8%4,343Comcast Corporation, Class A218,583CHEMICALS - 2.1%7,314Chemours Company245,457DIVERSIFIED INDUSTRIALS - 2.0%937Illinois Tool Works, Inc.231,252ELECTRIC UTILITIES - 4.2%6,032NRG Energy, Inc.259,8599
DONOGHUE FORLINES DIVIDEND VIT FUNDSCHEDULE OF INVESTMENTS (Continued)December 31, 2021SharesFair ValueCOMMON STOCKS — 98.4% (Continued)ELECTRIC UTILITIES - 4.2% (Continued)7,805PPL Corporation 234,618494,477FOOD - 3.9%1,223Hershey Company (The)236,6143,547Kellogg Company228,498465,112HEALTH CARE FACILITIES & SERVICES - 4.3%2,439CVS Health Corporation251,6071,460Quest Diagnostics, Inc.252,595504,202INSTITUTIONAL FINANCIAL SERVICES - 5.6%1,564Evercore, Inc., Class A212,4695,096Lazard Ltd., Class A222,3387,719Virtu Financial, Inc., Class A222,540657,347INSURANCE - 5.8%2,001Allstate Corporation (The)235,4174,259Mercury General Corporation225,9839,076Old Republic International Corporation223,088684,488LEISURE PRODUCTS - 1.9%2,241Hasbro, Inc.228,089MEDICAL EQUIPMENT & DEVICES - 2.1%1,727Abbott Laboratories(a)243,058METALS & MINING - 1.9%3,712Southern Copper Corporation229,068OIL & GAS PRODUCERS - 5.5%5,164Devon Energy Corporation(a)227,4743,628ONEOK, Inc.213,1818,114Williams Companies, Inc.211,289651,94410
DONOGHUE FORLINES DIVIDEND VIT FUNDSCHEDULE OF INVESTMENTS (Continued)December 31, 2021SharesFair ValueCOMMON STOCKS — 98.4% (Continued)PUBLISHING & BROADCASTING - 3.7%1,453Nexstar Media Group, Inc., Class A4,397World Wrestling Entertainment, Inc., Class A 219,374216,948436,322RETAIL - DISCRETIONARY - 2.0%1,697Genuine Parts Company237,919RETAIL REIT - 1.9%1,420Simon Property Group, Inc.(a)226,873SEMICONDUCTORS - 3.7%4,4191,128Intel CorporationTexas Instruments,227,579Inc.(a)212,594440,173SOFTWARE - 2.4%3,087Cerner Corporation286,690SPECIALTY FINANCE - 5.7%4,454Fidelity National Financial, Inc.232,4094,368OneMain Holdings, Inc.218,5754,858Synchrony Financial225,363676,347SPECIALTY REITS - 2.1%4,782Iron Mountain, Inc.(a)250,242TECHNOLOGY HARDWARE - 2.1%3,960Cisco Systems, Inc.250,945TECHNOLOGY SERVICES - 4.3%6071,858Accenture plc, Class A251,632International Business Machines Corporation248,340499,972TELECOMMUNICATIONS - 1.9%17,623Lumen Technologies, Inc.(a)221,16911
DONOGHUE FORLINES DIVIDEND VIT FUNDSCHEDULE OF INVESTMENTS (Continued)December 31, 2021SharesFair ValueCOMMON STOCKS — 98.4% (Continued)TRANSPORTATION & LOGISTICS - 2.0%921Union Pacific Corporation 232,02811,629,471TOTAL COMMON STOCKS (Cost 10,585,219)SharesFair ValueSHORT-TERM INVESTMENTS — 13.7%MONEY MARKET FUNDS – 1.8%218,873Fidelity Government Portfolio, Class I, 0.01%(b)218,873COLLATERAL FOR SECURUTIES LOANED – 11.9%1,401,097Mount Vernon Liquid Assets Portfolio, LLC, 0.10%(b),(c)1,401,097TOTAL SHORT-TERM INVESTMENTS (Cost 1,619,970)1,619,970TOTAL INVESTMENTS - 112.1% (Cost 12,205,189) 13,249,441 11,822,294(1,427,147)LIABILITIES IN EXCESS OF OTHER ASSETS - (12.1)%NET ASSETS - 100.0%LLCLTDPLCREIT(a)(b)(c)- Limited Liability Company- Limited Company- Public Limited Company- Real Estate Investment TrustAll or a portion of the security is on loan. The total fair value of the securities on loan as of December 31, 2021 was 1,367,151.Rate disclosed is the seven day effective yield as of December 31, 2021.Security was purchased with cash received as collateral for securities on loan at December 31, 2021. Total collateral had a value of 1,401,097 at December 31, 2021.See accompanying notes which are an integral part of these financial statements.12
DONOGHUE FORLINES MOMENTUM VIT FUNDSCHEDULE OF INVESTMENTSDecember 31, 2021SharesFair ValueCOMMON STOCKS — 98.9%ASSET MANAGEMENT - 7.7%5,092Ameriprise Financial, Inc. 1,536,05410,429Blackstone, Inc.1,349,40826,976Carlyle Group, Inc.1,480,982LPL Financial Holdings, Inc.1,495,8819,3445,862,325BIOTECH & PHARMA - 4.2%5,948Eli Lilly & Company1,642,9566,652Zoetis, Inc.1,623,2883,266,244CHEMICALS - 2.0%27,102Olin Corporation1,558,907CONSUMER SERVICES - 2.1%22,296Service Corp International1,582,793ELECTRIC UTILITIES - 2.3%40,965NRG Energy, Inc.1,764,772ELECTRICAL EQUIPMENT - 4.0%7,586Keysight Technologies, Inc.(a)1,566,5854,391Rockwell Automation, Inc.(b)1,531,8003,098,385FOOD - 2.1%8,320Hershey Company (The)1,609,670HEALTH CARE FACILITIES & SERVICES - 4.2%5,6935,174IQVIA Holdings, Inc.(a)Laboratory Corp of TUTIONAL FINANCIAL SERVICES - 1.9%10,639Evercore, Inc., Class A1,445,30813
DONOGHUE FORLINES MOMENTUM VIT FUNDSCHEDULE OF INVESTMENTS (Continued)December 31, 2021SharesFair ValueCOMMON STOCKS — 98.9% (Continued)INSURANCE - 1.9%4,988Aon plc, CLASS A 1,499,193INTERNET MEDIA & SERVICES - 2.0%519Alphabet, Inc., Class A(a)1,503,564LEISURE FACILITIES & SERVICES - 2.1%25,102Boyd Gaming Corporation(a)1,645,938MEDICAL EQUIPMENT & DEVICES - 4.1%18,1812,427Bruker CorporationIDEXX Laboratories,1,525,568Inc.(a)1,598,0823,123,650OIL & GAS PRODUCERS - 1.9%33,131Continental Resources, Inc.(b)1,482,944PUBLISHING & BROADCASTING - 1.9%9,861Nexstar Media Group, Inc., Class A1,488,814RENEWABLE ENERGY - 1.4%5,910Enphase Energy, INC.(a)1,081,175RETAIL - CONSUMER STAPLES - 3.8%2,737Costco Wholesale Corporation1,553,7956,058Target Corporation1,402,0642,955,859RETAIL - DISCRETIONARY - 8.1%12,540Dick's Sporting Goods, Inc.1,441,97514,798Penske Automotive Group, Inc.1,586,641Tractor Supply Company1,563,5466,5533,843Ulta Beauty,Inc.(a)1,584,6236,176,785RETAIL REIT - 2.0%9,623Simon Property Group, Inc.(b)1,537,46714
DONOGHUE FORLINES MOMENTUM VIT FUNDSCHEDULE OF INVESTMENTS (Continued)December 31, 2021SharesFair ValueCOMMON STOCKS — 98.9% (Continued)SEMICONDUCTORS - 9.9%9,32110,020Advanced Micro Devices, Inc.(a) 1,341,292Applied Materials, Inc.1,576,7472,664Broadcom, Inc.1,772,6523,614KLA Corporation1,554,4184,517NVIDIA Corporation1,328,4957,573,604SOFTWARE - 11.1%2,205Adobe, Inc.(a)2,261Intuit, Inc.1,454,3209,431Manhattan Associates,4,463Microsoft , Inc.(a)1,368,8668,481,557SPECIALTY FINANCE - 2.1%2,363Credit Acceptance Corporation(a)1,624,988SPECIALTY REITS - 2.2%32,448Iron Mountain, Inc.(b)1,698,004TECHNOLOGY HARDWARE - 1.9%2,503Zebra Technologies Corporation, Class A(a)1,489,786TECHNOLOGY SERVICES - 8.1%4,128Accenture plc, Class A1,711,2623,154FactSet Research Systems, Inc.1,532,8763,779Moody's Corporation1,476,0023,238S&P Global,Inc.(b)1,528,1096,248,249TELECOMMUNICATIONS - 1.9%119,399Lumen Technologies, Inc.(b)1,498,45715
DONOGHUE FORLINES MOMENTUM VIT FUNDSCHEDULE OF INVESTMENTS (Continued)December 31, 2021SharesFair ValueCOMMON STOCKS — 98.9% (Continued)WHOLESALE - DISCRETIONARY - 2.0%2,668Pool Corporation 1,510,08876,040,472TOTAL COMMON STOCKS (Cost 70,921,048)SharesFair ValueSHORT-TERM INVESTMENTS — 9.6%MONEY MARKET FUNDS – 1.3%986,267Fidelity Government Portfolio, CLASS I, 0.01%(c)986,267COLLATERAL FOR SECURITIES LOANED – 8.3%6,380,285Mount Vernon Liquid Assets Portfolio, LLC, 0.10%(c),(d)6,380,285TOTAL SHORT-TERM INVESTMENTS (Cost 7,366,552)7,366,552TOTAL INVESTMENTS - 108.5% (Cost 78,287,600) 83,407,024 76,886,649(6,520,375)LIABILITIES IN EXCESS OF OTHER ASSETS - (8.5)%NET ASSETS - 100.0%LLCPLCREIT(a)(b)(c)(d)- Limited Liability Company- Public Limited Company- Real Estate Investment TrustNon-income producing security.All or a portion of the security is on loan. The total fair value of the securities on loan as of December 31, 2021 was 6,241,876.Rate disclosed is the seven day effective yield as of December 31, 2021.Security was purchased with cash received as collateral for securities on loan at December 31, 2021. Total collateral had a value of 6,380,285 at December 31, 2021.See accompanying notes which are an integral part of these financial statements.16
Donoghue Forlines VIT FundsSTATEMENTS OF ASSETS AND LIABILITIESDecember 31, 2021Donoghue ForlinesDividend VIT FundASSETSInvestment securities:At costAt value (Securities on loan 1,367,151 and 6,241,876, respectively)Dividends and interest receivablePrepaid expenses and other assetsTOTAL ASSETS LIABILITIESSecurities lending collateral (Note 5)Investment advisory fees payablePayable for Fund shares repurchasedPayable to related partiesDistribution (12b-1) fees payableAccrued expenses and other liabilitiesTOTAL LIABILITIESNET ASSETS COMPOSITION OF NET ASSETS:Paid in capitalAccumulated income (losses)NET ASSETS NET ASSET VALUE PER SHARE:Class 1 Shares:Net AssetsShares of beneficial interest outstanding ( 0 par value, unlimited shares authorized)Net asset value (Net Assets Shares Outstanding), offering and redemption price per shareSee accompanying notes to financial statements.17 hue ForlinesMomentum VIT Fund 15,972,294(4,150,000)11,822,294 11,822,294706,36616.74 87
Donoghue Forlines VIT FundsSTATEMENTS OF OPERATIONSFor the Year Ended December 31, 2021Donoghue ForlinesDividend VIT FundINVESTMENT INCOMEDividends (including foreign dividend tax withholding of 0, and 1,193, respectively)InterestSecurities Lending IncomeTOTAL INVESTMENT INCOME EXPENSESInvestment advisory feesDistribution (12b-1) feesClass 1Audit feesAccounting services feesAdministration feesTrustees' fees and expensesLegal feesCompliance officer feesCustodian feesTransfer agent feesInsurance expensePrinting and postage expensesOther expensesTOTAL EXPENSESLess: Fees waived/reimbursed by the advisorNET EXPENSES382,7525338382,843Donoghue ForlinesMomentum VIT Fund 62NET INVESTMENT INCOME EALIZED AND UNREALIZED GAIN ON INVESTMENTSNet realized gain from security transactionsNet change in unrealized appreciation on investmentsNET REALIZED AND U
Dec 31, 2021