Transcription
White PapervRANValue Propositionand Cost ModelingVersion1.0Release DateSeptember 2020AuthorsYoung Lee, Hyunjeong Lee, Jai-Jin LimDepartmentNetwork Architecture Office (NAO)
EXECUTIVE SUMMARYVirtualized RAN (vRAN) is a new architecture enhancing the flexibility of Centralized RAN (C-RAN)through the virtualization of the baseband function in a common resource pool made up ofCommercial Off-the-Shelf (COTS) servers located in a centralized hub, allocating resources in aflexible manner according to traffic conditions.vRAN provides outstanding value to operators thanks to the virtualization technology. Thisdocument highlights the general vRAN value proposition as follows:·ㅤFlexible and adaptive capacity management via resource pooling and workload placement·ㅤLower total cost of ownership with unified hardware and software infrastructure·ㅤSimplified network operation and maintenance through unified management·ㅤFoundation for automated network slicing through dynamic resource scaling and function instantiation·ㅤEnabling operation and service innovation using unified infrastructure and managementThe whitepaper presents a TCO model to quantify the vRAN value proposition, leading to thefollowing findings:·ㅤC-RAN is the more cost-effective 5G RAN architecture over the long haul (with cumulated 5 years) thanD-RAN by 14% less TCO.·ㅤvRAN (based on C-RAN) is the more cost-effective 5G RAN architecture over the long haul (with cumulated5 years) than D-RAN by 13% less TCO.In conclusion, vRAN is clearly an attractive technology choice for operators in the long run from bothqualitative and quantitative point of view.
CONTENTSINTRODUCTION0 -1Terminology0 -2Purpose0-3Scope0-4Revision History0-5AbbreviationsVRAN VALUE PROPOSITION1-1Flexible and Adaptive Capacity Management1-2Lower TCO by Unified Hardware and Software Infrastructure1-3Simplified Network Operation and Maintenance1-4Foundation for Automated Network Slicing1-5Enabling Operation and Service InnovationTCO MODEL2-1Scope of TCO Modeling2-2Assumption2 -3Reference Network Size and Model for TCO AnalysisTCO COMPARISON RESULTS3 -1Transport CAPEX Decomposition3 -2OPEX Decompositon3 -3Impact of Cell DensitificationSUMMARY AND CONCLUSION0506101620
FIGURETCO MODELFigure 2-1D-RAN Reference Model13Figure 2-2C-RAN Reference Model14Figure 2-3vRAN Reference Model15TCO COMPARISON RESULTSFigure 3-1TCO Comparison of D-RAN, C-RAN, and vRAN over 5-year periods16Figure 3-2Transport Cost Decomposition : Ethernet switching equipment cost vs. Fiber cost17Figure 3-3OPEX Cost Decomposition18Figure 3-4Cell Densification Example in D-RAN19Figure 3-5Cell Densification Example in C-RAN19Figure 3-6Comparison of Transport Costs : Normal vs. Densified cases20TABLETCO MODELTable 2-1Cost Component Matrix in the TCO Analysis10Table 2-22 Price structure and assumption of DU and vDU11Table 2-3Assumptions on the OPEX Related Parameters12Table 2-4Estimated Midhaul Aggregated Bandwidth for D-RAN13Table 2-5Estimated eCPRI Fronthaul (Option 7-2x) Aggregated Bandwidth for C-RAN14
05INTRODUCTION0.1TERMINOLOGYThroughout this document, vRAN refers to the architecture in which virtualized basebands (vDU) are placedin a centralized HUB and C-RAN refers to the architecture in which DUs (DU) are placed in a centralized HUB.Meanwhile, D-RAN refers to the architecture in which DU is placed at cell site.0.2PURPOSEThe purpose of this document is two folds:·ㅤFirst, to present general vRAN value proposition;·ㅤSecond, to determine a more economical 5G RAN architecture from the Total Cost of Ownership (TCO)point of view.0.3SCOPEThis document first presents general vRAN value proposition in several areas. And TCO models arepresented to quantify vRAN advantages.0.4Revision HistoryIssue NumberV1.0Issue dateSep 2020Details on the changeFirst IssueAuthorYoung Lee, Hyunjeong Lee, Jai-Jin Lim0.5ABBREVIATIONSCASConverged Access SwitchvDUVirtualized Distributed UnitCOTSCommercial-Off-the-ShelfDSSDynamic Spectrum SharingCAPEX Capital ExpendituresFHGFronthaul GatewayCSRCell Site RouterOPEXOperating ExpenseDUDistributed UnitvRANVirtualized Radio Access Network
06vRAN Value propositionvRAN is a new architecture enhancing the flexibility of Centralized RAN (C-RAN) by virtualizing thefunctions of basebands in a common resource pool made up of the Commercial Off-the-Shelf(COTS) servers located in centralized Hub, allocating resources in a flexible manner according totraffic conditions.This section highlights a number of outstanding value propositions associated with vRAN.1.1FLEXIBLE AND ADAPTIVE CAPACITY MANAGEMENTThe network function virtualization and cloudification of vRAN, and its deployment at various scalespanning site, far edge, edge, and core clouds facilitate the flexible and adaptive capacity management.For instance, when more traffic is observed from some cell sites, or the number of UEs is observed toincrease, vRAN allows the operator to dynamically change the cell capacities for those cell sites. Likewise,when less traffic comes from other cell sites, or the number of UEs is observed to decrease, thecorresponding cell capacities can be dynamically changed.Resource pooling also represents the benefit of vRAN’s flexible and adaptive capacity management. Thehigher level of resource pooling gain is achieved as the more centralization is applied on account of acentralized Cloud RAN architecture which is conducive to the improved utilization of DU processingresources at a larger pool. Further improvement of resources comes with cloud-native containerizationtechnology where resources are more dynamically and optimally allocated on a micro-service level.Another benefit of vRAN’s flexible and adaptive capacity management is the energy savings operation forunder- or less-utilized vDU servers. This comes with the ability to move workload flexibly depending ontraffic conditions. For instance, when DUs are distributed or centralized, under-utilized workload atcertain time (e.g., at night) can be re-assigned and aggregated into another vDU server to reduce the totalnumber of active servers. Alternatively, the operator can dynamically enable the CPU power savings modein a vDU server with under-utilized workload.In summary, vRAN’s flexible and adaptive capacity management offers several benefits that would lead toavoid over-provisioning of RAN capacity dimensioned for peak traffic demand. This also facilitates apractical and affordable capacity scalability that avoids unnecessary vDU server investment.
071.2LOWER TCO BY UNIFIED HARDWARE AND SOFTWARE INFRASTRUCTUREThe use of generic, unified COTS hardware unit reduces operational and training costs incurred by running andmanaging vendor-specific HW units. It also relieves the operator of both vendor lock-in and associatedHW-bundled proprietary configuration issues, which typically results in high operational costs and thelimitation of HW portability across different vendor domains inside the network.This generic unified COTS hardware unit also simplifies hardware management and removes costlymanagement of vendor-specific hardware. In addition, when upgrading to higher capacity servers, the existingservers can be re-deployed for use in running other applications such as Core, MEC applications, and ITapplications. This repurposing of the existing COTS HW unit to another business operation in its network is aclear advantage of vRAN. In contrast, the reusability of purpose-built proprietary hardware is limited or at bestis only possible within specific vendor and/or is bound to the particular 3GPP wireless standards release.Multi-vendor management becomes much easier with vRAN as the operator is able to run simultaneouslyvendor-specific RAN software as a separately containerized application on same COTS hardware units. Forexample, a typical RAN sharing between two operators in the rural sites can be made possible by runningseparate gNB on the same shared COTS hardware units.Other operational advantage of vRAN comes with the case where auxiliary dedicated sled-type servers orhardware accelerators can be easily plugged in. Thus, no need for purchasing or replacing the existing vDUserver arises. All of these aforementioned benefits are not exhausted list, and they corroborate the advantagesof vRAN in lowering the total cost of ownership.1.3SIMPLIFIED NETWORK OPERATION AND MAINTENANCEThe use of both generic unified COTS hardware and the containerized software technology provides thehomogeneous hardware and software infrastructure for RAN as well as other NFs (e.g., Core, IMS, etc.). Onaccount of this homogenous infrastructure, the operators can simplify their operation and maintenancepractices to ease the tasks in capacity scaling or dimensioning, fault and performance monitoring, andupgrading software. Through a simplified operation process, operational efficiency is greatly improvedAs vRAN software is utilizing Open Sources (e.g., OpenStack, K8s, ONAP, etc.) and 3rd party cloudmanagement solutions (e.g., Redhat, VMware, public cloud infra management solutions from AWS, MSAzure, Google GCP), the seamless software upgrade available in the web-scale applications can be alsoapplied in the Telco software management. For example, rolling updates in K8s makes this possible. Thus avRAN node running 2G/3G/4G/5G technologies can simultaneously upgrade a specific technology withoutdisrupting services in other technologies.This simplified, seamless, and unified management in conjunction with Open Source cloud infrastructuremanagement solutions minimizes the management complexity when running multiple sets of software inthe same node or network. It also improves operational efficiency to a different level by streamlining andautomating the network operation and maintenance process.
081.4FOUNDATION FOR AUTOMATED NETWORK SLICINGNetwork slicing allows operators to create and run multiple virtual networks that are designed to meet theneeds of specific user groups (services) over the shared physical infrastructure. These virtual networks havedifferent needs for bandwidth, latency, reliability, security, coverage and service levels; and therefore, theyneed to be optimally designed to serve specific needs over the shared resources.As the network slicing services are expected to be in widespread use in different business needs, it isessential to reduce the management complexities of the network slicing operations by automation; e.g.,automating the network slicing lifecycle management and SLA assurance on new slice servicerequirements. Without proper automation in place, it is almost impossible to deliver the promise of networkslicing: the delivery of new diverse services from various industry verticals on the fly in a cost effectivemanner.Key software foundation for the automated network slicing operation benefitting from vRAN’svirtualization and cloudification capabilities are as follows:·ㅤAutomated instantiation of the RAN slicing service when and where it is required. Slice-specific networkfunctions and micro-services are more flexibly deployed in vRAN than in a conventional RAN withmanually–deployed purpose-built proprietary DU.·ㅤAutomated capacity scaling in RAN slicing when and where it is required for a timely response tounexpected traffic demands, without overprovisioning resources. In such environment, vRAN is conduciveto adaptive and optimal resource allocation required per slice in radio and computing resources as well asfronthaul and backhaul transport resources.·ㅤAutomated scheduling differentiation in RAN slicing by means of RAN-slice aware policy enforcementthat influences gNB radio resource management and scheduling optimization.·ㅤAutomated integration of additional services as needed. For example, any Cloud-native Open Softwaresuch as data management platform and analytics tools can be easily instantiated atop vRAN deployment.In summary, the automation is an essential element for delivering the promise of the network slicing: theagile delivery of network slicing services in various business environments. vRAN’s virtualization andcloudification serve as a key foundation for the automated network slicing.
091.5ENABLING OPERATION AND SERVICE INNOVATIONThe virtualization and cludification technology is viewed to the operators as a means to better enableservice and application agility. Moreover, it is also viewed as a unified infrastructure to create operationand service innovations where RAN, CN, Edge applications run mixed on the same node, or can run overseveral cloud nodes depending on the service requirement and application characteristics.Here are some examples of operation and service innovation where this flexible workload (e.g.,applications or functions) placement and configuration can be realized for the operators:·ㅤThe operator can place vRAN on the same cloud to reap the benefits of running RAN functions and openapplications easily and efficiently. For example, MEC with some analytics capability can be deployed onthe same private cloud servers or in the public cloud servers (e.g., Amazon, Microsoft, Google).·ㅤThe operator can build a compact, small form factor configuration that hosts vRAN (Baseband, CU-UP,CU-CP), as well as CN UPF and MEC applications together on the same COTS servers. This compactconfiguration can be a best fit to the business use case and deployment scenario where hosted services(e.g., self-driving, tele-surgery, robotic remote motion control) are latency sensitive ( 1ms) and facilityspace is limited. Such compact configuration is also beneficial to the operator looking to the foot-printefficient inbuilding solution.In summary, vRAN gives the operator a competitive edge enabling operation and service innovation.
10TCO MODEL2.1SCOPE OF TCO MODELINGTypically, TCO comprises both the CAPEX and the OPEX for Radio, Baseband, and Transport Unit (TU)(switching equipment and dark fibers). The CAPEX is one-time equipment purchase cost and the OPEX isannually recurring costs used to maintain the network equipment.The CAPEX and OPEX of Radio in this analysis is not included because it is assumed to be same for bothRAN architectures, D-RAN with DU and C-RAN with vRAN.The following table shows the cost component matrix used in the present TCO analysis. TCO is then comparedwith the two RAN evolution options: D-RAN with DU and C-RAN with vRAN.※ TCO analysis of the D-RAN with vDU architecture is excluded because the TCO of D-RAN with non-virtualizedDU depends on only DU CAPEX and other costs such as transport CAPEX and OPEX are similar to the D-RANwith vDU architecture.Table 2-1 : Cost Component Matrix in the TCO AnalysisCost ComponentRadioBasebandRadio equipment (Radio, Massive MIMO radio)Energy consumption costs by Radio equipmentBaseband equipment (DU, vDU)Energy consumption costs by Baseband equipmentSwitching equipment & modulesTransport·ㅤD-RAN : CSR (Cell site), CAS (Central DC)·ㅤC-RAN : FHG (Cell site), CAS (Hub site/Edge DC)Dark fiberEnergy consumption costs by switching equipmentSite RentalRental cost of cell sites, C-RAN hub sitesOAMMaintenance fee, estimated as a fraction of DU CAPEXCAPEXOPEXNot includedNot included
112.2ASSUMPTION2.2.1.NETWORK AND CELL-SITE CONFIGURATIONIt is assumed that the baseline D-RAN consists of 5C (carrier) 3S (sector) configurations per cell site (i.e.,15 cells per site) and a single C-RAN or vRAN hub site is capable of hosting 20 cell sites(15cells per cell site).The reference 5G site cell configuration is defined as follows·ㅤNR 700/850 10MHz 4T4R 2C 3S with DL/UL 4L/2L layer each, 30k SCS·ㅤNR AWS/PCS 20MHz 4T4R 2C 3S with DL/UL 4L/2L layer each, 30k SCS·ㅤNR C-Band 100MHz 64T64R 1C 3S with DL/UL 16L/8L layer each, 30k SCSNote that Dual-band Radios are assumed to be in use for the 700/850 and AWS/PCS carriers, respectively,and Massive MIMO radios are assumed for C-Band 100MHz cells.2.2.2.BASEBANDBaseband dimensioning is based on the specifications of the traditional baseband(DU) and the current andupcoming vRAN solution (vDU)·ㅤvRAN Phase1 is based on current Intel CPU and hardware accelerator.·ㅤvRAN Phase2 is based on new CPU and hardware accelerator, and the performance is estimated to beimproved by 2 times.The price structure of the DU and vRAN used in this cost modeling are assumed as follows:Table 2-2 : Price structure and assumption of DU and vDUDUPrice StructurevDU1 x main boardCOTS HW Cost SW License n x channel cards Cloud Platform
122.2.3.FRONTHAULThe fronthaul options are assumed as follows:·ㅤIn D-RAN, the legacy CPRI fronthaul option is assumed.·ㅤIn C-RAN, the standard eCPRI function split Option 7-2x [3] is assumed.2.2.4.TRANSPORT·ㅤSelf-built transport solution over dark fiber is assumed.·ㅤTransport CAPEX consists of transport equipment (e.g., CSR, FHG, CAS) cost and dark fiber rental cost.·ㅤTransport dimensioning is based on real equipment (real CSR, FHG, CAS).·ㅤTransport network (i.e., fronthaul/midhaul) is dimensioned with a rule of 80% utilization with 1 1redundancy.·ㅤAnnual dark fiber cost: Usually long-term (e.g., 30 years) rental is paid with the cost of 50/mile/month.In this study, 20 miles of fronthaul is assumed; and the dark fiber costs are considered as CAPEX,annually amortized over 30 years.2.2.5.OPEXThe following OPEX parameters are assumed as followsTable 2-3 : Assumptions on the OPEX Related Parameters·ㅤCell site rental cost Includes cell tower,cell site floor space for basedband & maintenance.SiteCost- D-RAN : 33,000/month- C-RAN : 80% of D-RAN·ㅤEdge DC cost (C-RAN)- OPEX per rack : 3,300/monthEnergyCost·ㅤIncludes the power consumption of baseband and air conditioning & rectifier for baseband.·ㅤ 0.14/kWh·ㅤIncludes HW & SW maintenance fee, site visit for baseband capacity upgrade, networkOAMCostfault management, performance optimization, etc.·ㅤD-RAN/DU: 20% of DU CAPEXC-RAN/vRAN : 50% of D-RAN/DU(50% by C-RAN, 20% by vRAN automation)
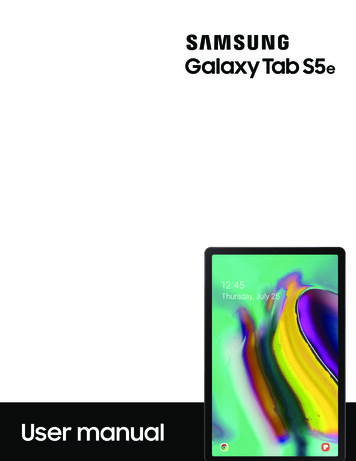
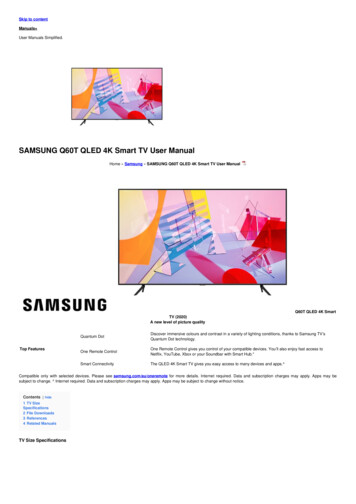
132.3REFERENCE NETWORK SIZE AND MODEL FOR TCO ANALYSIS2.3.1.D-RAN REFERENCE MODELFigure 1-1 shows the network diagram of the D-RAN reference model with 20 sites of 300 cells, wheretraditional D-RAN baseband is located in the cell site and virtualized CU is located at the hub site. Theaggregated midhaul traffic bandwidth for D-RAN, following the 1 peak and 2 averages per carrier, is alsoshown in Table 2-4. Given the estimated midhaul aggregated bandwidth, it is sufficient to put the 25GElink (two 25GEs 1 1 for link redundancy) in the midhaul transport network. Additional transportequipment such as CSR at cell site and CAS at the hub site is appropriately dimensioned to support thismodel.Figure 2-1 : D-RAN Reference ModelCell Site #1 (15 cells)CPRI 2x25G/Massive MIMO RadioC-Band 3 Cell(100M, D16L/U8L)CPRI 1x10G/RadioAWS/PCS 3 3 Cell(20M, 4T4R)CPRI 1x10G/Radio700/850 3 3 Cell(10M, 4T4R)Central Office(300 cells)DUMidhaul Ethernet2x25GECSRMidhaul Ethernet2x25GECASCell Site #20 (15 cells)vCUTable 2-4 : Estimated Midhaul Aggregated Bandwidth for D-RANC-Band 64T64R Massive MIMO radio3Cell (100M D16L/U8L)AWS/PCS Dual-band 4T4R radio6Cell (100M D16L/U8L)700/850 Dual-band 4T4R radio6Cell (10M D4L/U2L)Midhaul BWCell Peak TputCell Average Tput(1 Peak 2 Avg.)(256QAM)(ITU-T : Peak x 0.2)10 Gbps7.2Gbps1.4 Gbps1 Gbps359 Mbps72 Mbps0.5 Gbps180 Mbps36 Mbps
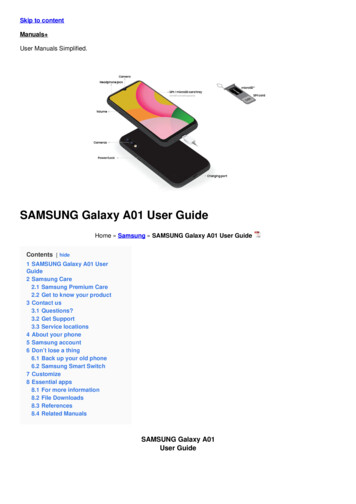
142.3.2.C-RAN REFERENCE MODELFigure 1 2 shows the network diagram of the C-RAN reference model with 300 cells per 1 C-RAN hub site,where Radio/Massive MIMO radio is located in the cell site, but DU is collocated with vCU at the hub site.As shown in the figure, the total number of DUs is reduced to 11 DUs compared to the D-RAN 30 DUsbecause of the DU pooling effect (in other words, DU hoteling effect) thanks to the full channel cardconfiguration per each DU at the hub site that can afford more sites given the reference cell site configuration.Figure 2-2: C-RAN Reference ModelCell Site #1 (15 cells)Central Office (300 cells)eCPRI 2x25G/Massive MIMO RadioCASC-Band 3 Cell(100M, D16L/U8L)eCPRI 1x10G/RadioAWS/PCS 3 3 Cell(20M, 4T4R)eCPRI 1x10G/Radioneth2 x aul10 E t0G heE rFronFHGt700/850 3 3 Cell(10M, 4T4R)Cell Site #20 (15 cells)vCU#1#7#2#8#n#6DUDUThe interface between the cell site and the hub site follows the standard eCPRI interface over the Ethernetfronthaul. The supported function split option is eCPRI standard Option 7-2x and the estimated aggregatedfronthaul bandwidth is around 100Gbps. Thus, it requires two 100GE links to be in place (1 1 link redundancy).In addition, the C-RAN hub site needs to install a new fronthaul gateway capable of more aggregated eCPRItraffic with 100GE links. The estimated eCRPI fronthaul aggregated bandwidth for C-RAN is shown in Table 2-5.Table 2-5 : Estimated eCPRI Fronthaul (Option 7-2x) Aggregated Bandwidth for C-RANFronthaul BW(1 peak 2 Avg.)FH Peak Tput./cell(IQ bitwidth: 14)FH Average Tput./cell(Peak x 0.2)C-Band 64T64R Massive MIMO radio3Cell (100M D16L/U8L)61.6 Gbps44Gbps8.8 GbpsAWS/PCS Dual-band 4T4R radio6Cell (20M D4L/U2L)6.2 Gbps2.2Gbps0.44Gbps700/850 Dual-band 4T4R radio6Cell (10M D4L/U2L)3.1 Gbps1.1Gbps0.22Gbps
152.3.3.VRAN REFERENCE MODELFigure 2-3 shows the network diagram of the vRAN reference model with 300 cells of 1 vRAN hub site,where Radio/Massive MIMO Radio is located in the cell site, but DU is replaced with vDU and is alsocollocated with virtualized CU at the vRAN hub site.Figure 2-3 : vRAN Reference ModelCell Site #1 (15 cells)Central Office (300 cells)eCPRI 2x25G/Massive MIMO RadioCASC-Band 3 Cell(100M, D16L/U8L)eCPRI 1x10G/RadioAWS/PCS 3 3 Cell(20M, 4T4R)eCPRI 1x10G/RadioFronFHGtha2 x ul10 E t h0G eE rnet700/850 3 3 Cell(10M, 4T4R)Cell Site #20 (15 cells)#1#9#2#10#8vCU#nvDUvDUThere is no change in the fronthaul configuration from C-RAN case. The interface between cell site and hubsite follows the standard eCPRI interface over the Ethernet fronthaul. The supported function split optionis eCPRI standard Option 7-2x and the estimated aggregated fronthaul bandwidth is around 100Gbps,which requires two 100GE links to be in place (1 1 link redundancy). In addition, the vRAN hub site needsto install a new fronthaul gateway capable of more aggregated eCPRI traffic with 100GE links.
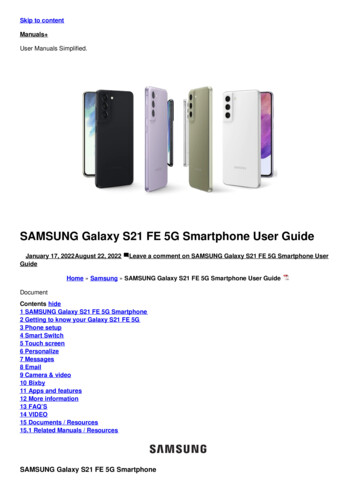
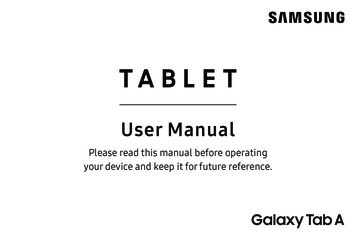
16TCO COMPARISON RESULTSGiven the three reference models above, we’ve obtained the following 5-year accumulated TCOcomparison results:·ㅤTCO savings: C-RAN reduces TCO by 14%; vRAN Ph.1 reduces TCO by 4% and vRAN ph.2 reduces TCO by13% as compared to D-RAN TCO respectively.(Note: Recall that the above percentages are based on the assumption that C-RAN cell site rental cost is80% of that of D-RAN. If C-RAN cell site rental cost is assumed as 60% of that of D-RAN, C-RAN reducesTCO savings by 24%; vRAN Ph.1 reduces TCO by 14% and vRAN Ph.2 reduces TCO by 22% as compared toD-RAN TCO respectively.)·ㅤC-RAN/vRAN CAPEX savings shows about 30% gains as compared to D-RAN, due to the DU Pooling(Hoteling) effect.·ㅤC-RAN/vRAN OPEX savings shows about 25% gains as compared to D-RAN due to the centralization effect.·ㅤC-RAN/vRAN Transport CAPEX increased by about 6% (25% for Year1) due to the increase fronthaulbandwidth in C-RAN/vRAN Option 7-2x as compared to the D-RAN midhaul Option 2 [4,5].Figure 3-1 : TCO Comparison of D-RAN, C-RAN, and vRAN over 5-year periodsUnit : Cost ( M)( ) : Fiber cost / ( ) : Cell site costYear 1Accumulated over 5 YearsAccumulated over 5 Years(C-RAN cell site cost : 80%of D-RAN)(C-RAN cell site cost : 60%of D-RAN)398(12% )331135(110)200100Transport CAPEX(C-RAN cell site cost : 80%of D-RAN)400300DU CAPEX110(80)298(10% )100(88.5)105(89.5)137(80)1400316(5% 9(14% )502(443)7003500430(400)457(400)1,139(4% )526(448)457(400)1,1911,038(13% )1050503(446)700675(550)909(24% )392(333)350457(400)0430(400)457(400)1,029(14% )416(338)457(400)928(22% NC-RANvRANPh.1vRANPh.2Based on the TCO comparison results, the important areas of TCO optimization for 5G RAN arehighlighted as follows:·ㅤOPEX optimization: More than 50% of TCO is caused by OPEX regardless of D-RAN, C-RAN, and vRAN.Target OPEX optimization costs are the site rental cost, energy consumption cost, site visits cost,operational personnel cost with automation efficiency in the workflow and troubleshooting. Note thatin the present TCO study, not all areas are explored. This should be further tuned, incorporatingper-operator specific calculation with more information.
17·ㅤTransport CAPEX optimization: About 40% of TCO incurred by Transport. Thus, this leads to bandwidthefficient fronthaul solutions. Supporting only one single function split option may not be optimal giventhat there are various 5G deployment scenarios with a mix of low-band 600/700MHz, mid-band 2.5G/3.7G/3.9G, and high-band 24G/28G/39G carriers. Thus, the capability to support different fronthaulsplit options simultaneously is desired even in the single cell site.·ㅤBaseband CAPEX optimization: Technological advances in the COTS H/W platform and acceleratorstend to improve DU CAPEX, but more SW oriented optimization is desired. Efficient vDU and resourcepooling via SW function virtualization should be devised to achieve more affordable UEs, cells, orsite capacity per vDU.3.1TRANSPORT CAPEX DECOMPOSITIONThe Transport costs are further broken into switching equipment cost and dark fiber installation cost.Typically, mobile Ethernet backhaul is leased from the Carrier Ethernet providers, or built over thelong-term (e.g., 30-year) leased dark fibers. Or some operators had been building their own dark fibers aspart of their converged wireless and wired access for their own access use or access service for otheroperators mobile backhaul uses.The study results in the Figure 1-5 reveal that D-RAN switching equipment cost is about 52% level ofC-RAN/vRAN, and fiber cost is the major cost factor for the transport: 73% (D-RAN), 58% (C-RAN/vRAN).Figure 3-2 : Transport Cost Decomposition: Ethernet switching equipment cost vs. Fiber costUnit : Cost ( M)Total Transport CostFiber CostSwitching NRelatively higher switching cost for C-RAN/vRAN is due to the required high-bandwidth optic modules and thenumber of ports in aggregation sites: In other words, 25GE link is enough per D-RAN site, but 100GE link isrequired per C-RAN/vRAN site given the reference cell configurations. This result implies that Transport costoptimization can only be achieved with the proper selection of the fronthaul function split options, whose TCOsensitivity analysis will be presented later.
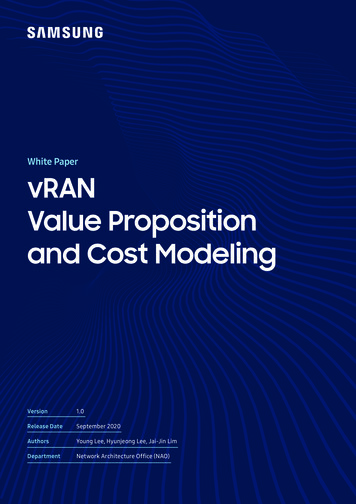
183.2OPEX DECOMPOSITIONIn this study, OPEX costs are further decomposed into their respective components, as shown in Figure 3-3.Figure 3-3 : OPEX Cost DecompositionAccumulated over 5 Years (C-RAN cell site cost : 80%of D-RAN)Unit : Cost ( M)TotalSite Rental CostEnergy CostOAM 6100390D-RAN16C-RAN434334vRAN Ph.12334vRAN Ph.2OPEX costs are decomposed into their respective components: site rental cost, energy cost and OAM cost, asshown in Figure1-7.C-RAN/vRAN has about 25% lower OPEX compared to D-RAN by the benefits of centralization and virtualization.The cell site rental cost is the largest part, comprising about 70 80% of the OPEX and this cost is expected to bereduced by about 20% in C-RAN architecture because cell floor space cost for DU is removed.The energy cost consists of power consumption of DU and air-conditioning & rectifier of baseband. In C-RANarchitecture, power consumption of air-conditioning & rectifier of basedband is removed at a cell site and powerconsumption of DU is optimized by pooling in centralized site. Accordingly, C-RAN/vRAN architecture achievesabout 40% lower energy cost compared to D-RAN. (In this analysis, the power consumption of Radio and thepower consumption of air-conditioning & rectifier for Radio are not included.)The OAM cost consists of HW and SW maintenance fee, site visit for baseband capacity upgrade, network faultmanagement, radio performance optimization, SW upgrade, etc. C-RAN/vRAN architecture can reduce OAM costby several factors such as: (i) very low site visit cost for baseband capacity upgrade; (ii) the removal of basebandHW maintenance cost; (iii) automation of OAM work such as SW maintenance, SW upgrade, fault management,and performance optimization. The OAM cost of C-RAN/vRAN is assumed as 40% of D-RAN/DU (50% bycentralization effect in C-RAN, 20% by automated management of virtualized RAN).
193.3IMPACT OF CELL DENSITIFICATIONIt is generally understood that the D-RAN transport bandwidth requirement is less sensitive to the celldensification due to its relative small amount of additional midhaul bandwidth requirement, proportionalto the cell peak or average throughput. What follows is a validation of the transport cost change whenadding additional 3 sectors in the same site.In the following sensitivity study, additional C-band 3 sectors is installed in the network to cover theincreased traffic demand in the site. In D-RAN, this requires additional 10Gbps of transport bandwidthdemand. However, this additional bandwidth demand is accommodated within the existing 1 1 25GE links,thereby incurring no additional transport cost (2x 25GE as shown in Figure 3-4)Figure 3-4 : Cell Densification Example in D-RANCell Site #1 (18 cells)CPRI 2x25G/Massive MIMO RadioC-Band 3 Cell(100M, D16L/U8L)C-Band 3 Cell(100M, D16L/U8L)CPRI 1x10G/RadioAWS/PCS 3 3 Cell(20M, 4T4R)700/850 3 3 Cell(10M, 4T4R)CPRI 2x25G/Massive MIMO RadioCPRI 1x10G/RadioDUCentral Office (300 cells)Midhaul Ethernet 2x25GECSRCell Site #20 (18 cells)2x25GEEthernetMidhaulGatewayvCUUnlike D-RAN, in C-RAN or vRAN, additional transport bandwidth requirement for the eCPRI function split Opt.7-2x is 61.6Gbps as shown in Table 2-5. Thus, additional 100GE links need to be installed, and thus it ends up withdoubling the existing transport costs (4x 100GE as shown in Figure 3-5)Figure 3-5 : Cell Densification Example in C-RANCell Site #1 (18 cells)eCPRI 2x25G/Massive MIMO R
As vRAN software is utilizing Open Sources (e.g., OpenStack, K8s, ONAP, etc.) and 3rd party cloud management solutions (e.g., Redhat, VMware, public cloud infra management solutions from AWS, MS Azure, Google GCP), the seamless software upgrade available in the web-scale applications can be also applied in the Telco software management. For .