Transcription
NHS Maternity Survey 2021Benchmark ReportWest Suffolk NHS Foundation Trust
Contents1. Background &methodology2. Headline results3. Benchmarking4. Trends over timeSection 1.Antenatal careSection 4.Antenatal careSection 2.Labour and birthSection 5.Labour and birthSection 3.Postnatal careSection 6.Postnatal care5. AppendixThis work was carried out in accordance with the requirements of the international quality standard for Market Research, ISO 20252, and with the Ipsos MORI Terms and Conditionswhich can be found at http://www.ipsos-mori.com/terms. Care Quality Commission 20212Maternity Services Survey 2021 RGR West Suffolk NHS Foundation Trust
Background andmethodologyThis section includes: explanation of the NHS Patient Survey Programme information on the Maternity 2021 survey a description of key terms used in this report navigating the report
Background andmethodologyHeadline resultsBenchmarkingTrends over timeAppendixBackground and methodologyThe NHS Patient Survey ProgrammeThe NHS Patient Survey Programme (NPSP) collectsfeedback on adult inpatient care, maternity care,children and young people’s inpatient and day services,urgent and emergency care, and community mentalhealth services.The NPSP is commissioned by the Care QualityCommission (CQC); the independent regulator of healthand adult social care in England.As part of the NPSP, the Maternity Survey started in2007 and the 2021 Maternity Survey will be the eighthcarried out to date. The CQC use the results from thesurvey in the regulation, monitoring and inspection ofNHS trusts in England.To find out more about the survey programme and tosee the results from previous surveys, please refer tothe section on further information on this page.The Maternity Survey 2021The survey was administered by the CoordinationCentre for Mixed Methods (CCMM) at Ipsos MORI. Atotal of 45,445 mothers were invited to participate in thesurvey across 122 NHS trusts. Completed responses4were received from 23,479 respondents, this gives anational adjusted response rate of 52%. Responserates at a trust level will naturally vary, the averageresponse rate at a trust level is 53%.Therefore, data from the 2021 survey is comparablewith previous years, unless a question has changed orthere are other reasons for lack of comparability suchas changes in organisation structure of a trust.Individuals were invited to participate in the survey ifthey were aged 16 years or over at the time of deliveryand had a live birth at an NHS Trust between 1February and 28 February 2021. A full list of eligibilitycriteria can be found in the survey samplinginstructions. If there were fewer than 300 people withinan NHS trust who gave birth in February 2021, thenbirths from January were included.Where results are comparable with previous years, asection on historical trends has been included. Wherethere are insufficient data points for historical trends,significance testing has been carried out against 2019data.Fieldwork took place between April and August 2021.Trend dataPrior to 2021, the Maternity survey was conductedusing a solely paper based methodology. Following asuccessful pilot of a mixed method approach, the 2021survey transitioned to offer both paper and onlinecompletion methods. As part of the pilot surveyanalysis, it was concluded that this change inmethodology did not have a detrimental impact on trenddata. You can view this work on the cross surveyprogramme website.Maternity Services Survey 2021 RGR West Suffolk NHS Foundation TrustFurther information about the survey For published results for other surveys in the NPSP,and for information to help trusts implement thesurveys across the NPSP, please visit the NHSSurveys website. To learn more about CQC’s survey programme,please visit the CQC website.
Background andmethodologyHeadline resultsBenchmarkingTrends over timeAppendixBackground and methodology continuedAntenatal and Postnatal dataThe maternity survey is split into three sections thatask questions about: antenatal care labour and birth postnatal careIt is possible that some respondents may haveexperienced these stages of care in different trusts.This may be for many reasons such as moving home,or having to travel for more specialist care, or due tovariation in service provision across the country. Forthe purpose of benchmarking, it is important that weunderstand which trust the respondent is referring towhen they are completing each section of the survey.When answering survey questions about labour andbirth we can be confident that in all cases respondentsare referring to the trust from which they weresampled. It is therefore possible to compare results forlabour and birth across all 122 NHS trusts that tookpart in the survey.5Trusts were asked to carry out an “attributionexercise”, where each trust identifies the individuals intheir sample that are likely to have also received theirantenatal and postnatal care from the trust. This isdone using either electronic records or residentialpostcode information. This attribution exercise was firstcarried out in the 2013 survey. In 2021, 112 of the 122trusts that took part in the survey completed thisexercise.The survey results contained in this report include onlythose respondents who were identified as receiving allthree stages of care at this trust.Those trusts that did not provide the results of theattribution exercise to the CCMM at Ipsos MORI do notreceive results on the postnatal and antenatal sectionsof the survey.Limitations of this approachData is provided voluntarily, and not all trusts providedthis data. The antenatal and postnatal care sections ofthis report are therefore benchmarked against thoseother trusts that also provided the required information.Maternity Services Survey 2021 RGR West Suffolk NHS Foundation TrustSome trusts do not keep electronic records ofantenatal and postnatal care. Where this is the case,location of antenatal and postnatal care is based onresidential location of respondents. This is not aperfect measure of whether antenatal and postnatalcare was received at the trust. For example,respondents requiring specialist antenatal or postnatalcare may have received this from another trust. Thismay mean that some respondents are included in thedata despite having received care from another trust.
Background andmethodologyHeadline resultsBenchmarkingTrends over timeAppendixKey terms used in this reportThe ‘expected range’ techniqueThis report shows how your trust scored for eachevaluative question in the survey, compared withother trusts that took part. It uses an analysistechnique called the ‘expected range’ to determine ifyour trust is performing ‘about the same’, ‘better’ or‘worse’ compared with most other trusts. This isdesigned to help understand the performance ofindividual trusts and identify areas for improvement.More information can be found in the Appendix.StandardisationDemographic characteristics, such as age caninfluence care experiences and how they arereported. Since trusts have differing profiles ofmaternity service users, this could make fair trustcomparisons difficult. To account for this, we‘standardise’ the results, which means we apply aweight to individual patient responses to account fordifferences in demographic profile between trusts.For each trust, results have been weighted by parity(whether or not a mother has given birth previously)and age of respondents to reflect the ‘national’ age6distribution (based on all respondents to the survey).This helps ensure that no trust will appear better orworse than another because of its profile ofmaternity service users, and enables a fairer andmore useful comparison of results across trusts. Inmost cases this weighting will not have a largeimpact on trust results.Trust averageScoringIf fewer than 30 respondents have answered aquestion, no score will be displayed for that question(or the corresponding section the questioncontributes to). This is to prevent individualresponses being identifiable.For selected questions in the survey, the individual(weighted) responses are converted into scores,typically 0, 5, or 10 (except for questions B3 andD8). A score of 10 represents the best possible resultand a score of 0 the worst. The higher the score foreach question, the better the trust is performing.Only evaluative questions in the questionnaire arescored. Some questions are descriptive (for exampleA1) and others are ‘routing questions’, which aredesigned to filter out respondents to whomsubsequent questions do not apply (for example C1).These questions are not scored. Section scoring iscomputed as the arithmetic mean of question scoresfor the section after weighting is applied.Maternity Services Survey 2021 RGR West Suffolk NHS Foundation TrustThe ‘trust average’ mentioned in this report is thearithmetic mean of all trusts’ scores after weighting isapplied.Suppressed dataFurther information about themethodsFor further information about the statistical methodsused in this report, please refer to the surveytechnical document.
Background andmethodologyHeadline resultsBenchmarkingTrends over timeAppendixUsing the survey resultsNavigating this reportThis report is split into five sections:1. Background and methodology – providesinformation about the survey programme, how thesurvey is run and how to interpret the data.2. Headline results – includes key trust-level findingsrelating to the mothers who took part in the survey,benchmarking, and top and bottom scores. Thissection provides an overview of results for your trust,identifying areas where your organisation performsbetter than the average and where you may wish tofocus improvement activities.3. Benchmarking – shows how your trust scored foreach evaluative question in the survey, comparedwith other trusts that took part; using the ‘expectedrange’ analysis technique. This allows you to see therange of scores achieved and compare yourself withthe other organisations that took part in the survey.Benchmarking can provide you with an indication ofwhere you perform better than the average, and whatyou should aim for in areas where you may wish to7improve. Trusts that provide data on antenatal andpostnatal care and have sufficient respondentnumbers are also provided with antenatal andpostnatal benchmark results.4. Trends over time – includes your trust’s meanscore for each evaluative question in the survey. Thisis either shown as a historical trend chart or asignificance test table, depending on the availability oflongitudinal data.Where possible, significance testing compares themean score for your trust in 2019 to your 2021 meanscore. This allows you to see if your trust has madestatistically significant improvements between surveyyears.Historical trends are presented where data isavailable, and questions remain comparable for yourtrust since 2013. Trends are presented only wherethere are at least five data points available to plot onthe chart. Historical trend charts show the meanscore for your trust by year, so that you can see ifyour trust has made improvements over time. Theyalso include the national mean score by year, to allowMaternity Services Survey 2021 RGR West Suffolk NHS Foundation Trustyou to see whether your performance is in line withthe national average or not.Significance test tables are presented where thereare less than 5 data points available and questionsremain comparable between 2019 and 2021.5. Appendix – includes additional data for your trust;further information on the survey methodology andinterpretation of graphs in this report.
Background andmethodologyHeadline resultsBenchmarkingTrends over timeAppendixUsing the survey results continuedsurvey development report can also be found onthe NHS Surveys website.How to interpret the graphs in thisreportThere are several types of graphs in this report whichshow how the score for your trust compares to thescores achieved by all trusts that took part in thesurvey.The two chart types used in the section‘benchmarking’ use the ‘expected range’ technique toshow results. For information on how to interpretthese graphs, please refer to the Appendix. Information on the NHS Patient SurveyProgramme, including results from other surveys:www.cqc.org.uk/content/surveys Information about how the CQC monitors useinformation/using-data-monitor-servicesOther data sourcesMore information is available about the followingtopics at their respective websites, listed below: Full national results and technical document:www.cqc.org.uk/maternitysurvey National and trust-level data for all trusts who tookpart in the Maternity 2021 ernity/year/2021/. Full details of themethodology for the survey, instructions for trustsand contractors to carry out the survey, and the8Maternity Services Survey 2021 RGR West Suffolk NHS Foundation Trust
Headline resultsThis section includes: information about your trust population an overview of benchmarking for your trust the top and bottom scores for your trust
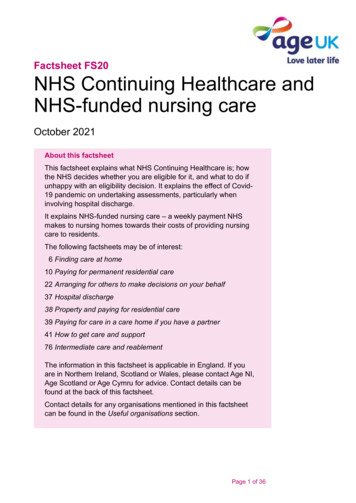
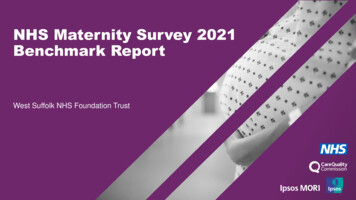
Background andmethodologyHeadline resultsBenchmarkingTrends over timeAppendixWho took part in the survey?This slide is included to help you interpret responses and to provide information about the population of mothers who took part in the survey.300 invited to take partETHNICITYRELIGION188 completed64%response rate53% average trust response rate50% response rate for your trust for 2019PARITYNot known3%Asian or Asian British2%Multiple ethnic groups2%BuddhistBlack or Black British0%HinduOther ethnic group0%MuslimJewishSikhof respondents gave birth totheir first baby.OtherPrefer not to sayGay / lesbianMaternity Services Survey 2021 RGR West Suffolk NHS Foundation Trust12%16-1829%19-2497%2%1%1%0%97% of participants described themselves asheterosexual or straight.102%2%1%0%0%0%0%AGEWhich of the following best describes how you thinkof yourself?Heterosexual / straight52%I would prefer not to sayOtherBisexual33%ChristianSEXUALITYHow many babies have you given birth to before thispregnancy?63%No Religion94%White27%25-2930-3432%35 and over
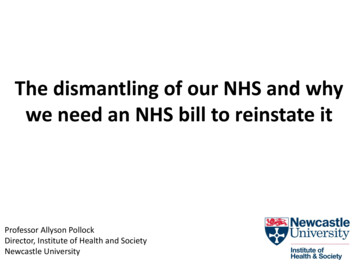
Background andmethodologyHeadline resultsBenchmarkingTrends over timeAppendixSummary of findings for your trustComparison with other trustsComparison with results from 2019The number of questions in this report at which your trust hasperformed better, worse, or about the same compared with mostother trusts.Much better than expectedThe number of questions in this report where your trust showed astatistically significant increase, decrease, or no change in scorescompared to 2019 results.0Statistically significant increaseBetter than expected1Somewhat better than expected1About the same48Somewhat worse than expected0Worse than expected0Much worse than expected02No statistically significant changeStatistically significant decrease393For a breakdown of the questions where your trust has performed better or worse compared with all other trusts, please refer to the appendix section “comparisonto other trusts”.11Maternity Services Survey 2021 RGR West Suffolk NHS Foundation Trust
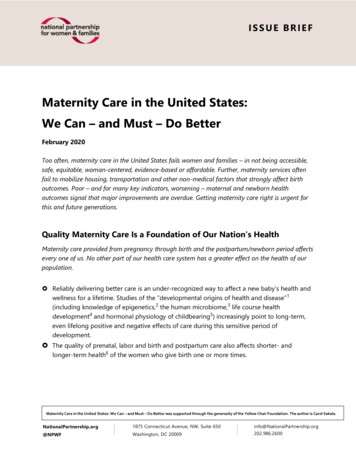
Background andmethodologyHeadline resultsBenchmarkingTrends over timeAppendixBest and worst performance relative to the trust averageThese five questions are calculated by comparing your trust’s results to the trust average (the average trust score across England). Top five scores: These are the five results for your trust that are highest compared with the trust average. If none of the results for your trust are above the trust average, then theresults that are closest to the trust average have been chosen, meaning a trust’s best performance may be worse than the trust average. Bottom five scores: These are the five results for your trust that are lowest compared with the trust average. If none of the results for your trust are below the trust average, thenthe results that are closest to the trust average have been chosen, meaning a trust’s worst performance may be better than the trust average.Top five scores (compared with average trust score across England)Your trust scoreAntenatal check-upsNational trust averageB10. During your antenatal check-ups, didyour midwives ask you about your mentalhealth?B4. At the start of your care in pregnancy,did you feel that you were given enoughThe start of your careinformation about coronavirus restrictionsin pregnancyand any implications for your maternitycare?05Bottom five scores (compared with average trust score across England)10Your trust scoreNational trust average05Care in hospitalD7. Thinking about your stay in hospital, ifyour partner or someone else close to youwas involved in your care, were they ableto stay with you as much as you wanted?6.3Care after birthF16. In the six weeks after the birth ofyour baby did you receive help and advicefrom a midwife or health visitor aboutfeeding your baby?6.68.92.2Care after birthF6. Did you see or speak to a midwife asmuch as you wanted?6.8Care after birthF1. Were you given a choice about whereyour postnatal care would take place?3.3Care in hospitalD2. On the day you left hospital, was yourdischarge delayed for any reason?7.0Care after birthF8. Did you feel that the midwife ormidwifery team that you saw or spoke toalways listened to you?8.3Care after birthF18. In the six weeks after the birth of yourbaby did you receive help and advice fromhealth professionals about your baby’shealth and progress?Feeding your babyE3. Did you feel that midwives and otherhealth professionals gave you activesupport and encouragement aboutfeeding your baby?7.2128.1Maternity Services Survey 2021 RGR West Suffolk NHS Foundation Trust10
BenchmarkingThis section includes: how your trust scored for each evaluative questionin the survey, compared with other trusts that tookpart an analysis technique called the ‘expected range’to determine if your trust is performing about thesame, better or worse compared with most othertrusts. for more guidance on interpreting these graphs,please refer to the appendixPlease note: following report redevelopment consultationsconducted in February 2021 the benchmark bandingswere updated to provide a greater level of granularity inthe expected range score.
BenchmarkingAntenatal care
Background andmethodologyHeadline resultsBenchmarkingTrends over timeAppendixThe start of your care during pregnancySection scoreThis shows the range of section scores for all NHS trusts included in the survey that submitted attribution data. Sections scores are calculated as the mean of a selectionof questions that fall under a particular theme. In this case, ‘the start of your care during pregnancy’ is calculated from questions B3 to B5. The colour of the line denoteswhether a trust has performed better, worse, or about the same compared with all other trusts (as detailed in the legend). The result for your trust is shown in black. The‘expected range’ analysis technique takes into account the number of respondents for each trust, and the scores for all trusts. As a result, a trust could be categorised as‘about the same’ whilst having a lower score than a 'worse than expected' trust, or categorised as 'about the same' whilst having a higher score than a 'better thanexpected' trust.Much worse than expectedSomewhat worse than expectedSomewhat better than expectedMuch better than expectedWorse than expectedAbout the sameBetter than expectedYour trustYour trust section score 5.5 (About the same)10.0Comparison with other trusts within your regionTrusts with the highest scoresCambridge UniversityHospitals NHSFoundation Trust5.5West HertfordshireHospitals NHS Trust4.2West Suffolk NHSFoundation Trust5.5The PrincessAlexandra HospitalNHS Trust4.45.3East Suffolk andNorth Essex NHSFoundation Trust4.85.0North West AngliaNHS FoundationTrust4.85.0BedfordshireHospitals NHSFoundation Trust4.8NHS trust score9.08.07.0Milton KeynesUniversity HospitalNHS FoundationTrustNorfolk and NorwichUniversity HospitalsNHS FoundationTrust6.05.04.03.0East and NorthHertfordshire NHSTrust2.01.00.0Each vertical line represents an individual NHS trustTrust score is not shown when there are fewer than 30 respondents15Maternity Services Survey 2021 RGR West Suffolk NHS Foundation TrustTrusts with the lowest scores
Background andmethodologyHeadline resultsBenchmarkingTrends over timeAppendixAntenatal check upsSection scoreThis shows the range of section scores for all NHS trusts included in the survey that submitted attribution data. Sections scores are calculated as the mean of a selectionof questions that fall under a particular theme. In this case, ‘antenatal check-ups’ is calculated from questions B7 to B10. The colour of the line denotes whether a trusthas performed better, worse, or about the same compared with all other trusts (as detailed in the legend). The result for your trust is shown in black. The ‘expected range’analysis technique takes into account the number of respondents for each trust, and the scores for all trusts. As a result, a trust could be categorised as ‘about the same’whilst having a lower score than a 'worse than expected' trust, or categorised as 'about the same' whilst having a higher score than a 'better than expected' trust.Much worse than expectedSomewhat worse than expectedSomewhat better than expectedMuch better than expectedWorse than expectedAbout the sameBetter than expectedYour trustYour trust section score 8.0 (About the same)10.0NHS trust score9.08.07.06.0Comparison with other trusts within your regionTrusts with the highest scoresThe Queen ElizabethHospital King's LynnNHS FoundationTrustMilton KeynesUniversity HospitalNHS FoundationTrust8.7North West AngliaNHS FoundationTrust7.58.2Cambridge UniversityHospitals NHSFoundation Trust7.7West Suffolk NHSFoundation Trust8.0Norfolk and NorwichUniversity HospitalsNHS FoundationTrust7.7West HertfordshireHospitals NHS Trust8.0BedfordshireHospitals NHSFoundation Trust7.8East and NorthHertfordshire NHSTrust8.0East Suffolk andNorth Essex NHSFoundation Trust7.85.04.03.02.01.00.0Each vertical line represents an individual NHS trustTrust score is not shown when there are fewer than 30 respondents16Maternity Services Survey 2021 RGR West Suffolk NHS Foundation TrustTrusts with the lowest scores
Background andmethodologyHeadline resultsBenchmarkingTrends over timeAppendixDuring your pregnancySection scoreThis shows the range of section scores for all NHS trusts included in the survey that submitted attribution data. Sections scores are calculated as the mean of a selectionof questions that fall under a particular theme. In this case, ‘during your pregnancy’ is calculated from questions B12 to B16. The colour of the line denotes whether atrust has performed better, worse, or about the same compared with all other trusts (as detailed in the legend). The result for your trust is shown in black. The ‘expectedrange’ analysis technique takes into account the number of respondents for each trust, and the scores for all trusts. As a result, a trust could be categorised as ‘about thesame’ whilst having a lower score than a 'worse than expected' trust, or categorised as 'about the same' whilst having a higher score than a 'better than expected' trust.Much worse than expectedSomewhat worse than expectedSomewhat better than expectedMuch better than expectedWorse than expectedAbout the sameBetter than expectedYour trustYour trust section score 8.4 (About the same)10.0NHS trust score9.08.07.06.0Trusts with the highest scoresThe Queen ElizabethHospital King's LynnNHS FoundationTrustNorfolk and NorwichUniversity HospitalsNHS FoundationTrustTrusts with the lowest scores8.7West HertfordshireHospitals NHS Trust7.98.4North West AngliaNHS FoundationTrust8.0West Suffolk NHSFoundation Trust8.4East Suffolk andNorth Essex NHSFoundation Trust8.0The PrincessAlexandra HospitalNHS Trust8.4BedfordshireHospitals NHSFoundation Trust8.18.4Milton KeynesUniversity HospitalNHS FoundationTrust8.35.04.03.0East and NorthHertfordshire NHSTrust2.01.00.0Each vertical line represents an individual NHS trustTrust score is not shown when there are fewer than 30 respondents17Comparison with other trusts within your regionMaternity Services Survey 2021 RGR West Suffolk NHS Foundation Trust
Background andmethodologyHeadline resultsBenchmarkingTrends over timeAppendixBenchmarking - Antenatal careQuestion scores: Start of your pregnancyMuch worse than expectedAbout the sameMuch better than expected012Worse than expectedSomewhat better than expectedYour trust3456Somewhat worse than expectedBetter than expectedTrust average789All trusts in England10Number ofrespondents(your trust)YourtrustscoreTrustLowest HighestaveragescorescorescoreB3 Were you offered a choiceabout where to have your baby?About thesame1233.43.52.25.3B4. At the start of your care inpregnancy, did you feel that youwere given enough informationabout coronavirus restrictionsand any implications for yourmaternity care?Somewhatbetter1616.35.64.56.8About thesame1586.76.24.98.2B5. Did you get enoughinformation from either amidwife or doctor to help youdecide where to have yourbaby?18Maternity Services Survey 2021 RGR West Suffolk NHS Foundation TrustTrust score is not shown when there are fewer than 30 respondents.
Background andmethodologyHeadline resultsBenchmarkingTrends over timeAppendixBenchmarking - Antenatal care (continued)Question scores: Antenatal check upsMuch worse than expectedAbout the sameMuch better than expected012Worse than expectedSomewhat better than expectedYour trust3456Somewhat worse than expectedBetter than expectedTrust average789All trusts in England10Number ofrespondents(your trust)YourtrustscoreTrustLowest HighestaveragescorescorescoreB7 During your antenatal checkups, did your midwives or doctorappear to be aware of yourmedical history?About thesame1616.46.54.67.7B8. During your antenatal checkups, were you given enoughtime to ask questions or discussyour pregnancy?About thesame1658.38.47.39.6B9. During your antenatalcheck-ups, did your midwiveslisten to you?About thesame1668.58.98.19.6B10. During your antenatalcheck-ups, did your midwivesask you about your mentalhealth?About thesame1668.98.06.59.419Maternity Services Survey 2021 RGR West Suffolk NHS Foundation TrustTrust score is not shown when there are fewer than 30 respondents.
Background andmethodologyHeadline resultsBenchmarkingTrends over timeAppendixBenchmarking - Antenatal care (continued)Question scores: During your pregnancyMuch worse than expectedAbout the sameMuch better than expected012Worse than expectedSomewhat better than expectedYour trust3456Somewhat worse than expectedBetter than expectedTrust average789All trusts in England10Number ofrespondents(your trust)YourtrustscoreTrustLowest HighestaveragescorescorescoreB12. Were you given enoughsupport for your mental healthduring your pregnancy?About thesame1018.48.46.39.6B13. During your pregnancy, ifyou contacted a midwifery team,were you given the help youneeded?About thesame1598.58.26.99.4B14. Thinking about yourantenatal care, were youspoken to in a way you couldunderstand?About thesame1669.49.38.89.720Maternity Services Survey 2021 RGR West Suffolk NHS Foundation TrustTrust score is not shown when there are fewer than 30 respondents.
Background andmethodologyHeadline resultsBenchmarkingTrends over timeAppendixBenchmarking - Antenatal care (continued)Question scores: During your pregnancyMuch worse than expectedAbout the sameMuch better than expected012Worse than expectedSomewhat better than expectedYour trust3456Somewhat worse than expectedBetter than expectedTrust average789All trusts in England10Number ofrespondents(your trust)YourtrustscoreTrustLowest HighestaveragescorescorescoreB15. Thinking about yourantenatal care, were youinvolved in decisions about yourcare?About thesame1628.78.77.49.5B16. During your pregnancy didmidwives provide relevantinformation about feeding yourbaby?About thesame1656.96.74.58.021Maternity Services Survey 2021 RGR West Suffolk NHS Foundation TrustTrust score is not shown when there are fewer than 30 respondents.
BenchmarkingLabour and birth
Background andmethodologyHeadline resultsBenchmarkingTrends over timeAppendixYour labour and birthSection scoreThis shows the range of section scores for all NHS trusts included in the survey. Sections scores are calculated as the mean of a selection of questions that fall under aparticular theme. In this case, ‘your labour and birth’ is calculated from questions C3, C4, C9, C10, C13, and C14. The colour of the line denotes whether a trust hasperformed better, worse, or about the same compared with all other trusts (as detailed in the legend). The result for your trust is shown in black. The ‘expected range’analysis technique takes into account the number of respondents for each trust, and the scores for all trusts. As a result, a trust could be categorised as ‘about the same’whilst having a lower score than a 'worse than expected' trust, or categorised as 'about the same' whilst having a higher score than a 'better than expected' trust.Much worse than expectedSomewhat worse than expectedSomewhat better than expectedMuch better than expectedWorse than expectedAbout the sameBetter than expectedYour trustYour trust section score 8.1 (About the same)10.0NHS trust score9.08.07.06.0Trusts with the highest scoresThe Queen ElizabethHospital King's LynnNHS FoundationTrustNorfolk and NorwichUniversity HospitalsNHS FoundationTrustTrusts with the lowest scores8.7Mid and South EssexNHS FoundationTrust7.38.2West HertfordshireHospitals NHS Trust7.4West Suffolk NHSFoundation Trust8.1The PrincessAlexandra HospitalNHS Trust7.6North West AngliaNHS FoundationTrust8.1East Suffolk andNorth Essex NHSFoundation Trust7.78.0Milton KeynesUniversity HospitalNHS Found
As part of the NPSP, the Maternity Survey started in 2007 and the 2021 Maternity Survey will be the eighth carried out to date. The CQC use the results from the survey in the regulation, monitoring and inspection of NHS trusts in England. To find out more about the survey programme and to see the results from previous surveys, please refer to