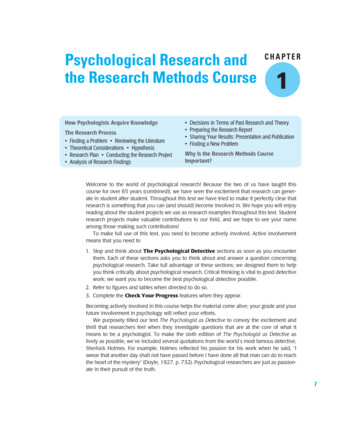
Transcription
International Journal of Economics &Management Sciencesagement ScaniMnal Journatiolnaonomics &EcofISSN: 2162-6359Rahi, Int J Econ Manag Sci 2017, 6:2DOI: 10.4172/2162-6359.1000403cesenInterResearch ArticleOpen AccessResearch ArticleOpen AccessResearch Design and Methods: A Systematic Review of ResearchParadigms, Sampling Issues and Instruments DevelopmentSamar Rahi*Universiti Sultan Zainal Abidin, Terengganu, MalaysiaAbstractThis study is aimed at to contribute a detailed systematic review on research paradigms, sampling and instrumentdevelopment issues in the field of business research. This study has reconnoitered the levels of theory and theirimplications in academic literature. With accession to this the methods of quantitative and qualitative research havebeen discussed. The main contribution of this study was to explore the sampling size issues. A meticulous reviewhas bared the exact sample size that is supported by different researchers. In line with measurement scale has alsobeen discussed based on previous literature support. Finally, the problems faced during scale development anditems generation are discussed in detail.Keywords: Research methods; Sampling issue; Research paradigms;Scale development processIntroductionfelt that positivist paradigm does not adequately address on socialand political issues. In views of this, authors like Fay [7], Kemmis andWilkinson [8] have arose the importance of advocacy paradigm in theirstudies. These researchers believe that inquiry needs to be entangledwith political and social issues. In accession of this research shouldcontain the agenda of reform that ultimately address the issues ofempowerment, inequality, oppression, domination, suppression, andalienation.The term ‘paradigm’ described as essential collection of beliefsshared by scientists, a set of agreements about how problems are tobe understood, how we view the world and thus go about conductingresearch [1]. Thus, these paradigms contain a basic set of beliefs orassumptions that guide our inquiries for a particular research [2]. Inviews of this, author like Myers and Avison [3] have stated that fordefining a valid research the most recommended method is to followthe research paradigm. This is essential because by selecting a specificparadigm researcher does not dwell in his own philosophical knowhow and get a better stance chosen in relation to other alternatives.There are mainly four paradigms that have been widely used ininformation system research include Positivism, Interpretive, Advocacyand Pragmatism [4]. Positivist, Interpretive and Advocacy paradigmare discussed below in Table 1, as Pragmatism is the combination ofInterpretive and Positivism.The aim of this paradigm is to find the weaknesses in the study andto strengthen it by using mix method approach [9]. The supporter of thisparadigm believes that true knowledge can be obtained by mix methodapproach. Instead of method being important, the problem is mostimportant and researchers should use all approaches to understandthe problem statement [10]. Pragmatism is not affiliated to any systemor philosophy. The researchers are free to use both quantitative andqualitative approaches; the essential is to find the best techniques andprocedure of research that solve problem statement.The positivist paradigmPhilosophical assumptionsThe supporters of this paradigm believe that true knowledge can beobtained through observation and experiment. So Positivists normallyselect scientific method to produce knowledge. Positivism is also calledScientific Method, Empirical Science, Post Positivism and QuantitativeResearch. Levine et al. [5], discussed that in positivism reality remainsstable and can be observed or described through an objective. A strongdebate is available on the issue of using positivist paradigm that whetherit is appropriate for social sciences or not [6].There are seven different philosophical assumptions compriseOntology, Epistemology, Axiology, Rhetoric, Methodology, Strategiesof Inquiry and Methods that follows all four paradigms. Ontology dealswith the nature of reality about the concept of knowledge whereasEpistemology deals with the connection between the researcher andthat being researched [11].The interpretive paradigmThe supporter of interpretive paradigm believes on the deepunderstanding of a concept and explores the understanding of theworld in which they live. They develop subjective meanings of theirexperiences or towards certain objects or things. This paradigm is alsocalled Constructivism, Social Constructivism or Qualitative Researchparadigm. Interpretive believe that true knowledge can only beobtained by deep interpretation of subject.The pragmatism paradigmLevels of TheoryTheory is a standardized principle on which basis we can explainthe relationship between two or more concepts and variables. There*Corresponding author: Samar Rahi, Universiti Sultan Zainal Abidin, Terengganu,Malaysia, Tel: 601114314906; E-mail: si1560@putra.unisza.edu.myReceived December 29, 2016; Accepted January 23, 2017; Published January25, 2017The advocacy/participatory paradigmCitation: Rahi S (2017) Research Design and Methods: A Systematic Review ofResearch Paradigms, Sampling Issues and Instruments Development. Int J EconManag Sci 6: 403. doi: 10.4172/2162-6359.1000403The supporters of advocacy paradigm claim knowledge through anadvocacy paradigm. This paradigm is also known as critical paradigm.A debate started during the 1980s and 1990s from individuals whoCopyright: 2017 Rahi S. This is an open-access article distributed under theterms of the Creative Commons Attribution License, which permits unrestricteduse, distribution, and reproduction in any medium, provided the original author andsource are credited.Int J Econ Manag Sci, an open access journalISSN: 2162-6359Volume 6 Issue 2 1000403
Citation: Rahi S (2017) Research Design and Methods: A Systematic Review of Research Paradigms, Sampling Issues and Instruments Development.Int J Econ Manag Sci 6: 403. doi: 10.4172/2162-6359.1000403Page 2 of 5Research Paradigm/Knowledge Claim PositionsPositivist ConstructivismDeterminationReductionismEmpirical observation and measurementTheory verificationAdvocacy/Participatory UnderstandingMultiple participant meaningsSocial and historical constructionTheory generationPragmatismPoliticalEmpowerment issue-orientedCollaborativeChange-oriented Consequences of actionsProblem-centeredPluralisticReal-world practice orientedTable 1: Depicts key functionalities of all paradigms posited by Creswell [1].are two levels of theory first abstract level that follows inductive theoryapproach and second is empirical level that follows deductive theoryapproach.Inductive levelCollis and Hussey [12] defined inductive approach this approachelaborate a process where theory is developed by observation that whatresearcher has observed during his research more over it may called aprocess where you induce or inferences your thought about a specificobject or variable. In accession to this Collis and Hussey have explainedthe induction process in which a relationship between meanings andactions of human subjects are used to be observed and investigated.Deductive levelAccording to Collis et al. deductive approach where you don’tget theory from observation theory already existed and proved byresearchers moreover you can explain a research that based on empiricalobservation and theory generated on conceptual and theoreticalstructure. Generally researcher intends to test a theory by collectingthe fresh data from respondents and observe the findings by applyingvarious statistical tests. This method is generally recommended forspecific studies in which researcher work on particular concept bycreating assumptions and then verifying those assumptions.Research MethodsDespite the existence of much research method classificationquantitative and qualitative methods are the most dominating methods.Detailed descriptions of these two methods are stated below.Qualitative methodQualitative method is used to collect the in-depth details on aparticular topic. This approach assumes a single person representsthe group feelings and emotions of a person are equally important tointerpret which are ignored by the quantitative method. This approachis usually used by the interpretive. Authors like Tashakkori andCreswell have explained that this approach is used when researcherwants to observe or interpret an environment with the intention todevelop a theory.Quantitative methodQuantitative method is a scientific method and its grounds can beidentified in positivist paradigm [13]. This method focuses on freshdata collection in accordance to the problem from large population andanalysis of the data but ignore an individual’s emotions and feelingsor environmental context. Similar to this have discussed that thequantitative strategy works on objective and measure it through theactions and opinions which helps researcher to describe the data ratherto interpret the data.Int J Econ Manag Sci, an open access journalISSN: 2162-6359Research objectives and classificationThere are three basic forms of research objectives that includeexploratory research, descriptive research, and explanatory research.The purpose of exploratory research is to seek new insights and findout what is happening. There is an attempt to ask questions and assesphenomena in a new light. This type of research is usually adopted inearly stages of research where the concepts are not clear enough todevelop an operational definition. A more qualitative approach oftenunderpins this sort of inquiry and the focus is on obtaining new insightsinto current situations and issues. Descriptive method of research refersto the type of research that aimed at obtaining information on currentstate of phenomena. This type of research sets out to provide an accurateprofile of situations, people or events. Similar to this accession authorlike Polit et al. [14] have stated that descriptive research seeks to observeand document an occurring phenomenon which cannot be ascribed anobjective value. Cohen et al. [15] have posited that explanatory researchhelps this type of study for instance explanatory research helps to findout the reasons behind the occurrence of a particular phenomenon.Explanatory research explains a situation or problem usually in theform of casual relationships. This type of research helps one to get freshinsight into a situation in order to build, elaborate, extend or test atheory. The prime objective of explanatory research is to identify issuesand key variable in a given research problem. This approach is muchrelevant to quantitative.Research strategyResearch Strategy defines it is a process of collecting andinterpreting of data with a clear objectives. Easterby-Smith et al. [16]have stated that, research strategy is a general plan like how to answerthe research question that has been set by researcher. Yin [17] hasposited that, based on three conditions-research question, control onbehavioral events, and focus on contemporary events there are five keyresearch strategies in social sciences. These are: experiment, surveys,archival analysis, histories and case studies.Experiments: The experimental method involves the process ofvariable testing where the impact of one variable can be seen with othervariables. Similar to this accession Malhotra et al. [18] have opinedthat this strategy is used when researcher examine cause and effectrelationships among variables.Survey: The survey strategy is popular in social sciences andassociated with deductive research approach [19]. In this researchstrategy information is collected by interviews or pre-designedquestionnaire.Archival analysis: The archival strategy reports the incidence andprevalence relates to a specific phenomenon. However it is difficult touse this strategy when it comes in research area.Volume 6 Issue 2 1000403
Citation: Rahi S (2017) Research Design and Methods: A Systematic Review of Research Paradigms, Sampling Issues and Instruments Development.Int J Econ Manag Sci 6: 403. doi: 10.4172/2162-6359.1000403Page 3 of 5History: This research strategy is used to explore past issues. Thisstrategy is adopted especially when no relevant person is alive to giveanswer or to report about particular issue.Case study: The case study strategy is a written description of aproblem or a situation. It presents small group problems or focus on aparticular issue. Case study preferred when researcher has little controlon events.Population and SamplingPopulation can be defined as all people or items that one wishesto understand while sampling is the process of selecting segment ofthe population for investigation. It is a process of selecting a sampleof units from a data set in order to measure the characteristics, beliefsand attitudes of the people [20]. Sampling survey involves structuredquestionnaire to evaluate people beliefs and attitudes. Collected data viastructured questionnaire can be enumeration of a selected populationor subgroup. Authors like Malhotra and Birks [21] have explained thata smaller group of population has ability to make an inference abouta larger group of population. This type of selection is also beneficialto reduce the work burden and cost that would have been involved instudying the whole target population. Similar to this Cooper et al. [22]have posited, there are several reasons for sampling including: betterspeed of data collection, results accuracy and cost efficiency. Selectionof sampling method depends on the nature of the research study. Itmay include theoretical and practical issues. There are broadly twotypes of sampling methods, probability sampling and non-probabilitysampling. The following describes the main sampling techniques andsampling method usually used in business studies.Probability sampling: Probability sampling is a sampling approachin which each unit has an equal chance of probability to be selected.Probability sampling is further divided into four categories including:simple random sampling, systematic random sampling, stratifiedrandom sampling, cluster sampling and Multi-stage Sampling.Simple random sampling: In line with the definition ofrandomization, it is a sampling process in which each unit of thepopulation has an equal probability of inclusion in the sample. It can becalculated with sampling fraction that is n/N where n stands for samplesize and N for the population size. In this method researcher develop anumeric list of all sample size and by using computer program generaterandom numbers.Systematic random sampling: Probability sampling techniquewhere initial sampling point is selected at random and then the casesare selected at regular intervals. For instance in this method researchersystematically choose the first number that is 5 and then the other caseswill select at regular interval- 25, 35,45,55 so forth.Stratified random sampling: It is a process of sampling in whicheach subgroup called strata is given equal chance to be selectedrandomly. It gives equal proportionate representation to each stratum.Cluster sampling: Sampling technique where researcher derivesample out of aggregations of population that are geographicallydispersed and possibly unable to access at the same time. It could be 10banks in cluster from all around the world.Multi-stage sampling: Multi-stage sampling or Multi stage clustersampling involves a sequence of stages [23]. First stage is to select therandom sample of the entire region in cluster. The second stage is toselect a specific region and at final stage to select relevant objects forsample size.Int J Econ Manag Sci, an open access journalISSN: 2162-6359Non-probability samplingNon-probability sampling is the sampling approach in whichthe chance or probability of each unit to be selected is not known orconfirmed.Convenience sampling: Convenience sampling defines a processof data collection from population that is close at hand and easilyaccessible to researcher. Convenience sampling allows researcher tocomplete interviews or get responses in a cost effective way howeverthey may criticized from selection bias because of the difference of thetarget population.Snowball sampling: In snowball sampling technique the researchermakes initial contract with a small group of people who are relevantto the research topic and then uses them as referrals to contact withothers.Quota sampling: It defines the strata of the population and to seta quota for sample element from each stratum. The findings from thistype of sampling technique cannot be generalized because the elementis not selected by using a probability sampling method.Judgment sampling: Defines a process where researcher use ownjudgment to select a group of people who knows about the problem.Judgmental sampling is also called purposive sampling because itinvolves a particular purpose. This type of sampling technique isconvenience and cost effective.Sampling frameSampling frame defines a frame where a sample of target populationcan be drawn. Similar to this accession authors like Creswell and Clark,have stated that, a sample frame can be defined as a list of all units in thepopulation from which research sample will be selected.Determine sample sizeThere is an extensive discussion existed in academic literature onsample size. Selection of a correct sample size is still a big challenge forresearchers. Sample size needs to be carefully considered as statisticaltechniques are strongly affected by it. Similar to this accession authorslike Collis and Hussey have posited, sample size which is based onanalysis method for instance structural equation modeling that furtheranalyze confirmatory factor analysis, casual modeling with latentvariables, structural path analysis and multiple regression analysismust be treated carefully. In light with these arguments, sample sizefor this study was selected by following most important rule of thumbquoted in academic literature. Authors like Krejcie and Morgan [24]have stated that if the given population was 1000000 then the requiredsample size would have to be 384. Further, if this rule is applied in abcstudy which deals a population of 1800000 units then, the sample sizewould have to be 384.s X 2 NP (1 P) d 2 ( N 1) X 2 P (1 P).s denote required sample size.X2 denote the table value of chi-square for 1 degree of freedom atthe desired confidence level (3.841).N denote population size.P denote population proportion (assumed to be .50 since thiswould provide the maximum sample size).d denote the degree of accuracy expressed as a proportion (.05).Volume 6 Issue 2 1000403
Citation: Rahi S (2017) Research Design and Methods: A Systematic Review of Research Paradigms, Sampling Issues and Instruments Development.Int J Econ Manag Sci 6: 403. doi: 10.4172/2162-6359.1000403Page 4 of 53.841 (1800000 0.50 ) (1 0.50 )0.50 (1800000 1) 3.841 0.50 (1 0.50 )S S1728450 3844500Authors like Cochran proposed a sampling formula. Stated thatof the population is larger an ideal sample size would have to be 267.Following is the detail description of mathematical formula proposedby Cochran.n0 z 2 p (1 p )e2Wheren0 is the sample sizeZ is the two tailed area under the normal curve where α 0.05 andthe z value is 1.96e is the acceptable sampling errorp is the population of a proportion with a desired attribute(assumed to be 0.5 which maximises the sample size to be determined)Given these values and an acceptable sampling error of 6.5%, thesample size is determined as: This gives the acceptable sample size tobe approximately 267.In case of analysis method research where structural equationmodeling applied following recommendation should be in account.According to Schikorski and Stevens [25], 15 cases per construct areample when multiple regression analysis is required. If this formulaapplies in this study, 10 constructs multiplied by 15, equals to 150sample size. Whereas Bollen [26] stated that ration of five sampleper variable. Jöreskog and Sörbom [27] stated that sample size mustbe 10 observations per parameter to perform CFA. Another study byTabachnick and Fidell [28] suggested that sample size should be 300valid responses for factor analysis study. According to Joseph F Hairstated, research that required factor analysis procedure in order todetermine the dimensionality for the employed items, the sample sizethat should be obtained is five times greater (minimum) or ten timesgreater (maximum) than the items that want to be analyzed. Similarto this Hair posited that a minimum sample size of 200 is required forstructural equation modeling. In light of this simple random samplingapproach was used and data collected via online survey. Finally,Comrey and Lee [29] stated that sample size of 50 is very poor, while100 is poor, 200 is reasonable, 300 is good, 500 is very good and 1000 isbrilliant for structural equation modeling.Data collection methodData was collected via email service. A help was taken from thirdparty (Mail Chimp) to get response on self-administered questionnaire.The main objective to use third party (mail chimp) was to make thisstudy non-contrive. In non-contrived research setting researcherinfluence becomes minimum unlike contrive research. From list of1.8 million internets banking customers 1000 customers was selectedvia simple random sampling approach. Simple random sampling isthe most favorable and supportive technique in quantitative studieswhere individuals get equal opportunities to participate in the study.By following factors that influence on internet banking adoption inPakistan a cross sectional approach was adopted. In Cross sectionalstudy data could be collected once at a time. The overall data collectionmethod went through three distinct steps: includes designing ofinstrument, sample size and implementation of survey via using onlineInt J Econ Manag Sci, an open access journalISSN: 2162-6359services of mail chimp. As the nature of this study is quantitative andresearcher is following positivist paradigm data collection throughquestionnaire deemed most appropriate approach.Data type and sourcesGenerally there are three types of data sources include primary,secondary and tertiary. Primary data usually represent publications,Reports, Theses, Emails, Conference reports, Company reports orsome government publications. Primary data is the most influencingtechnique in quantitative method.Instrument Development and Measurement ScaleStudy that was conducted under positivist philosophical aspects,in that quantitative method was the best for data collection. Surveyquestionnaire is used to measure respondents liking, how they feel ordo in a group or individual.Items developmentIn views of authors like Churchill Jr [30] stated that item developedby two steps. Primarily, specifying the domain of construct where theitems were adopted to ensure the validity of the content. Secondly,generation of item scale where the item scale selected by literaturereview.Questionnaire designAuthors like Pinsonneault and Kraemer [31] have stated thereare three main objectives for conducting research with surveyquestionnaire when: 1) Data of the research is based on quantitativemethods, 2) Instruments are used in research must be pre-defined, 3)Research work that requires to analyze finding of a sample to wholepopulation.Measurement scaleIn survey questionnaire Likert-type scales are commonly used tomeasure observations and attitudes [32]. These rating scales containeither five or seven response categories and have their own pros andcons. Supporter of 5- point Likert-type scale states that, it was usedto increase response rate and quality with special focus of reducingrespondent frustration level. Literature suggests that a five-pointscale is readily comprehensible to respondents and enables them toresponse their views in a better way [33]. However few researchersprefer to do analysis with seven-type Likert scale. Symonds [34] wasthe first to propose that reliability is optimized with seven-type Likertscale. In line with Miller, [35] stated that human mind has span ofabsolute judgment that can differentiate objects till seven categoriesbeyond seven might be useless. Author like Thomas and Lewis [36]posited that seven-point scales depicted better correlations with t-testresults. Seven-point Likert scale appears to be more suited in electronicsurvey [37]. Literature confirms that data from Likert items becomessignificantly less accurate when the number of scale drops five orabove seven [38]. Authors like Hair JF, Black WC, Babin BJ, AndersonRE, Tatham RL [39] have stated that if the focus of the research is onindividuals behavior then five to seven-point Likert can be selectedto measure the items. In light of findings there is some support withseven-point scale but the popularity of five-point Likert scale seems tobe less justified [40-45].ConclusionThis study accomplishes a systematic review on researchVolume 6 Issue 2 1000403
Citation: Rahi S (2017) Research Design and Methods: A Systematic Review of Research Paradigms, Sampling Issues and Instruments Development.Int J Econ Manag Sci 6: 403. doi: 10.4172/2162-6359.1000403Page 5 of 5paradigms, sampling and instrument development process. A set ofbeliefs of different researchers on paradigms was weighed up in detail.Meanwhile, the research methods were also explored with differentsupporting arguments. For quantitative study, levels of theory are themost important factors so in this regards researcher has enlightenedinductive and deductive approaches of a theory. Sampling is the criticalissue in every study that has been conducted with primary data so toovercome on this, following study proposed two formulas to determinesample size. Furthermore, opinions of different authors have beenquoted regarding selection of sample size. Finally, measurement scaleand items generation process were also conferred in this study that willsupport to get exact picture of quantitative studies.References1. Creswell JW (2003) Research design. Sage Publications: Thousand Oaks, CA.2. Guba EG, Lincoln YS (2005) Paradigmatic controversies, contradictions, andemerging confluences.3. Myers MD, Avison D (2002) Qualitative research in information systems: areader: Sage.4. Willcocks LP, Mingers J (2004) Social theory and philosophy for informationsystems: John Wiley & Sons Ltd.5. Levine A, Sober E, Wright EO (1987) Marxism and methodological individualism.New Left Review 162.6. Hirschheim R (1985) Information systems epistemology: An HistoricalPerspective. Research Methods in Information systems 13-35.7. Fay B (1987) Critical social science: Liberation and its limits. Social IndicatorsResearch 21: 441-443.8. Kemmis S, Wilkinson M (1998) Participatory action research and the study ofpractice. Action research in practice: Partnerships for social justice in education1: 21-36.9. Johnson RB, Onwuegbuzie AJ (2004) Mixed methods research: A researchparadigm whose time has come. Educational researcher 33: 14-26.10. Tashakkori A, Teddlie C (1998) Mixed methodology: Combining qualitative andquantitative approaches 46.11. Creswell JW, Clark VLP (2007) Designing and conducting mixed methodsresearch.12. Collis J, Hussey R (2013) Business research: A practical guide forundergraduate and postgraduate students: Palgrave macmillan.13. Grinnell Jr, RM, Unrau YA (2010) Social work research and evaluation:Foundations of evidence-based practice: Oxford University Press.14. Polit D, Beck CT, Hungler B (2001) Essentials of nursing research.15. Cohen L, Manion L, Morrison K (2013) Research methods in education:Routledge.25. Schikorski T, Stevens CF (1997) Quantitative ultrastructural analysis ofhippocampal excitatory synapses. The Journal of Neuroscience 17: 5858-5867.26. Bollen KA (1989) A new incremental fit index for general structural equationmodels. Sociological Methods & Research 17: 303-316.27. Jöreskog KG, Sörbom D (1996) LISREL 8: User's reference guide: ScientificSoftware International.28. Tabachnick BG, Fidell LS (2007) Experimental designs using ANOVA:Thomson/Brooks/Cole.29. Comrey A, Lee H (1992) A first course in factor analysis. Hillsdale, NJ: Erlbaum.30. Churchill Jr, GA (1979) A paradigm for developing better measures of marketingconstructs. Journal of Marketing Research 16: 64-73.31. Pinsonneault A, Kraemer K (1993) Survey research methodology inmanagement information systems: an assessment. Journal of ManagementInformation Systems 10: 75-105.32. Buttle F (1996) SERVQUAL: review, critique, research agenda. EuropeanJournal of Marketing 30: 8-32.33. Cox DR, Isham V (1980) Point processes. CRC Press.34. Symonds C, Oxon MD, Lond MRCP (1924) The pathological anatomy ofdisseminated sclerosis. Brain 47: 36-56.35. Miller GA (1956) The magical number seven, plus or minus two: Some limits onour capacity for processing information. Psychological Review 101: 343-352.36. Thomas RB, Lewis J (1993) A comparison of selection at list time and time‐stratified sampling for estimating suspended sediment loads. Water ResourcesResearch 29: 1247-1256.37. Finstad K (2010) The usability metric for user experience. Interacting withComputers 22: 323-327.38. Johns R (2010) Likert items and scales. Survey Question Bank: Methods FactSheet 1.39. Hair JF, Black WC, Babin BJ, Anderson RE, Tatham R. (2010) MultivariateData Analysis, (7th e d.), Pearson publishers, USA.40. Preston CC, Colman AM (2000) Optimal number of response categoriesin rating scales: reliability, validity, discriminating power, and respondentpreferences. Acta Psychologica 104: 1-15.41. Cochran W (1977) G (1977) Sampling techniques, (3rd ed.), New York, Wileyand Sons 98: 259-261.42. Guba EG, Lincoln YS (1994) Competing paradigms in qualitative research.Handbook of qualitative research 105.43. Hair JF (2010) Multivariate data analysis: Pearson College Division.44. Saunders MN (2
Despite the existence of much research method classification quantitative and qualitative methods are the most dominating methods. Detailed descriptions of these two methods are stated below. Qualitative method Qualitative method is used to collect the in-depth details on a particular topic. This approach assumes a single person represents