Transcription
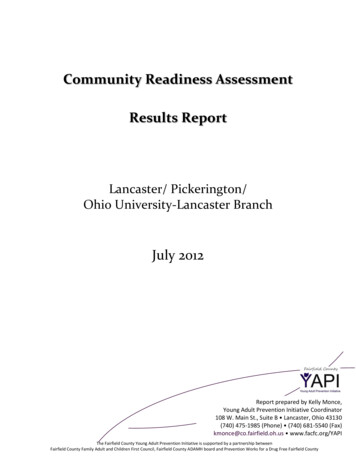
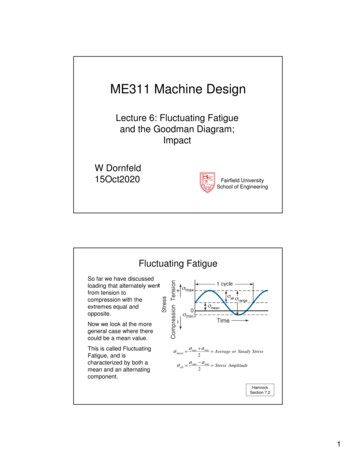
ME311 Machine DesignLecture 6: Fluctuating Fatigueand the Goodman Diagram;ImpactW Dornfeld15Oct2020Fairfield UniversitySchool of EngineeringFluctuating FatigueSo far we have discussedloading that alternately wentfrom tension tocompression with theextremes equal andopposite.altrangemeanNow we look at the moregeneral case where therecould be a mean value.This is called FluctuatingFatigue, and ischaracterized by both amean and an alternatingcomponent.σ mean σ alt σ max σ min2σ max σ min2 Average or Steady Stress Stress AmplitudeHamrockSection 7.21
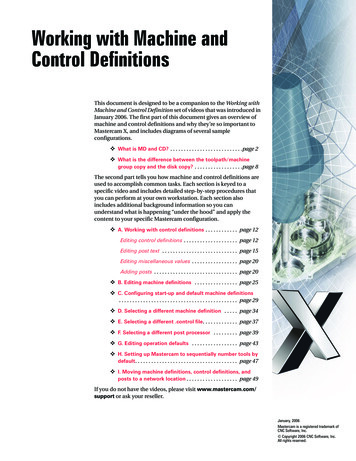
σ mean σ max σ minσ alt 2σ max σ min2σ meanσ altFluctuating orFully Reversing?804040-40400Effect of Mean StressThis axis is thefraction that σaltis of theEnduranceStrength, SeCirclesrepresentfailuresAs the Mean stressincreases, thematerial breaks at alower Alternatingstress amplitude.This axis is the fraction that σmean is ofthe Ultimate Strength, Sut2
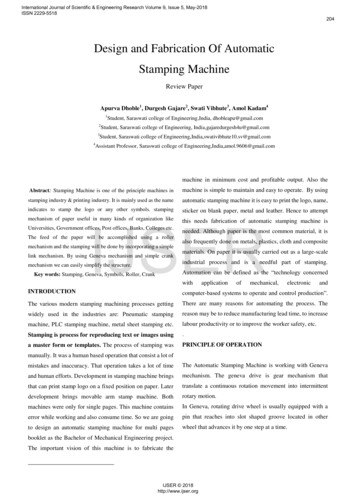
Fluctuating Fatigue DiagramsSeveral ways are availableto characterize theFluctuating Fatiguebehavior. Two commonones are: Goodman line and Gerber line.Both approximate thematerial behavior. We willuse the Goodman linebecause it is simpler andconservative.The Modified GoodmanDiagram is the red line andis the Goodman linetruncated by the Yield line.Modified GoodmanDiagramHamrockSection 7.10Drawing the ModifiedGoodman DiagramThe diagram is based onmaterial properties Sut,Sy, and Se.As with the S-N curve, Seshould be derated toreflect your part:Se kf ks kr kt km Se’(My Part)(Test Specimen)For torsional (shear)loading, useSsy 0.577 Sy,Sus 0.67 Sut, andSe for Torsion3
Drawing the ModifiedGoodman DiagramThen plot your alternatingand mean stress.If your point is below theMod Goodman line, the partshould have unlimited life.σaltσmeanNote: This is very different from the “complete” ModifiedGoodman Diagram that Hamrock details on P. 178 – 179.We will not use that version – it is pretty confusing.Factors of SafetyAlt.OnlyThe Factor of Safetydepends on how thestresses behave. Theymight:1. Grow proportionately2. Only grow in mean3. Only grow in alternatingHow they behave dependson the actual hardware andloading involved.ProportionalσaltMean Onlyσmean4
If σalt and σmean Increase ProportionatelyTo make theGoodman Linew/F.O.S. go through(σM,σA) :1 σσ A Se ( M )n SutσA SeSeLoadLineSe/nσAσσ M meanσaltσA1 σM n SutσM1 σA σM n S e SutEquations ofthe GoodmanLine:σ alt σ alt Sut/nSutσmeanσSeσ mean S e S e ( mean 1)S utSutFor a Factor of Safety of n :orσ alt S e (1 σ meanSut)1 σ mean)nSutσ alt S e ( If σalt and σmean Increase Proportionatelyσ alt LimEquation to find alternatingstress when operating pointhits the FOS line orGoodman line.Se1n σ M Se 1 σSAut SeSet n 1 to get thislevelSe/nσaltσAσMSut/nσmeSutan5
If Only σalt IncreasesEquation of theGoodman Line:σ alt S e (1 σ meanSutσ a max S e (1 σMS utSeσa max)σaltσA)σMEquation to find alternatingstress when operating pointhits the Goodman line.Sutσmeann σ a maxσAFatigue ExerciseGiven a bar of steelwith these propertiesYieldUltimateTensileEnduranceOn a Goodman Diagram, predictfatigue for these loadings:40 ksi65 ksi30 nating Stress (ksi)6050403020100010203040506070Mean Stress (ksi)6
Fatigue ExerciseMinYieldUltimateTensileEnduranceA.B.C.40 ksi65 ksi30 ksiMax0-27-18Mean363746Alt1851418 ksi32 ksi32 ksi454035CAlternating Stress n Stress (ksi)Fatigue Diagram for Finite LifeFrom EngRasp ETBX7
Another Type of Fatigue DiagramNote Finite Life curvesσalt 50 ksiσmean 70 ksiStress Ratios for This DiagramStress ratio R σalt 50 ksiσmean 70 ksiσ minσ maxAmplitude ratio A σ altσ mean8
More Cantilever BeamDetails12 Gauge (0.1094” thick)0.75 in. wide4 in. longHigh Strength Steel, withSut 245 ksiMachined finishRoom TemperatureIgnore StressConcentrationSe kf ks kr S’e (0.63)(1)(0.87)(100) 54.8 ksiCASE 2: Tip is flexed between 0.075 in and 0.225 in. What is lifefor 95% survival?By proportioning, the force now fluctuates between 8.631 lb and 3 x8.631 25.893 lb.Stresses go from 23.1 ksi to 69.3 ksi.0.225TipDeflection Cantilever Beam, contd.0.225TipDeflection 0.150(in)0.07569.3σalt46.2σmean0Alternating Stress (ksi)23.10σ mean σ alt Stress(ksi)σ max σ min2σ max σ min269.3 23.1 46.2 ksi269.3 23.1 23.1ksi2 0260Mean Stress (ksi)9
σ mean 46.2 ksiσ alt 23.1ksiAlternating Stress (ksi)Cantilever Beam 0240260Mean Stress (ksi)What is the Factor of Safety?A. If both alternating and mean stresses increase proportionately:1 σ A σ M 23.1 46.2 0.422 0.189 0.611n S e Sut 54.8 245n 1 1.640.611B. If only alternating stress increases:σ a max S e (1 n σMSut) 54.8(1 46.2) 54.8(1 0.189) 44.4 ksi245σ a max 44.4 1.92σA23.1General Fatigue Analysis ProcedureA. You always need:1. The material – Sut & maybe Sy2. The type of Loading- Axial; Bending; or Shear3. The Max and Min StressUse these toget Se’Get σmean & σaltB. If you have Reliability, Surface, or Size information, then you must adjust Se’ to representyour part. Se Kf * Ks * Kr * Se’.C. If σmean 0, then it’s fully reversing and we use an S/N diagram1. If σalt Se, life is infinite and you’re done.2. Otherwise, calculate the 1000 Cycle value SL,and draw the S/N plot.3. Calculate a SL 2/Se, and b -1/3 Log10 ( SL / Se)4. Then you can calculate S aN b or N (σalt/ a) 1/bD. If σmean 0, then it’s fluctuating and we use a Goodman diagram1. Draw the Goodman line between Se and Sut.2. Add the Yield Line between Sy and Sy.3. Plot the operating point (σmean, σalt).4. Depending on how the stress might increase, calculate the FOS.10
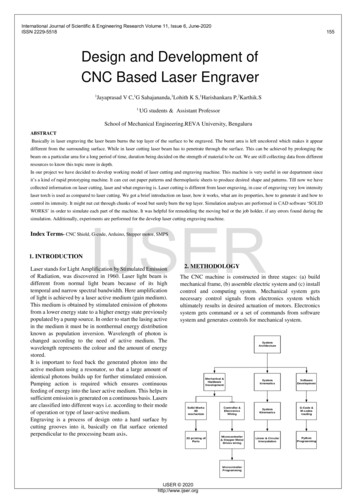
The energy of the falling block istransferred to stored energy inthe spring:W (h δ max ) Impact1( k δ max ) δ max2WStatic displacement of Weight gentlyplaced on Spring of stiffness, kδ st hWkImpact factor isδP2hI m max max 1 1 δ static Wδ stWkEffect is dependent on SpringStiffness. A soft spring meanslarge static deflection, whichmeans smaller Impact factor.δImpact significantly increases forces!ImpactFor this situation, what is:1. The static deflection2. The Impact factor3. The max deflection4. The max force10Lb10”10Lb100Lb/inδ11
ImpactFor the case of a weight slidinghorizontally with a velocity, V,and hitting the springδ maxkWV 2 gkVwhere g is the gravitationalconstant, 386 in/s2 or 9.8 m/s2.Recognizing that W/k δstδ max Wδδ stV 2gWImpactFor this setup, what velocitygives the same max force as thefalling weight just did?100Lb/inV10Lbδ10Lb12
ImpactRead Hamrock’s Example 7.11 of a diver landing on a diving board.Note that the spring here is a beam, whose stiffness is calculated asForce/Deflection.Also note that he deflects the end of the board 92mm [3.62”], andsees a max force of 13.5kN [3035lb]!13
ME311 Machine Design W Dornfeld 15Oct2020 Fairfield University School of Engineering Lecture 6: Fluctuating Fatigue and the Goodman Diagram; Impact Fluctuating Fatigue So far we have discussed loading that alternately went from tension to compression with the extremes equal and opposite. Now we look at the more general case where there could be a mean value. This is called Fluctuating Fatigue .