Transcription
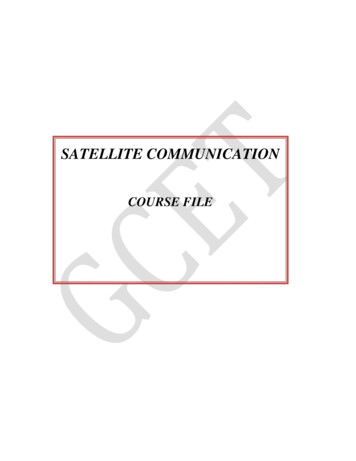
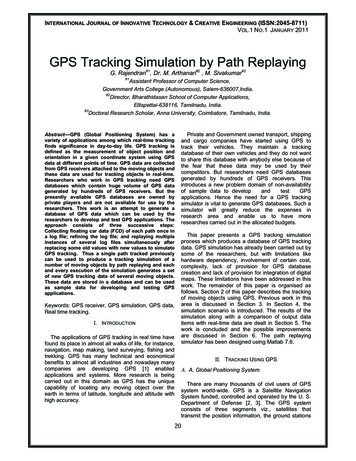
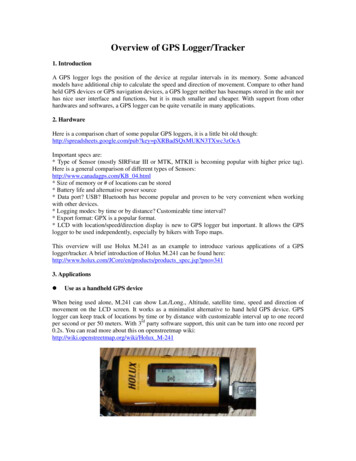
Application NoteCoverage Mapping with GPSWith Option 431 in Anritsu Handheld Spectrum AnalyzersIntroductionSpectrum analyzers provide accurate RF power measurements over a wide frequency range. With an antennaattached, RF power measurement becomes Received Signal Strength (RSSI). RSSI measurements can becombined with on-screen map displays to become a very versatile solution for mapping the coverage of RFtransmitters.Anritsu handheld analyzers with spectrum analysis capability can include Option 431, Coverage Mapping.This option supports the needs for both indoor and GPS coverage mapping.In this application note, you will learn how to fully operate the instrument in accordance to the coveragemapping with GPS process. This type of mapping requires Option 31, GPS (with the exception of the BTSMaster, where it is standard), and an external GPS antenna. The GPS receiver will automatically pinpoint yourlocation relative to the map.Anritsu easyMap Tools The easyMap Tools software provides maps in formats that Anritsu's handheld spectrum analyzers can usefor coverage mapping. It helps users find and prepare geo-referenced maps for use by Anritsu handheldSpectrum Analyzers.The easyMap allows users to quickly: Create geo-referenced maps Use either Google Maps or MapQuest (an Open Street Maps provider) to source maps Convert other maps or drawings to a form suitable for use on Anritsu handheld spectrum analyzers Insert GPS information into previously non-geo-referenced mapsThe easyMap software sources map data from either Google Maps or MapQuest. Maps sourced from Googlecan be displayed as Terrain Maps, Road Maps, Hybrid Maps (a combination of satellite and road maps)and as Satellite view maps. However, Google Maps is not available in every country due to country specificrestrictions. MapQuest-sourced maps are available as road maps, and come from the OpenStreetMapsmovement. At this time, they are freely downloadable wherever internet access is available.The easyMap software translates the map source into a format readable by Anritsu handheld spectrumanalyzers. Two map formats are available; legacy .map files and the new Anritsu Zoomable Map (AZM) .azmfiles. AZM map files allow up to seven zoom levels and panning and zooming using the interference analyzer(option 25). The result is the ability to hunt interference over a large geographic area and at the same timeshow the detail needed to locate what you find. Pan and Zoom functionality is not yet available for coveragemapping.
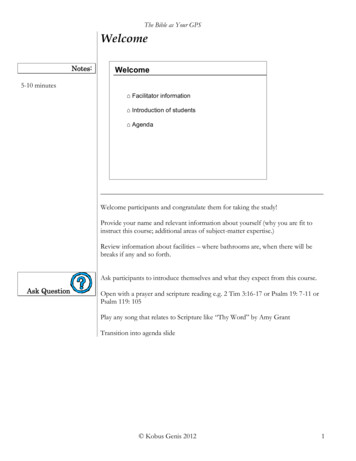
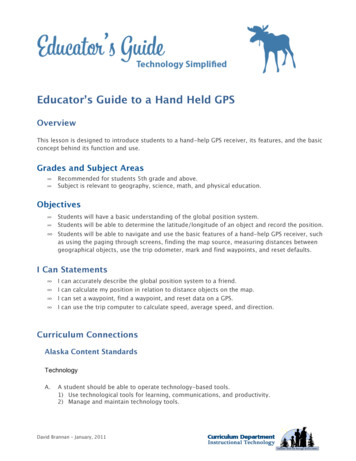
Figure 1: Create GPS geo-referenced maps with easyMapGetting StartedPrior to conducting the coverage mapping survey, the analyzer itself must first be configured to properlymeasure the signals of interest. Knowledge of various parametrics such as anticipated signal strengthand variation, potential presence of interfering signals, and noise sources should be used in determininganalyzer settings. A brief summary of the main analyzer setups is shown below. However, the user maywant to refer to the instrument user manual for more detailed guidance.1. Bandwidth Parametersa. Resolution Bandwidth (RBW): minimum bandwidth over which one can separate two signalsfor viewing. The RBW can be decreased for viewing closely spaced signals at the expense ofacquisition time. A low RBW is also advantageous in limiting noise distortion and resolution oflow-level signals.b. Video Bandwidth (VBW): used for averaging and filtering noise. This is particularly useful indiscerning low-level signals in the presence of noise.2. Reference Level, Pre-Amplifier and Attenuatora. Reference Level: Input signal levels are referenced to the top line of the graticule, known as thereference level. Depending on the amount of power anticipated in the signals to be measured, thereference level should be adjusted accordingly.b. Pre-Amplifier and Attenuator: In order to present the proper signal level to the analyzer detectioncircuits, pre-amplification or attenuation can be adjusted on the signal input. The attenuator canbe automatically adjusted as a function of the reference level. In general, signals below –40 dBmcan use the pre-amplifier while signals over –30 dBm should be attenuated. For example, if thereference level setting is 20 dBm, attenuation should be set to 50 dB for a mixer input of –30 dBm.3. Detector Typea. Various detection circuits can be utilized. These include Peak, RMS, Negative and Sample. The typeof detection is predicated on the user’s measurement needs.4. Filteringa. Filtering should be used to measure signals in the presence of interferers. Filters can be addedto the input of the analyzer to discriminate between wanted and unwanted signals, avoidingcorruption of the measurement with adjacent high level signals.5. Frequencya. Select frequency to be measured.To access the Coverage Mapping menu, either press the main menu icon SPA Coverage Mapping, or pressthe Shift Measure (4) key, the More, and then the Coverage Mapping submenu key.2
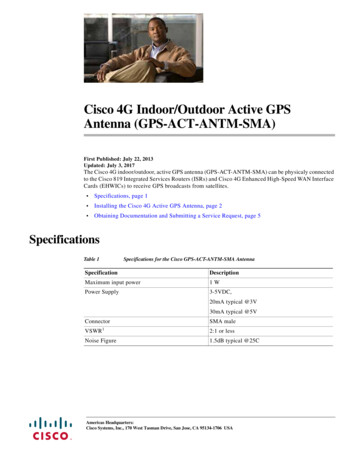
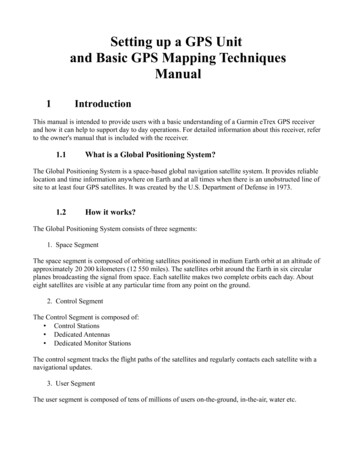
Note: For some instruments, this shortcut will not show up. Users can add it by pressing the Shift Measure (4)key, the More, and then by holding the Coverage Mapping soft key for at least 3 seconds.Figure 2: SPA Coverage MappingSetting ParametersBefore you begin Coverage Mapping, the parameters should be adjusted appropriately. In order to doso, first access the coverage mapping menu. Once there, select Measurement Setup and then to editthe measurement settings, touch the RSSI button. The threshold RSSI values provide the user with easyvisibility of the power level.Better than ExcellentBetween Excellent and Very GoodBetween Very Good and GoodBetween Good and PoorWorse than PoorFigure 3: RSSIThe thresholds for the dBm values can be altered so the measurement indications on the map are coloredappropriately for the expected signal levels.3
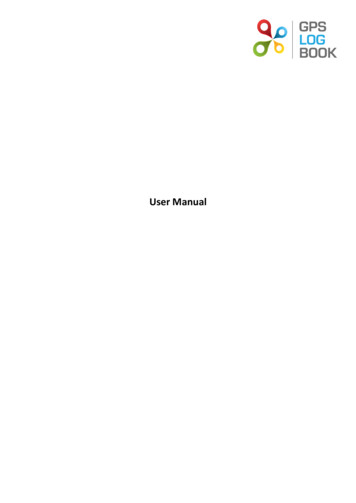
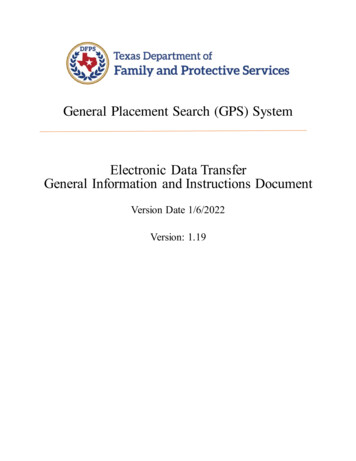
Data CollectionAnother setting that can be personalized is the way the data is recorded. In the coverage mapping menu,select Point Distance/Time Setup. Once there, you can set the way it records data by either time or distance,and the intervals of which it collects the data. If the collection setting is set to time, the instrument will plota data point whenever the time set in Repeat Time is reached. If the distance option is set, the user receivesa data point whenever the allocated distance is attained.Figure 4: Data Collection SettingsTurning on GPSIn order to coverage map with GPS, Option 31 (GPS), is required. To turn the GPS on, press Shift System (8),and then the GPS soft key. In the GPS sub-menu, you can turn the GPS on or off, view GPS info, change theGPS Voltage, or reset the GPS.Figure 5: System MenuFigure 6: GPS Sub-MenuThe GPS sub-menu contains options essential for coverage mapping with GPS.4
GPS MappingTo begin Coverage Mapping, you first must open a MAP (.map) or AZM (.azm) file created using easyMapTools. Insert the USB flash drive containing the MAP or AZM file into the USB port of the instrument.From there, at the Coverage Mapping menu, touch Save/Recall Points/Map. In the Mapping Save/Recallsubmenu, touch Recall a Map. Find the file from the USB you inserted, and press Enter on the keypad. Themap should now appear on the screen. If not already done, the instrument will attempt to lock the GPSby tracking at least three satellites. Your location will then be set for you by the instrument relative to themap. Once that’s done, touch the Start Data Collection key to get started. The instrument will automaticallyupdate your location and record points as you move. Once all the needed points have been plotted, pressStop Data Collection to finish.Figure 7: Recalling a MapFrom the Coverage Mapping menu, select Save/Recall Points/Map and in the next menu, Recall a Map.Figure 8: Selecting MAP fileSelect the MAP (.map) or AZM (.azm) file from the USB and press Enter on the keypad.5
Figure 7: Recalling a MapWith the map on the screen, the instrument automatically pinpoints your location relative to the map.Figure 8: Selecting MAP fileWhen you press Start Data Collection, the instrument begins plotting the points. Once you are finishedmapping, press Stop Data Collection to finish.6
Saving the Data CollectedOnce Data Collection is complete, the data points can be saved as a KML file, a tab delimited text file (.mtd),and/or a JPEG. When it is saved as a KML file, the data points can be later recalled by the instrument to beused once again, and when coverage mapped with the GPS option, the file can also be opened by GoogleEarth. For viewing the data collected however, it is recommended that the data be saved as a tab delimitedfile (.mtd). A tab delimited file can be opened with notepad or Excel for easy viewing and report generation.To begin, access the Mapping Save/Recall submenu from the Coverage Mapping Menu. From there, touchSave KML Points, Save Tab Delimited Points, or Save JPG. A pop-up save prompt comes up, where thefilename and file type can be changed. Once finished, press enter on the keypad or touch screen to save.The file can then be copied to the USB, transferred and opened.Figure 11: Saving Data PointsAccess the Mapping Save/Recall submenu from the Coverage Mapping Menu.Figure 12: Saving the FileChange the needed fields, and press Enter in order to save the file.7
Analyzing the DataWhen saved as a tab delimited file (.mtd), the points recorded by the instrument can later be opened by aprogram such as Excel, to be viewed and analyzed.Once opened, looking at the file from top to bottom, the first things you see are the rows 1-16. It has basicinformation, such as the file mode, model, serial number, and date the mapping was done. The actual databelow is divided into columns. Columns A-F is only relevant when coverage mapping with GPS, but thecolumns G-AE pertain to both coverage mapping methods.Column A- the point numberColumn B- the status of the GPSColumn C- the longitudeColumn D- the latitudeColumn E- the UTC dateColumn F- the UTC timeColumn G- the system dateColumn H- the system timeColumn I- the mode the instrument was inColumn J- what type of data was collectedColumn K- the values recorded by the instrumentColumns L-AE corresponds to the setup of the instrument. The way that the setup is organized, columns N,P, R, and T have the actual setting values, and the preceding columns indicate the user of what exactly thefollowing values mean.Column N- the frequencyColumn P- the RBW settingColumn R- the VBW settingColumn T- the detection typeThe columns U-AC shows the threshold values designated by the user earlier. You can look at the valueplaced in column K and refer to columns U-AC to determine the strength of the RF power measurement. Atthe very end, in the column AE, errors, if any, are listed. There are three possible values: ADC over range;saturation; and none.8
The colors shown by the instrument provide easy viewing for the user when determining signal strength,but by viewing the file as a tab delimited file, the actual raw data can be seen.Figure 13: Viewing the DataThe data can then be opened by other software programs for analysis and report generation.9
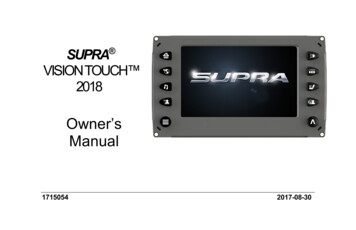
Google Earth Figure 14: Google EarthWith Google Earth, you can open a saved KML file transferred from the device to you computer. Simplydouble-click the KML file and Google Earth will run and show the points in a Digital Orthophoto Quadrangle(DOQ) format. You can click on the points to see both the colors for easy analyzing, as well as the morespecific values given by a tab delimited file.To install Google Earth, go to the web site: http://earth.google.com/. Download the program and theninstall it to your computer. Additional help may be found through the Help pull-down menu.ConclusionMost wireless communications systems are designed to provide coverage over a predetermined area andnot interfere with distant systems using the same frequencies. Coverage estimation software must makeassumptions about loss due to terrain, buildings and other factors. If the assumptions are not accurate,the actual coverage of a system will differ from the design. Mapping the coverage with a precision receiverprovides the ultimate proof and can help separate interference issues from signal strength problems.The Anritsu E-Series Spectrum Master , Cell Master , LMR Master , and Site Master models arepowerful battery operated instruments that can support a wide range of signal types. With the addition ofOption 431, and the power of GPS (Option 31), Coverage Mapping users can easily make signal strengthmeasurements and create detailed maps and reports of system coverage.10
United StatesAnritsu Company1155 East Collins Boulevard, Suite 100,Richardson, TX, 75081 U.S.A.Toll Free: 1-800-267-4878Phone: 1-972-644-1777Fax: 1-972-671-1877 CanadaAnritsu Electronics Ltd.Kistagången 20B, 164 40 KISTA, SwedenPhone: 46-8-534-707-00Fax: 46-8-534-707-30 FinlandAnritsu ABTeknobulevardi 3-5, FI-01530 VANTAA, FinlandPhone: 358-20-741-8100Fax: 358-20-741-8111700 Silver Seven Road, Suite 120,Kanata, Ontario K2V 1C3, CanadaPhone: 1-613-591-2003Fax: 1-613-591-1006 DenmarkAnritsu A/S BrazilAnritsu Electrônica Ltda.Praça Amadeu Amaral, 27 - 1 Andar01327-010 - Bela Vista - São Paulo - SP - BrazilPhone: 55-11-3283-2511Fax: 55-11-3288-6940 MexicoAnritsu Company, S.A. de C.V.Av. Ejército Nacional No. 579 Piso 9, Col. Granada11520 México, D.F., MéxicoPhone: 52-55-1101-2370Fax: 52-55-5254-3147 United KingdomAnritsu EMEA Ltd.200 Capability Green, Luton, Bedfordshire LU1 3LU, U.K.Phone: 44-1582-433280Fax: 44-1582-731303 FranceAnritsu S.A.12 avenue du Québec, Batiment Iris 1-Silic 612,91140 Villebon-sur-Yvette, FrancePhone: 33-1-60-92-15-50Fax: 33-1-64-46-10-65 GermanyAnritsu GmbHNemetschek Haus, Konrad-Zuse-Platz 181829 München, GermanyPhone: 49-89-442308-0Fax: 49-89-442308-55 ItalyAnritsu S.r.l. SwedenAnritsu ABKay Fiskers Plads 9, 2300 Copenhagen S, DenmarkPhone: 45-7211-2200Fax: 45-7211-2210 RussiaAnritsu EMEA Ltd.Representation Office in RussiaTverskaya str. 16/2, bld. 1, 7th floor.Moscow, 125009, RussiaPhone: 7-495-363-1694Fax: 7-495-935-8962 SpainAnritsu EMEA Ltd.Representation Office in SpainEdificio Cuzco IV, Po. de la Castellana, 141, Pta. 828046, Madrid, SpainPhone: 34-915-726-761Fax: 34-915-726-621 United Arab EmiratesAnritsu EMEA Ltd.Dubai Liaison OfficeP O Box 500413 - Dubai Internet CityAl Thuraya Building, Tower 1, Suite 701, 7th floorDubai, United Arab EmiratesPhone: 971-4-3670352Fax: 971-4-3688460 IndiaAnritsu India Pvt Ltd.2nd & 3rd Floor, #837/1, Binnamangla 1st Stage,Indiranagar, 100ft Road, Bangalore - 560038, IndiaPhone: 91-80-4058-1300Fax: 91-80-4058-1301 SingaporeAnritsu Pte. Ltd.11 Chang Charn Road, #04-01, Shriro HouseSingapore 159640Phone: 65-6282-2400Fax: 65-6282-2533 P. R. China (Shanghai)Anritsu (China) Co., Ltd.27th Floor, Tower A,New Caohejing International Business CenterNo. 391 Gui Ping Road Shanghai, Xu Hui Di District,Shanghai 200233, P.R. ChinaPhone: 86-21-6237-0898Fax: 86-21-6237-0899 P. R. China (Hong Kong)Anritsu Company Ltd.Unit 1006-7, 10/F., Greenfield Tower, Concordia Plaza,No. 1 Science Museum Road, Tsim Sha Tsui East,Kowloon, Hong Kong, P. R. ChinaPhone: 852-2301-4980Fax: 852-2301-3545 JapanAnritsu Corporation8-5, Tamura-cho, Atsugi-shi,Kanagawa, 243-0016 JapanPhone: 81-46-296-1221Fax: 81-46-296-1238 KoreaAnritsu Corporation, Ltd.5FL, 235 Pangyoyeok-ro, Bundang-gu, Seongnam-si,Gyeonggi-do, 463-400 KoreaPhone: 82-31-696-7750Fax: 82-31-696-7751 AustraliaAnritsu Pty Ltd.Unit 21/270 Ferntree Gully Road,Notting Hill, Victoria 3168, AustraliaPhone: 61-3-9558-8177Fax: 61-3-9558-8255 TaiwanAnritsu Company Inc.7F, No. 316, Sec. 1, Neihu Rd., Taipei 114, TaiwanPhone: 886-2-8751-1816Fax: 886-2-8751-1817Via Elio Vittorini 129, 00144 Roma ItalyPhone: 39-06-509-9711Fax: 39-06-502-2425 Anritsu All trademarks are registered trademarks oftheir respective companies. Data subject to changewithout notice. For the most recent specificationsvisit: www.anritsu.com11410-00581, Rev. B Printed in United States 2015-08 2015 Anritsu Company. All Rights Reserved.
In order to coverage map with GPS, Option 31 (GPS), is required. To turn the GPS on, press Shift System (8), and then the GPS soft key. In the GPS sub-menu, you can turn the GPS on or off, view GPS info, change the GPS Voltage, or reset the GPS. The GPS sub-menu contains options essential for coverage mapping with GPS.