Transcription
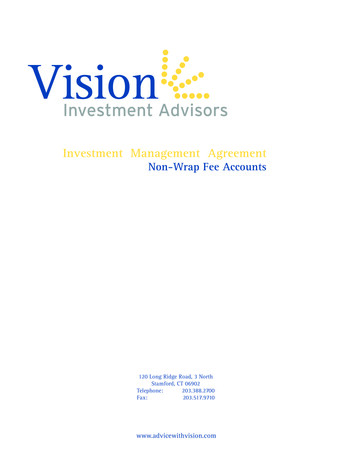
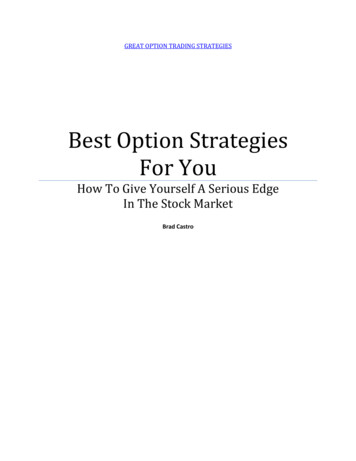
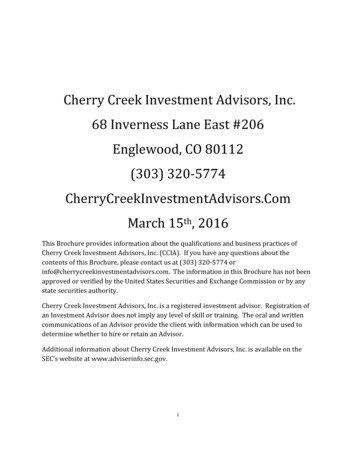
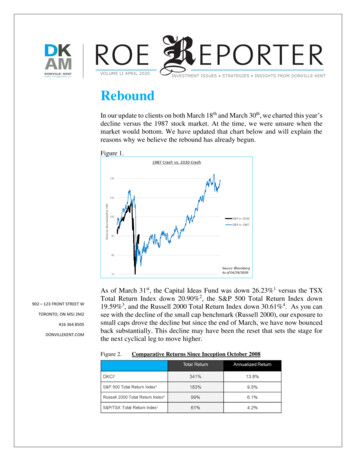
VOLUME LI APRIL 2020INVESTMENT ISSUES STRATEGIES INSIGHTS FROM DONVILLE KENTReboundIn our update to clients on both March 18th and March 30th, we charted this year’sdecline versus the 1987 stock market. At the time, we were unsure when themarket would bottom. We have updated that chart below and will explain thereasons why we believe the rebound has already begun.Figure 1.As of March 31st, the Capital Ideas Fund was down 26.23%1 versus the TSXTotal Return Index down 20.90%2, the S&P 500 Total Return Index down19.59%3, and the Russell 2000 Total Return Index down 30.61%4. As you cansee with the decline of the small cap benchmark (Russell 2000), our exposure tosmall caps drove the decline but since the end of March, we have now bouncedback substantially. This decline may have been the reset that sets the stage forthe next cyclical leg to move higher.Figure 2.Comparative Returns Since Inception October 2008
Over the HorizonThe most common and fair question we are getting right now is how can we bepositive about investing in stocks considering the uncertainty currently in theworld. No one is feeling the pain more than small businesses and those that havebeen laid off. However, the stock market is not a reflection of the economy wesee out the window or on the news. The stock market is a prediction of what theeconomy is going to be in the future.The idea that the economy is not the stock market is very important. The realeconomy lags the financial economy. The stock market is forward looking andinvestors get paid for taking risk. By waiting for certainty, or as one approachescertainty, the rewards diminish. Today, if one were to wait for a vaccine againstCOVID-19 or wait for the economy to return to “normal,” much of the returnwill have already been rewarded to those who were willing to invest earlier on.The stock market is an expectation of the economy 6-12 months from now.In studying past downturns, it becomes very apparent that maximum pessimismin the stock market bottoms well in advance of maximum pain in the economy.Entering 2009, the economic outlook was dismal — GDP growth was negative,jobless claims were hitting multi-decade highs, and the stock market was downmore than 45% from its peak. Again, the destruction and disarray were front andcenter, and an investor would have had a myriad of reasons for not wanting torisk putting money into that environment. The point is, at the beginning of 2009if an investor had waited for an economic “green light,” like waiting for theeconomy (GDP) to stop declining, they would have had to wait another 13months before seeing that trend start in January 2010. Over this time, the TSXIndex was up more than 31% (S&P 500 29%).The quote below is from our January 2009 newsletter.“A rebound in markets and asset prices generally will typically be driven bytwo factors and these are 1) improving levels of market confidence and 2) arebound in forward earnings. Our expectation is that a rebound in confidencewill come first and the rebound on the earnings front will only be apparent wellafter the market has begun to rebound.”In the same newsletter from 11 years ago, we quoted Randall Gilberd ofRockridge Partners in Palm Springs, California. Gilberd wrote in his January 9th,2009 letter to investors, “We don’t require economic nirvana to recordsubstantial gains from here.”ROE REPORTER DKAM2
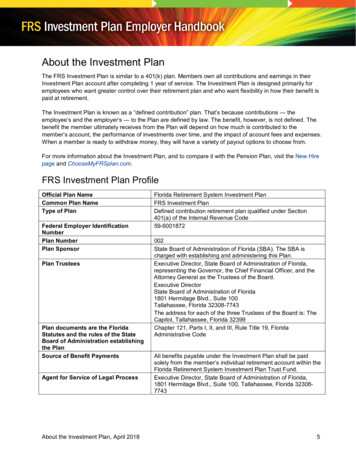
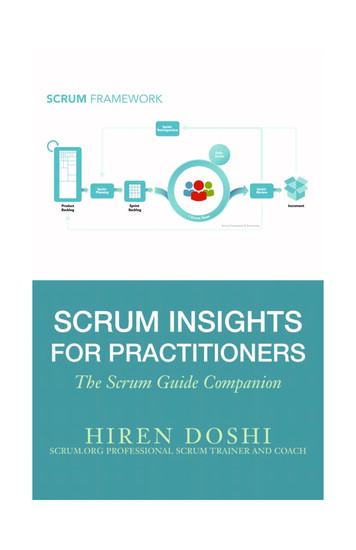
History has shown that big gains follow Figure 3.dramatic declines (figure 3). Our fund’sPast S&P 500 Bear Marketshistorical best return was in 2009. We are Date of Market Market Returnseeing similar opportunities in the smallBottomNext 12 Monthscap technology space right now.Marathon Not a SprintMarch 2009October 2002December 1987August 1982October 1974May 1970June 1962June 1949June 193269%34%23%58%38%44%33%42%121%We do not believe that buying and sellingstocks based on a short term outlook oraccording to the latest headlines translatesinto a long term winning strategy. Shortterm trading not only relies too much onSource: Bloombergemotion, it also does not appropriatelyweigh the short term versus the long term when it comes to value creation. Timeand time again we see investors place too much emphasis on the current year oreven the current quarter results. Instrumental valuation tools, by contrast,appropriately balance the short term versus the long term.By using a theoretical example with the associated financial math, we think ourpoint will be made clearer and you will understand how we can be positive onstocks in this environment even though values have declined in the short term.We believe the current value of a business is based on the future economic valuethat the business will create. A Discounted Cash Flow analysis (DCF), is afinancial tool used to present value the future cash flows of a business. Picturean independent car dealership that has been operating a single location for adecade. Say this shop has been making 1,000,000 per year in cash flow. Theyhave a great location and loyal customers and under normal circumstances youwould expect this trend to continue. Due to COVID-19, their revenue drops tozero and their cash flow declines to negative 250k in 2020. This business runsresponsibly, carries zero debt, and plans to fully re-open in 2021. Using adiscounted cash flow analysis under this scenario, how much value has theCOVID-19 pandemic taken from this car dealership? Doing the math, you findthat a full one-year shutdown lowers their value by just over 6%5.Obviously, what is happening in the real world right now is not as clean andcrisp as this. Real results will range over a vast spectrum. On one end of thespectrum you will have bankruptcies, and on the other, the strong companieswill grow and gain market share. The point is that the stock market can beemotional and what we saw in March was that people would rather sell now andask questions later. If the car dealership were a public company, their stockprobably would have sold off more than 30% in March, just like many small capstocks.ROE REPORTER DKAM3
This is why we think there are good opportunities in this bifurcated market.There are stocks that are currently down 50-70% from their highs, where theunderlying value of the business is only down slightly. If you are confident abusiness will survive, then a one-year downturn is not as punitive to a company’svalue as one would assume. The divergence of the weak from the strong has notbeen this apparent in a long time, if ever.Recovery May be Quicker Than You Would ThinkThe 2009 stock market recession is still front and center in the minds of manyinvestors. In recent years, any mention of a forthcoming recession would elicitfeelings from one of the worst economic periods in almost 100 years. In additionto the disconnect we are seeing in individual company valuations, as explainedabove, there are three other factors that distinguish this recession from pastlonger lasting recessions like 2009.Pace of the Decline - In 2008/2009, it took the market 363 days to go down 35%.This year it took 33 days — the fastest in history. The pace of the decline isimportant because it got more people’s attention and motivated them to act morequickly. The speed of the drop this time panicked investors faster, droppedconsumer confidence faster, and made governments respond even faster.Timing of Government Intervention - In 2008/2009, the Fed waited 6 monthsafter the crash of 2009 to pull out the “bazooka” and provide liquidity that wouldfill in the holes of the economy. This time around, the Fed began to stimulatetwo weeks after the decline began and pulled out the “bazooka” on March 23,with an additional 2.3 trillion in stimulus announced on April 9. They havepledged unlimited quantitative easing in order to backstop nearly every aspectof the credit market.Scale of the Stimulus - The scale of government intervention is on track to befive times larger than any past program in history.The benefits of stimulus are temporary, and the long term unintendedconsequences are unknown. The short term impact however can be extremelyeffective. The 2008/2009 recession was so painful because as economic activitybegan to decline, business owners went to the banks with open hands asking forhelp. However, banks were at the epicenter of that recession and were worriedabout keeping the lights on themselves. The banks threw up their own as theythemselves had bigger issues to deal with. If a business or household had anytype of credit issue, they were bankrupt. Pair this with the government waiting6 months before stepping in, and a lot of irrevocable damage had already beendone.ROE REPORTER DKAM4
Today, governments have reacted almost immediately, providing “unlimited”liquidity. The banks have been waiving covenants, deferring payments, andproviding emergency loans. The goal of financial stimulus is not to solve theproblem but rather to keep the economic shock from turning into a full blownfinancial crisis that interrupts the flow of credit to businesses and households.On October 20, 1987, the day after Black Monday, Fed Chairman AlanGreenspan said “The Federal Reserve [ ] affirmed today its readiness to serveas a source of liquidity to support the economic and financial system.” Soundsfamiliar. In addition, the Fed encouraged banks to continue to lend on their usualterms. This quick response helped lead to a quick rebound.We feel like many are succumbing to recency bias and extrapolating the2008/2009 recession against the current environment. A financial crisis like in2008/2009 is very different compared to the health crisis today. The greatfinancial crisis produced long-lasting damage to the financial system. At thetime, people were scared to have their money in the bank, or in any asset for thatmatter, for the perceived risk of a complete meltdown. The COVID-19 crisis isa health pandemic with a full recovery dependent on some combination ofeffective drugs, a vaccine, and herd immunity. Now, like in 1987, the banks arebeing encouraged to keep companies afloat. The financial economy will surviveand many of the surviving companies we invest in will flourish.Panning for GoldSo how are we positioning the portfolio?1. Shift to small caps — high quality small caps will beat large caps during therebound2. Invest in Technology — this has been validated in the downturn and we expectthis sector’s relative strength to continue3. Stay invested —one can’t successfully trade in and out of the market4. Avoid the truly long shots — hotels, oil producers, cruise ships etc.We think quality stocks, or “compounders” — those with strong balance sheets,growth, and high margins — can go markedly higher from here. Companies thatcannot survive a temporary slow down because they carry too much debt, aretoo low margin (high operating costs), or will lose too much revenue, may notsurvive.The divergence between the strong and weak is most evident when you comparetechnology stocks to the rest of the market. Technology, and softwarespecifically, allows businesses to increase efficiencies and scale their operations.Now more than ever, businesses will need to enable employees to workROE REPORTER DKAM5
remotely, move their business to the cloud, and focus on their online salescapabilities. A majority of the fund is invested in tech stocks and we think weare in the middle of technological shift that will see software companies take onan even greater share of the economy over the next decade. There is norecession in innovation.What we are doing is taking apart each company piece by piece to see whichones are the best investments from this point on. We are focused on strongbalance sheets, low fixed costs, the ability to remain profitable throughout thisrecession, and the potential to gain market share due to weak competitors.Enghouse is run by one of the best management teams in Canada, has over 110m of cash, and offers a secure teleconference business that is used byhospitals (telehealth) and financial institutions, as well as other communicationsoftware services.Adcore has been around for over 15 years, 14% of their market cap is in cashwith no debt, and it offers software that enables small and medium sizedbusinesses to track the performance of their ad spending online.VitalHub offers software to medical facilities in order to increase safety andefficiencies like tracking hospital bed usage, and now has over 70% recurringrevenue. They have a proven management team and are sitting on 30% of theirmarket cap in cash.Tucows is a utility company for the 21st century, enabling people and businessesto access the fastest internet, create websites, and have access to mobile plans ata fair price.Sangoma has a new management team that has transformed the business froma hardware business to a software as a service business. Their products areessential in a tech-enabled workforce and they recently launched their newestcloud service — Video Meetings.Final ThoughtsIt is the stocks you buy in the worst of times that lead to great returns in thebest of times.Being able to capitalize on market dislocations after a crash has led us to someof our best investment opportunities. As a result of the crash in 2008/2009,Carfinco Financial dropped to 0.24, Paladin Labs dropped to 9.00, andConstellation Software went down to 22.50. If you were basing yourinvestment decision on 2009 earnings, none of these stocks would look likescreaming buys. Carfinco got acquired for 11.25 five years later, over the nextROE REPORTER DKAM6
four years Paladin’s stock climbed above 142.00, and Constellation now tradesat 1,356.126.This is the type of dislocation we are seeing with some high quality stocks rightnow, especially in the small cap technology space. This is why we see greatopportunity in the current market landscape.We would like to thank you, our clients, for continuing to believe in the process.We hope this newsletter, aimed at answering the most common questions wehave received, was helpful. We absolutely understand your concerns and worriesabout the markets this past quarter, but we want to reassure you that this tooshall pass, and we believe we are well positioned to capitalize on the upside. Asalways, please feel free to reach out with any comments or questions.J.P. Donville&Jesse Gambleinfo@donvillekent.comROE REPORTER DKAM7
All estimates, projections, and calculations have been generated by DKAM. This does not constitute advice for personalinvestments but rather a breakdown of how Donville Kent approaches stock analysis.123456Time weighted rates of return for Class A Series 1, net of all fees and expenses as of March 31st, 2020.S&P TSX Composite Total Return Index is the Net Total Return version of the S&P/TSX Composite Index.S&P 500 Total Return Index is the Net Total Return version of the S&P 500 Index.Russell 2000 Total Return Index is the Net Total Return version of the Russell 2000.DKAM calculation using 5.12% WACC and terminal value calculated after year 5.Price as of 04/29/2020.DISCLAIMERReaders are advised that the material herein should be used solely for informational purposes. Donville Kent AssetManagement Inc. (DKAM) does not purport to tell or suggest which investment securities members or readers shouldbuy or sell for themselves. Readers should always conduct their own research and due diligence and obtainprofessional advice before making any investment decision. DKAM will not be liable for any loss or damage causedby a reader's reliance on information obtained in any of our newsletters, presentations, special reports, emailcorrespondence, or on our website. Our readers are solely responsible for their own investment decisions.The information contained herein does not constitute a representation by the publisher or a solicitation for thepurchase or sale of securities. Our opinions and analyses are based on sources believed to be reliable and are writtenin good faith, but no representation or warranty, expressed or implied, is made as to their accuracy or completeness.All information contained in our newsletters, presentations or on our website should be independently verified withthe companies mentioned. The editor and publisher are not responsible for errors or omissions. Past performancedoes not guarantee future results. Unit value and investment returns will fluctuate and there is no assurance that afund can maintain a specific net asset value. The fund is available to investors eligible to invest under a prospectusexemption, such as accredited investors. Prospective investors should rely solely on the Fund's offeringdocumentation, which outlines the risk factors in making a decision to invest.The S&P/TSX Composite Total Return Index, the S&P 500 Total Return Index, and the Russell 2000 Total ReturnIndex ("the indexes") are similar to the DKAM Capital Ideas Fund LP ("the fund") in that all include publicly tradedNorth American equities of various market capitalizations across several industries, and reflect both movements inthe stock prices as well as reinvestment of dividend income. However, there are several differences between the fundand the indexes, as the fund can invest both long and short, can utilize leverage, can take concentrated positions insingle equities, and may invest in companies that have smaller market capitalizations than those that are included inthe indexes. In addition, the indexes do not include any fees or expenses whereas the fund data presented is net ofall fees and expenses. The source of the indexes' data is Bloomberg.DKAM receives no compensation of any kind from any companies that are mentioned in our newsletters or on ourwebsite. Any opinions expressed are subject to change without notice. The DKAM Capital Ideas Fund, employees,writers, and other related parties may hold positions in the securities that are discussed in our newsletters,presentations or on our website.ROE REPORTER DKAM8
"A rebound in markets and asset prices generally will typically be driven by two factors and these are 1) improving levels of market confidence and 2) a rebound in forward earnings. Our expectation is that a rebound in confidence will come first and the rebound on the earnings front will only be apparent well after the market has begun to .