Transcription
The Economic Contribution of theSouth African Blueberry IndustryJuly 2019www.saberries.co.za www.elsenburg.com1
This report was compiled by the Division for Macro & Resource Economics of theWestern Cape Department of Agriculture in collaboration with the South AfricanBerry Producers’ Association (SABPA)Contributors: Louw Pienaar; Mzwanele Lingani; Philip SwartTable of ContentList of Tables . 21. Introduction . 42. The South Africa Blueberry Industry . 43. Economic Contribution of the Industry . 6Production . 6Employment . 9Exports . 13Market Access . 15Value-Chain Linkages. 16Investment . 184. Conclusion & Recommendations . 19Bibliography. 20List of FiguresFigure 1: Comparison of growth and jobs in crop industries . 6Figure 2: South African blueberry production . 7Figure 3: Gross margin for a hectare of blueberry production . 8Figure 4: Employment estimates for blueberries, 2008 to 2018. 10Figure 5: Labour cost comparison per hectare of fruit in 2018 . 11Figure 6: Percentage of total exports throughout a year . 12Figure 7: South African blueberry exports to the world in volumes and value . 13Figure 8: South African blueberry export destinations by value . 14Figure 9: Blueberry net exporting by value, 2007-2018. 15Figure 10: Value chain map of the blueberry industry in South African . 17List of TablesTable 1: Sensitivity analysis of blueberry gross margin per hectare . 9Table 2: Wage comparison of farmworkers for 2017 . 10Table 3: Tariff margins faced by leading blueberry exporters . 16Table 4: Capital investment needed for greenfield investment per hectare . 182
EXECUTIVE SUMMARYThe South African blueberry industry is one of the fastest growing horticulturalindustries in South Africa, both in terms of hectares planted and gross value ofproduction. In line with several policy documents that suggest that high-value,labour-intensive and exported crops should be targeted for growth, this industry isparticularly well-positioned to drive inclusive development and has created morethan 4 000 jobs in the past five years. In this report, the economic contribution of theblueberry industry was estimated and shows that for every hectare underproduction, blueberry growers employs an average of 2.64 workers on farms, whilstanother 0.22 jobs per hectare is created for those packing the fruits and thosesupervising or managing teams. In terms of generating export earnings, the industryhas managed to grow its export base from 634 tons in 2008 to more than 8 000 tonsin 2018. In value terms, this translates into exports to the world growing from R133million in 2013 to R1.058 billion in 2018; an annual growth rate of 51% in this period.Blueberries are not only very profitable from an investment point of view, but it alsocontributes to the economy through its linkages with upstream and downstreamindustries. In 2018, inputs used by the industry was valued at R570 million, whilst directinvestment in newly established orchards in the past year adding another R421million in the form of direct investment. With an increasing world demand for this“super fruit” which is high in anti-oxidants, the growth of South Africa’s berry industryis set to also boost job creation and growth for input sectors.Since around 70% of all blueberries grown in South Africa get exported, the industry’sfuture growth is dependent on having access to markets, in particular China andSouth Korea. Despite the limited access to these two markets compared to theindustry’s major Southern Hemisphere competitors such as Peru and Chile, the SouthAfrican blueberry industry has managed to diversify its export market basket ofcountries with increases in the number of destinations over time, whilst a smallershare of the total exports have gone to the United Kingdom, whilst still growing inabsolute terms. The findings in this report suggest that the berry industry, andparticularly blueberries as the leader, should be prioritised for market access tofurther extend its economic and socio-economic contribution to the South Africaneconomy.3
1. IntroductionThe South African blueberry industry is one of the fastest growing agriculturalindustries in the country, creating economic opportunities and jobs. This report setsout to quantify the economic and socio-economic contribution of South Africa’sberry industry, with specific emphasis on blueberries. In recent years, various studieshave highlighted the opportunities that exist for this industry to expand production,create new jobs and investment, and to increase export revenue in support of theeconomy (Troskie, 2014; FAS-USDA, 2017; Pienaar, 2018). The National DevelopmentPlan (NDP), alongside several other policy plans, has earmarked the agriculturalsector to drive development, based on a strategy to expand high-value, labourintensive, export-focussed crops (NGP, 2011; NPC, 2011; IGDP, 2012; APAP, 2015).Understanding the blueberry industry’s potential contribution to this mandaterequires a clear and detailed analysis of its overall economic contribution. Currentstatistics from the National Department of Agriculture’s production accounts doesnot accurately reflect current industry trends, the structure of the industry nor havestatistics that characterise this industry and its contribution towards development.This report then sets out to quantify the overall contribution of the blueberry industrytowards South Africa’s economy. This is done by analysing the current performancewith regards to production, employment, exports, value chain linkages andinvestment. Once this is assessed, the overall economic impact of the blueberryindustry is given to provide agricultural stakeholders, potential investors and policymakers with the necessary information to support future decision making. This comesat a time when the country is in desperate need of economic growth and jobcreation to stimulate development, especially in rural areas.The information that follows in this report is based on various sources available fromthe South African Berry Producers’ Association (SABPA), as well as some additionalsecondary sources. However, the bulk of the analysis provided here is informed bysemi-structured interviews conducted between January and March 2019. Theresearch team visited a number of farms to collect detailed accounts of production,employment and marketing, alongside interviews with agribusinesses participating inthe market value chain. Finally, some key challenges faced by the industry will alsobe discussed, of which market access and chemical registrations are at the top ofthe list. This is followed by some concluding remarks.2. The South Africa Blueberry IndustryWithin the family of different berries grown in South Africa, blueberry production isthe biggest by a significant margin, taking up around 74% of the total area plantedunder berries. With blueberries being rich in antioxidants and thus marketed as a4
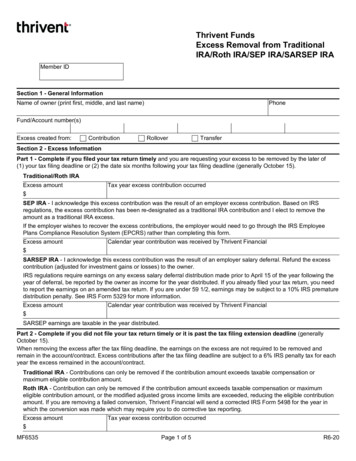
“super fruit”, these soft-skinned fruits are becoming increasingly popular and worlddemand in the form of global imports is growing at around 12% per annum since2013 (ITC, 2019). The health benefits associated with blueberries and its increaseduse in processed food products such as juices and deserts as well as in the bakingindustry are driving increased consumption of South African blueberries both localand abroad.The South African blueberry industry started in Mpumalanga’s Lydenburg districtduring the 1970’s, and by 1987 blueberry cultivation reached the Western Cape. Thefirst recorded batch of blueberries exported from South Africa was in 1992 which wasvalued at R9 780 and shipped to Zambia. By 2001 this value reached R5 million, andin the past year, blueberry exports moved past the one billion Rand mark for the firsttime (Quantec, 2019). New orchards are still being established across the country,especially in regions where early-season frost damage is unlikely. Profitability in theexport driven South African blueberry industry is dependent on early spring harvests,the introduction of new cultivars and expertise are driving productivity andcompetitiveness.Blueberry production, measured in Rand value terms, made up around 1.5% of thetotal value of horticultural production in South Africa in 2018 (DAFF, 2018). Though arelatively small industry, its contribution to economic growth and job creation in thepast decade has been unlike any other agricultural industry. To put this inperspective, Figure 1 reveals multiple attributes amongst the leading horticulturalcrops grown in the country with regards to their relative size in gross value ofproduction (size of the bubble), their five year annual growth in value from 2013 to2018 (y-axis) and the employment potential in the form of the amount of jobsneeded per hectare planted (x-axis).Starting with employment, each hectare of blueberries planted results in the directemployment of 2.64 fulltime equivalent workers, on average. This is the highestemployment intensity amongst the major fruits grown in South Africa. As expected,other industries with high employment potential were table grapes (2.2), flowers (2.1)and cherries (1.9), whilst pome (apples & pears) and stone fruit (apricots, plums,prunes, peaches & nectarines) created 1.1 jobs per hectare planted. At the lowerend of the spectrum, crops such as nuts, sub-tropical fruit and citrus haveemployment multipliers of around 0.5. Wine grapes had the lowest employmentmultiplier, only adding 0.4 jobs per hectare since around 58% of all these grapes aremechanically harvested (Vinpro, 2019).In terms of economic growth, the blueberry industry has significantly outperformedother fruit industries by growing its gross value of production from an estimated valueof R15.8 million in 2008 to R1.25 billion in 2018 (WCDoA, 2019). This growth, and inparticular that of the past four years, has seen the industry’s value double every5
season as many of the newly established orchards are coming into production.Other good performers over the same period were table grapes and nuts,expanding in value by 24% and 21% respectively per annum. Pome and stone fruithad moderate growth over this period with 6% per annum, whilst the wine grapeindustry came under severe pressure lately with annual growth of 0.8% (DAFF, 2018).5-year Annual Growth in Value e GrapesCitrusStonefruitCherries550.00Wine Farm-level Employment per hectareFigure 1: Comparison of growth and jobs in crop industriesSource: Own Compilation from DAFF, 2018; FruitSA, 2019, WCDoA, 2019Finally, the size of the bubbles indicates that citrus, table grapes and pome fruit werethe biggest industries in value terms in 2018. These industries remain importantcontributors to the agricultural economy. The next section will provide the details ofthe main drivers behind the growth in the blueberry industry and the contribution tothe economy.3. Economic Contribution of the IndustryProductionBlueberry production is particularly labour and capital intensive. South Africa is wellpositioned to supply fresh blueberries to the market during the counter season oftraditional blueberry producing countries situated in the Northern Hemisphere. Thelocal harvesting season generally starts from mid-September with peak exportsoccurring from October through to November. Blueberries belongs to the6
Vacciniaceae specie of which three dominate the commercial productionlandscape namely rabbiteye, northern and southern highbush (Swart, 2015). In SouthAfrica varieties originating from North America have been introduced successfully,with a number of other coming from other regions such as Australia and NewZealand established in recent years.To get a sense of how quickly blueberry production has increased in South Africa,Figure 2 shows the most recent information provided by the SABPA (2019). Theindustry had around 2 000 established hectares across various provinces in 2018which delivered an estimated crop of 11 306 tons. It should be noted that asignificant proportion of these orchards are set to come into production in the nexttwo to three years and new hectares are still being established. The Western Capehas the largest share of blueberry hectares with 60%, followed by Limpopo (15%),North West (10%) and Gauteng (8%).In Figure, the production of blueberries harvested since 2013 is also further brokendown into the various market segments. On average, around 70% of all blueberriesare destined for exports markets, whilst 13% goes to the local fresh market.Processing of berries for various uses such as Individually Quick Frozen (IQF), juices &juice concentrates, dairy and confectionary make up another 17% (FAS-USDA,2017). Total production of blueberries in South Africa more than doubled from 2016,growing from around 4 100 tons to 11 306 tons. Export performance has shown asimilar trend.Figure 2: South African blueberry productionSource: Own Compilation from SABPA 2017; WCDoA 20197
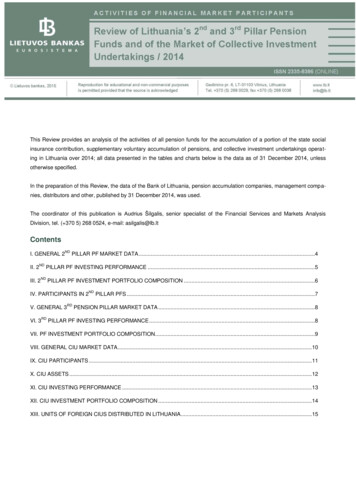
The majority of blueberry orchards are planted under shade netting structures (43%)or in the open air (40%), compared to the 17% that are under plastic cover. Thispercentage is set to change as there is a strong drive towards planting berries undernets and plastic cover in order to ensure high quality fresh products with improvedmanagement of water, pests and diseases and to protect orchards from sunburn,wind, hail and birds.Critical factors that influence productivity in blueberry cultivation include waterquality, climate, well-drained and semi-acidic soils. Many growers that do not haveaccess to these soils often plant their blueberries in bags or containers with substratemixes of any of the following materials: pine bark, sand, cocopeat (coir) and perlite.Farm-level profitability amongst blueberry growers vary considerably based oncultivar selection, management practices, selection of covering (plastic, shade-netor open-air), plant density and whether or not planted in the ground or in substrates.In general, the industry norm for yields are around 10 tons per hectare over the 8year production cycle of the orchard, although newer varieties are showing signs ofproducing higher yields earlier in the lifecycle of the plants.Figure 3 provides a gross margin analysis of a typical blueberry orchard planted insubstrate and under shade netting. Establishment in year 1 will incur costs of aroundR1.07 million, whilst the price was assumed to be fixed at R80 per kg at the farm2 000141 500121 000105008-6-5004-1 0002-1 5000Y1Y2Y3Y4CashflowY5IncomeY6Y7CostsY8Yield (Tons/ha)Value in Rand ('000)gate, delivered in bulk for further packing.Y9YieldFigure 3: Gross margin for a hectare of blueberry productionSource: Own Compilation from WCDoA 2019On average and throughout the 8-year cycle, one hectare of blueberries yieldedaround 10 tons annually which translates into a gross annual income of R800 000,8
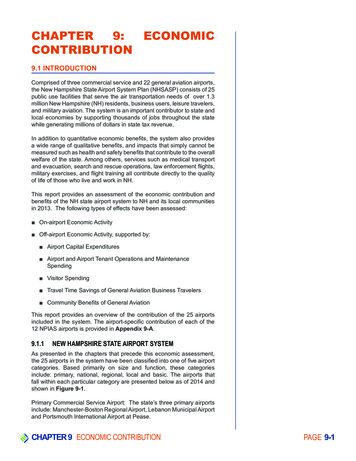
produced at a cost of R443 000 per hectare. The expected net annual income orgross margin is therefore R357 000 per hectare (WCDoA, 2019). Important to notefrom the analysis in Figure 3 is that provision still needs to be made for interest onfixed capital and other fixed costs that cannot be directly allocated to the specificorchard. Table 1 provides the sensitivity analysis of the same blueberry enterpriseand details how the gross margin changes with different price and yield scenarios.Blueberry profitability increases to around R837 000 per hectare if a yield of 16 tonsper hectare is realised. Those able to deliver a larger proportion of their crop for freshsales can also realise prices of around R88 per kg. In this case, the annual grossmargin for the average yield will be around R436 000 per hectare. Combining bothhigh prices and yields, top performing orchards have the potential to realiseR964 950 per hectare per annum. The breakeven yield is also indicated in Table 1and hovers between 5 to 6 tons per hectare, depending on prices. Overall cash flowturns net positive after 4 years, as was indicated in Figure 3.Table 1: Sensitivity analysis of blueberry gross margin per hectarePrice (R/Kg)Yield (Tons/ha)Less 10%Less 5%ActualAdd 5%Add 10%R72R 76R 80R 84R 886R-11 050R12 950R36 950R60 950R84 9508R132 950R164 950R196 950R228 950R260 95010R276 950R316 950R356 950R396 950R436 95012R420 950R468 950R516 950R564 950R612 95014R564 950R620 950R676 950R732 950R788 95016R708 950R772 950R836 950R900 950R964 950Breakeven Yield6.25.85.55.35.0Source: Own Compilation from WCDoA 2019EmploymentWith the exceptional growth of the industry, one of the main contributions, apartfrom creating income to agribusinesses is the impact employment and livelihoods.Combining the growth in hectares with the employment requirements associatedwith this growth, Figure 4 shows the estimated job creation for the industry over thepast decade. These employment numbers were carefully calculated based on theaverage amount of labour requirements on a typical blueberry enterprise, subdividing labour into various activities and measured in full-time equivalents over ayear of 220 working days.The strong increase in area planted and the volumes harvested have resulted in theindustry employing around 5 700 workers full-time in 2018. The number of workersemployed in the industry prior to 2014 was around 800 – 1000, which suggest that theindustry has created more than 4 000 jobs at farm level in the past five years. Eachhectare of blueberries under production equates to 1.02 permanent workers, 1.629
seasonal pickers, 0.09 workers in farm pack houses and 0.14 supervisors or productionmanagers (WCDoA, 2019).7 0006 0005 724Number of Jobs5 0004 6934 0003 0563 0001 9932 0001 0001 2691966683601 2781 igure 4: Employment estimates for blueberries, 2008 to 2018Source: Own Compilation from WCDoA 2019Based on the detailed information on labour requirements, Table 2 sets out tocompare average hourly wage rates of farmworkers employed on blueberry farms.These rates are also compared to the average amongst South Africa’s farmworkersmore broadly and horticultural farmworkers more specifically (StatsSA, 2017).According to the farmworker minimum wage determination as set out by theMinister of Labour each year, farmworkers’ minimum hourly wage was set at R15.39from 1 March 2017 to 29 April 2018 (DoL, 2018). In general, the farming sector hasbeen adjusting to the sharp labour cost inflation with the average for the entiresector marginally below this rate with R14.99 per hour.Table 2: Wage comparison of farmworkers for 2017Average HourlyDifference fromWage (R/hour)Minimum Wage (%)Minimum Wage: FarmworkersR 15.39-South African Farmworkers allR 14.99-2.62South African Horticultural FarmworkersR 15.07-2.10Blueberry Farms: SeasonalR 17.5113.78Blueberry Farms: PermanentR 19.4626.45Blueberry Farms: Team leadersR 60.61-Blueberry Farms: Production ManagerR 258.84-Worker ClassificationSource: Own Compilation from StatsSA, 2017; SABPA, 2017; WCDoA, 201910
The blueberry industry does not only create thousands of jobs, but the socioeconomic impact of these jobs are further strengthened by wage payments thatare around 26% higher than the legislated minimum wage and 15% higher for thosepicking blueberries during the season. This comes at a time where the agriculturalsector in general is struggling to adapt to minimum wages that have increasedsubstantially since 2013 (BFAP, 2018).Comparing then the relative labour intensivity between the different fruit industries,Figure 5 shows the labour cost per hectare for these crops at full bearing (includespermanent and seasonal farmworkers). These figures are obtained from a recentstudy measuring the socio-economic impact of the South African fruit industry(FruitSA, 2018). Since blueberries were not included as part of the analysis, thecalculations from the survey amongst blueberry producers fill this gap and providesa further breakdown of the different labour activities conducted in the primaryproduction phase.At the lower end of the spectrum, lemon and wine grape production have thelowest labour annual cost per hectare of around R13 000. Next, subtropical fruit andcitrus incur labour costs in the region of R23 000 – R48 000 per hectare, whilst that ofboth stone and pome fruit were marginally higher at R65 000 per hectare. Aftergrapefruit, the intensity of labour required increases significantly as the perishabilityand quality requirements of the product increase. Thus, average labour cost forcherries in full bearing is R110 000, followed by table grapes with R128 000 perhectare. Finally, blueberry labour cost, in line with the highest employment multiplier,had the highest cost component amongst the fruits compared in Figure 4 with180 000160 000140 000120 000100 00080 00060 00040 00020 000LemonsWine GrapesMangoSoft otsPlumsGrapefruitCherriesTable GrapesBlueberriesLabour Cost/hectareR155 000 per hectare.Figure 5: Labour cost comparison per hectare of fruit in 2018Source: FruitSA, 2018; WCDoA, 201911
The biggest proportion of labour costs in blueberry production is for harvesting,making up 37%. Growers normally use a benchmark of around 25-30kg of blueberriespicked per labourer per day during harvesting. However, in many cases labourer areable to pick much larger quantities which allow for higher payments and is thereforelinked to the productivity of each picker. Permanent farmworkers are mainly used forthe maintenance of orchards (10%), weeding (14%), spraying of chemicals (11%)and irrigation scheduling (9%). Important to note is that the labour requirementslisted here does not include labour for annual establishment of new hectares, orthose being replaced. For each hectare planted, additional man days are neededfor putting up structures (nets or plastic), for land preparation and filling of pots withsubstrate.The employment created in the industry should also be considered in line withseasonal requirements for labour. The blueberry harvest season predominately issuch that seasonal labour is utilised during the time of year when other industrieshave already harvested their crops. Figure 6 provides some context in this regard byindicating the percentage share of each product’s total exports completed duringeach month of 2018. To ease interpretation, different bars and areas are highlighted.Starting with grapes and stone fruit, around 70% of these fruits are harvested in thefirst three months of the year. Next, the harvest for apples and pears starts toincrease from mid-March to September, whilst the bulk of the citrus fruits are pickedfrom May to September.40% tMayJunJulTable GrapesAugPomefruitFigure 6: Percentage of total exports throughout a yearSource: ITC, 201912SepOctNov DecBlueberries
At this point in the year, blueberries are ripening and harvested in Septemberthrough to December as indicated by the blue-dotted line. Around 60% ofblueberries are picked in October and November, exactly at the time when alimited amount of seasonal farm labourers are required by other industries. Eventhough the absolute number of workers for blueberry picking is comparatively smallcompared to citrus and table grapes, the additional jobs created at this time allowsseasonal workers to have more job opportunities spread throughout the year.ExportsThe blueberry industry is particularly export orientated. Over the last ten years freshblueberries from South Africa has become sought after in international markets dueto its outstanding high quality. In 2018 South Africa was ranked 12th in the world forcountries exporting blueberries, achieving an export volume of around 8 000 tons(ITC, 2019). As noted earlier, production of blueberries has seen exceptional growthin the past few years, which has also translated into a similar expansion in exports.South Africa’s location in the Southern Hemisphere allows the country to produceblueberries during the Northern Hemisphere’s off-season, with the higher demandtranslating into decent prices for blueberries (Pienaar, 2018).World imports of blueberries have increased from R6.2 billion in 2008 to R45.4 billion in2018; an annual average growth of 22% (ITC, 2019). This growth rate for the past fiveyears has been even higher at 25%. South African blueberry exports to the worldhave grown from R133 million in 2013 to R1.058 billion in 2018 (SARS, 2019). This is anannual growth rate of 51% in this period. Figure 7 shows the export performance ofSouth African blueberries over time, with the size of the bubbles indicating growth intons, whilst the y-axis gives the value of exports.Value of Exports in Rand (millions)R 1 4008083R 1 200R 1 0004622R 800R 60025692082R 400R 2006349261129149615061558R-Figure 7: South African blueberry exports to the world in volumes and valueSource: SARS, 201913
Since 2008, the industry has managed to export an increasing number of tons intoworld markets, growing from 634 tons to more than 8 000 tons in 2018. Beforeanalysing South Africa’s export performance relative to the country’s maincompetitors, Figure 8 is a series of step-wise diagrams showing South Africa’s mainmarkets by export value share since 2013. Traditionally, the United Kingdom (UK) hasbeen the major export destination for blueberries and it continues to be a growingand important market. However, moving from left to right in the figure, South Africahas managed to diversify its export basket of countries and the reliance on the UKhas decline from 90% in 2013 to 54% in 2018 (SARS, 2019). Through this diversificationprocess, the export percentage to other destinations has both expanded and everyyear an increasing number of markets have been added.201320143%20151%4%2%9%4%8%17%90%72%87%United KingdomNetherlandsUnited KingdomNetherlandsUnited elandGermanyHong KongMalaysiaHong esothoSpainHong 173%3%2%5%3%24%20186%7%3%2%9%62%55%25%54%20%United KingdomNetherlandsUnited KingdomNetherlandsUnited nSingaporeHong KongHong KongSpainSingaporeUAESpainOtherUAEOtherSaudi ArabiaOtherFigure 8: South African blueberry export destinations by valueSource: SARS, 201914
Other important markets for South Africa are the Netherlands (20%) and Germany(9%). In recent years Ireland, Malaysia, Spain and Singapore have also risen toprominence, making up a combined share of 13% in 2018. Some leading markets forSouth Africa to the Middle-East were the United Arab Emirates (1.2%) and SaudiArabia (0.8%). The share exported to Africa, although small (0.03%) has beenincreasing rapidly from R309 thousand in 2014 to R4.2 million in 2018 (SARS, 2019).Many opportunities exist within the African market to expand both exports andproduction in the medium term.The performance of the blueberry industry in both expanding export volumes anddiversifying into new markets is a positive one, especially as world demand for theproduct is still increasing. However, attaining improved access to key markets is oneof most pertinent challenges mentioned by industry role players.Market AccessThe good performance and growth in South African blueberry exports should also bediscussed in relation to the export performance of countries delivering blueberries atthe same seasonal window as South Africa. In terms of net exports, Figure 9 showsthe export performance of major blueberry producing countries. Chile hastraditionally been the world’s leading blueberry exporter, although other countrieshave grown faster over the past decade. Peru, which only started commercialblueberry production in 2011, has grown the fastest amongst exporters in the pastfive years, averaging 112% per annum. They are followed by Mexico and SouthAfrica each with around 50% per annum (ITC, 2019). Other notable competitorsgrowing their export base were Spain (23% per annum), Morocco (41% per annum
blueberry industry was estimated and shows that for every hectare under production, blueberry growers employs an average of 2.64 workers on farms, whilst another 0.22 jobs per hectare is created for those packing the fruits and those . Farm-level Employment per hectare . 7 Vacciniaceae specie of which three dominate the commercial production