Transcription
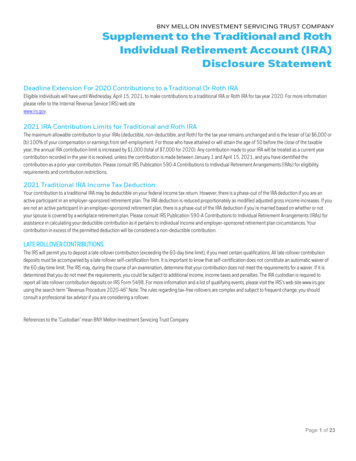
CHAPTER9:ECONOMICCONTRIBUTION9.1 INTRODUCTIONComprised of three commercial service and 22 general aviation airports,the New Hampshire State Airport System Plan (NHSASP) consists of 25public use facilities that serve the air transportation needs of over 1.3million New Hampshire (NH) residents, business users, leisure travelers,and military aviation. The system is an important contributor to state andlocal economies by supporting thousands of jobs throughout the statewhile generating millions of dollars in state tax revenue.In addition to quantitative economic benefits, the system also providesa wide range of qualitative benefits, and impacts that simply cannot bemeasured such as health and safety benefits that contribute to the overallwelfare of the state. Among others, services such as medical transportand evacuation, search and rescue operations, law enforcement flights,military exercises, and flight training all contribute directly to the qualityof life of those who live and work in NH.This report provides an assessment of the economic contribution andbenefits of the NH state airport system to NH and its local communitiesin 2013. The following types of effects have been assessed: On-airport Economic Activity Off-airport Economic Activity, supported by: Airport Capital Expenditures Airport and Airport Tenant Operations and MaintenanceSpending Visitor Spending Travel Time Savings of General Aviation Business Travelers Community Benefits of General AviationThis report provides an overview of the contribution of the 25 airportsincluded in the system. The airport-specific contribution of each of the12 NPIAS airports is provided in Appendix 9-A.9.1.1NEW HAMPSHIRE STATE AIRPORT SYSTEMAs presented in the chapters that precede this economic assessment,the 25 airports in the system have been classified into one of five airportcategories. Based primarily on size and function, these categoriesinclude: primary, national, regional, local and basic. The airports thatfall within each particular category are presented below as of 2014 andshown in Figure 9-1.Primary Commercial Service Airport: The state’s three primary airportsinclude: Manchester-Boston Regional Airport, Lebanon Municipal Airportand Portsmouth International Airport at Pease.CHAPTER 9 ECONOMIC CONTRIBUTIONPAGE 9-1
General Aviation National Airports: Boire Field (Nashua) is the state’sonly national airport.General Aviation Regional Airports: Concord Municipal Airport, DillantHopkins (Keene) Airport and Laconia Municipal Airport have beenidentified as the state’s regional airports.General Aviation Local Airports: Berlin Regional, Claremont Municipal,Mt. Washington Regional, Parlin Field, Hampton, and Skyhaven Airportsmake up the local airports in NH.General Aviation Basic Airports:The basic airports in the systeminclude: Alton Bay, Dean Memorial, Errol, Franconia, Gifford, Gorham,Hawthorne Feather, Jaffrey Airport-Silver Ranch , Moultonboro,Newfound Valley, Plymouth Municipal, and Twin Mountain.Twelve of the airports in the system are included in the 2013-2017National Plan of Integrated Airport Systems (NPIAS) (Table 9-1). Theplan identifies nearly 3,400 existing and proposed airports that aresignificant to national air transportation and eligible to receive Federalgrants under the Airport Improvement Program (AIP). The individualeconomic contribution of each of the 12 NPIAS airports is presentedin Appendix 9-A; the economic contribution of the 13 non-NPIAS ispresented in aggregate form.Table 9-1 - Study AirportsAirports in 2013-2017 NPIAS: IndividualEconomic Contribution presented in this reportPrimary AirportsNational AirportsRegional AirportsLocal AirportsBasic Airports Airports NOT in 2013-2017 NPIAS: EconomicContribution presented in aggregate form onlyManchester-Boston Regional AirportLebanon Municipal AirportPortsmouth International Airport at PeaseBoire FieldConcord Municipal AirportDillant Hopkins AirportLaconia Municipal AirportBerlin Regional AirportClaremont Municipal AirportMt. Washington Regional AirportSkyhaven Airport Parlin FieldHampton AirfieldDean Memorial Airport Alton Bay Airport (Ice Rwy/Seaplane Base)Errol AirportFranconia AirportGifford AirportGorham AirportHawthorne Feather AirportJaffrey Airport Silver-RanchMoultonboro AirportNewfound Valley AirportPlymouth Municipal AirportTwin Mountain AirportSource: Chapter 3, State Airport System PlanPAGE 9-2STATE AIRPORT SYSTEM PLAN
Figure 9-1 - New Hampshire State Airport SystemFIGURE 9-1:SYSTEM AIRPORTS QUEBECBasicGiffordErrolLocalBerlin RegionalRegionalMAINEMt. WashingtonRegionalNationalGorhamTwin MountainPrimaryFranconiaDATE: FEBRUARY 2015Dean 8.01 State Airport System Plan\Draw\GIS\9-1AllAirports.mxdLebanon MunicipalClaremont MunicipalMoultonboroNewfoundValleyParlinLaconia MunicipalAlton BaySkyhavenConcord MunicipalHawthorne FeatherDillant HopkinsManchesterBoston RegionalJaffrey-Silver Ranch02040MilesBoireMASSACHUSETTSATL ANT ICOCEANPortsmouth Int'lHamptonPrepared By:Source: GRANIT, Natural Earth.Source: The Louis Berger GroupCHAPTER 9 ECONOMIC CONTRIBUTIONPAGE 9-3
Primary Commercial Service AirportsManchester-Boston Regional Airport, owned by the City of Manchester,is NH’s largest airport and is classified as a primary commercial serviceairport. The airport is located in Manchester on the border betweenHillsborough and Rockingham counties about 50 miles to the northof Boston. With regard to passenger volume, Manchester’s annualenplanements of 1.2 million in 2013 make it the fourth largest airport inNew England. Manchester-Boston Regional Airport is the third largestin New England in terms of cargo with 167.3 million pounds of enplanedand deplaned cargo in 2013. General aviation, not including air taxi,accounted for 21 percent of the airport’s operations in 2013 (Table 9-2).Lebanon Municipal Airport is a city-owned airport in Lebanon, inGrafton County near the Vermont border. The Lebanon area is home toDartmouth-Hitchcock Medical Center, the state’s only academic medicalcenter and only Level 1 Trauma Center. Dartmouth College , a privateuniversity with enrollment of more than 6,000 students is located in theneighboring town of Hanover. Lebanon Airport is one of only four airportsin the state with an air traffic control tower and had 8,347 commercialservice air taxi operations in 2013. In the same year, general aviation,not including air taxi operations, accounted for 75 percent of the airport’stotal operations. Major tenants at the airport include: Cape Air, the airport’s commercial service provider; Granite State Air, a full-service fixed based operator; and Sharky’s Helicopter, the largest helicopter dealer in the world,offering helicopter sales, maintenance, and flight training.As one of the premier general aviation airports in NH, Lebanon providesair access and services for corporate aircraft that regularly use theairport. The airport is also a critical resource for Dartmouth-HitchcockAdvanced Response Team (DHART) whose crews provide air medicaltransportation services to the medical communities of Northern NewEngland and respond to public safety agency requests for medicalevacuation of trauma patients from scenes of injury.Portsmouth International Airport at Pease is located on the former PeaseAir Force Base, in Rockingham County and the I-95 seacoast corridor.The former military base was closed as part of the first Base Realignmentand Closure Commission (BRAC) round in 1995 and was redevelopedas a civilian airport with the NH Air National Guard (ANG) remaining atthe site. Military operations accounted for 21 percent of the operations atPease Airport in 2013. Created as part of the ongoing redevelopment ofthe Pease Air Force Base, the site also includes the Pease InternationalTradeport (Tradeport), a business park with 2.1 million of square feetof industrial space and 1.2 million of square feet of office space, andthe Pease Golf Course. The Pease Airport, Tradeport and golf courseare managed and operated by the Pease Development Authority (PDA),which is an independent state agency. While commercial service wassuspended several years ago, at the end of 2013 Allegiant Air startedoffering multiple flights per week to Florida from Pease. In 2013 thePAGE 9-4STATE AIRPORT SYSTEM PLAN
number of enplanements on air taxi and commercial service was 22,543,a 66.8 percent increase compared to the 2012. General aviation, notincluding air taxi operations, accounted for 61 percent of the airport’soperations in 2013. The airport is home to a number of corporate flightdepartments, and two FBOs (Premier and Port City Air) that service avariety of customers from, construction companies, to auto dealers, andfractional jet operators. Notably, the airport is home to Plane Sense, afractional aircraft-ownership company with the largest civilian fleet ofPilatus PC-12 aircraft in the world.General Aviation National AirportsOperated and maintained by the Nashua Airport Authority, Boire Fieldis located in Nashua, the second most populous city in the state, inHillsborough County. The airport does not have any scheduledcommercial air service; however, it is equipped with one of the only fourair traffic control towers in the state, operated by Midwest ATC. Nashuais home to a number of corporate flight departments and air charteroperators, two full-service fixed based operators, helicopter sales,maintenance, and training facility, a pilot shop, and an airport restaurant.In 2013, local and itinerant operations made up 95 percent of the airport’soperations, while general aviation air taxi operations accounted for 5percent. With over 50,000 operations in 2013, Boire Field is the state’sbusiest general aviation airport.General Aviation Regional AirportsThe three regional airports in the system are located throughout thestate and include the following:Concord Municipal Airport is located in Concord the state’s capital thethird most populous city in NH, in Merrimack County. The airport hasone fixed base operator, Concord Aviation Services, which offers aircraftservices and fueling. Vehicle rental services are available on-airport.Concord Municipal Airport is also home to the NH Air National Guard andthe NH State Police Aviation unit. In 2013 General aviation accountedfor 88 percent of the airport operations, 5 percent of which included airtaxi. Military operations accounted for 12 percent of the airport’s totaloperations. The airport does not have scheduled commercial service.However with nearly 50,000 annual operations; Concord is the secondbusiest general aviation airport in the state and is utilized regularlyby financial corporations, the forest industry, utility and constructioncompanies, local private schools, and race teams, due to the airport’sproximity to the NH Motor Speedway.Laconia Municipal Airport is located in Gilford, in Belknap Countywith exclusively general aviation activity in 2013. As the third busiestgeneral aviation airport in the state, Laconia serves a wide range ofgeneral aviation aircraft who utilize the airport for both business andrecreation. Primary users of the airport include major retail corporations,local colleges, and fractional aircraft operators. The airport experiencesa significant amount of traffic from travelers that consider LaconiaMunicipal airport as a destination due to its proximity to area privateschools, summer camps, and the NH Motor Speedway. As the premierCHAPTER ECONOMIC CONTRIBUTIONPAGE 9-5
airport in the NH Lakes Region, the airport is home to two full servicefixed base operators and tenants offering helicopter, seaplane, biplaneand aerial photography, and scenic flight services.Dillant-Hopkins Airport, the fourth busiest general aviation airport in thestate is located in Keene, in Cheshire County. In 2013, general aviationaccounted for 93 percent of the airport’s operations, 15 percent of whichwas air taxi. Military operations accounted for 7 percent. The airportis the base of flight operations for a wholesale grocery distributioncorporation whose headquarters are located in Keene. In addition, theairport is home to one full service fixed based operator (FBO, and andaircraft maintenance facility. The majority of flying activities at the airportinclude corporate business, recreational, and flight training.General Aviation Local AirportThere are five local airports in the NH system, four of which are part ofthe NPIAS. These four local airports combined for nearly 50,000 generalaviation operations in 2013.As part of this economic assessment, the four local NPIAS airportsinclude: Berlin Regional Airport located in Berlin, the only city in CoosCounty, Claremont Airport, located in Claremont, in Sullivan County,Mt. Washington Regional Airport, located in Whitefield in Coos County,and Skyhaven Airport owned and operated by the Pease DevelopmentAuthority, located in Rochester, in Strafford County. The fifth existinglocal airport is Parlin Field, located in the Dartmouth-Lake Sunapeeregion of the state in the Town of Newport in Sullivan County.General Aviation Basic AirportsThe system includes 13 basic airports. Most of these airports are locatedin the northern counties: Coos, Grafton and Carroll. Only one basicairport has been specifically assessed as part of this study since theother basic airports are not part of the 2013-2017 NPIAS.Dean Memorial Airport is located in Haverhill in Grafton County. Alloperations in 2013 were general aviation. Although, the airport doesnot have a full service FBO the airport does provide self-serve 100LLfuel, and aircraft storage and tie-downs, as well as a facility for militarytraining stop-overs.PAGE 9-6STATE AIRPORT SYSTEM PLAN
Table 9-2 - Operations by AirportSystem RoleTotal OpsAir CarrierAir ester-Boston RegionalPrimary/ NPIAS63,95531,45719,71110,3322,319136Lebanon MunicipalPrimary /NPIAS34,533-8,34712,18713,665334Portsmouth Intl at PeasePrimary/ NPIAS36,3286175,9562,34419,6997712Biore FieldNational/ NPIAS55,764-31826,28626,62426Concord 0Dillant-HopkinsRegional/ NPIAS49,027-7,2047,45531,0533314Laconia MunicipalRegional/ NPIAS43,725-4273,71039,483105SkyhavenLocal /NPIAS17,000--5,00012,0000Berlin RegionalLocal/ NPIAS12,200-1004,0008,000100Claremont MunicipalLocal /NPIAS10,500--4,6005,9000Mt. Washington RegionalLocal/ NPIAS7,030-204,0003,00010Dean MemorialBasic/ NPIAS1,300--2601,0400Various AirportsLocal and 2,07446,158131,824227,23319,017AirportGrand TotalSource: Chapter 3, State Airport System Plan9.1.2OUTLINE OF THE REPORTThis report begins with an overview of the methodology that was employedto conduct the study. A summary of the demographic and economiccharacteristics of the State of NH and each of its counties follows,which provides context for the economic contribution assessment. Theeconomic contribution assessment includes on-airport employmentas well as the off-airport economic activity indirectly supported by thesystem. Economic activity that is indirectly supported, or multipliereffects triggered by the four following expenditures are quantified: (1)airport capital expenditures; (2) airport operation and maintenanceexpenditures; (3) airport tenant expenditures; and (4) visitor spendingby passengers and pilots. The economic effects of the state system areexpressed in terms of jobs, labor income and output or sales revenueand tax revenues. The report also assesses the travel time savingsobtained by business travelers using general aviation airports. Finally,community benefits are discussed. In addition to statewide analysis, aseparate analysis is presented for each of the 12 airports that are part ofthe NPIAS in Appendix 9-A.MethodologyAt the start of the study, the project team conducted an extensive datacollection effort that focused on the airports that are part of NPIAS.One exception was Manchester-Boston Regional Airport, which wassubject of a study published in 20091. As part of this current study, thedata collection effort was limited and supplemented with 2009 data thatwas extrapolated to 2013. The data collection effort included personal1City of Manchester, Manchester Economic Impact Study for 2008, 2009CHAPTER ECONOMIC CONTRIBUTIONPAGE 9-7
interviews with airport management, an airport tenant survey, a visitingpilot survey, personal interviews with state economic development staffand a review of existing public federal, state and local data sources.The data collected provided an initial overview of the airport system’sdirect contribution to the state and local economies. The data alsoprovided insight into the wider economic benefits and impacts beyondconventional measurement generated by the NH’s airports. Theseinclude but are not limited to increased mobility, quality of life benefits,and the critical services that general aviation airports offer.Input-output modeling techniques were used to estimate the multipliereffect triggered by spending by airport management, tenants, employeesand visitors. The multiplier effect is the ripple effect that occurs whenpurchases from in-state vendors and payments to local employees triggeradditional economic activity at other businesses throughout the state. TheIMPLAN input-output modeling system was used to quantify the multipliereffect. IMPLAN was originally created by the US Forest Service to helpit gauge the effects of its policies on regional economies and is currentlyowned by IMPLAN Group LLC. The spending impact is expressedin terms of jobs, labor income and output (or sales revenue) and taxrevenues. Tax revenue sources estimated as part of this study includebusiness profit tax, business enterprise tax and meals and rooms tax.In addition to on-airport jobs and multiplier effects, travel time savingsfor business travelers relying on general aviation were estimatedand monetized. Additional benefits to the community were discussedqualitatively. More detailed qualitative benefits for each of the systemairports are provided in Appendix 9-A where individual airport economicimpacts are presented. A detailed explanation of the methodology usedto determine the economic impact of the NH state airport system isavailable in Appendix 9-B. AIRPORT MANAGEMENT Jobs operating and maintaining theairports AIRPORT TENANTS Jobs at fixed based operators, aircraftmaintenance providers, airlines, government agencies, retail andground transportation companies MULTIPLIER EFFECT OF SPENDING BY the AIRPORT, itsTENANTS, their EMPLOYEES and VISITORS arriving by air-- Capital Expenditures Jobs in construction, engineering andsupplying industries throughout the state-- O&M Expenditures Jobs at vendors supplying on-airportbusinesses and their suppliers throughout the state-- Employee Household Spending Jobs in education, healthcare, retail, transportation, entertainment, food production andother industries serving households throughout the state-- Visitor Spending Jobs at hotels, restaurants, car rental, retailand supporting industries serving visitors throughout the state TRAVEL TIME SAVINGS Shorter travel time to customers,suppliers and business partners and cost savings for localbusinesses COMMUNITY BENEFITS Improved quality of life for localresidents, making NH more attractive place to live as well ascritical community access, emergency preparednessPAGE 9-8STATE AIRPORT SYSTEM PLAN
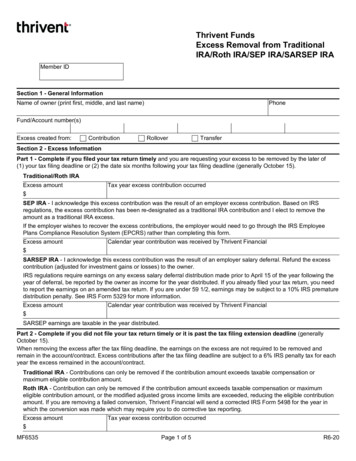
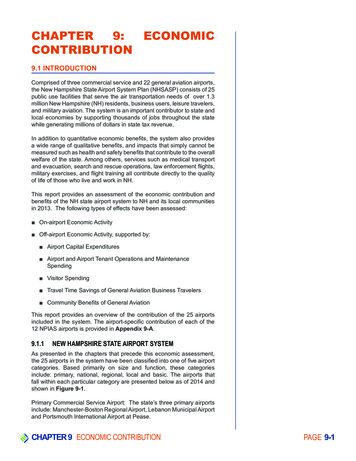
Demographic and Economic ProfileForty percent of NH’s 1.3 million residents live in rural areas. About450,000 residents, or 34 percent of the state’s population, live in placeswith a population of more than 10,000 while the remaining 66 percentlive in places with population of less than 10,000 (Table 9-3). NH’s mainpopulation and employment centers are located along two corridors inthe southern half of the state: the I-93 corridor and the I-95 corridor/seacoast.The I-93 Corridor includes Manchester, the state’s largest city in terms ofpopulation as well as its most densely populated. Manchester is locatedin Hillsborough County. Also located in Hillsborough county is Nashua,the state’s second largest city in terms of population. To the north ofHillsborough county, along the I-93 Corridor, is Merrimack County, whichincludes Concord, NH’s third most populous city.The I-95 Seacoast Corridor includes Portsmouth, which is in RockinghamCounty. Also in Rockingham County is the Pease International Tradeport,an industrial and business park created as part of the redevelopmentof the Pease Air Force Base. Portsmouth and the Tradeport accountfor 3.8 million square feet of office space, almost half of the total 8.1million square feet in office space in the corridor. Located along the I-95corridor in Strafford County are Dover and Rochester, the state’s fifthand sixth most populous cities respectively, as well as Hampton andSkyhaven Airports.Figure 9-2 shows the distribution of population across the state; Figure9-3 shows the distribution of employment.Table 9-3 - Population in Main Population Centers in New Hampshire, 2010Place NameCountyPopulationManchester CityHillsborough109,565Nashua CityHillsborough86,494Concord CityMerrimack42,695Dover CityStrafford29,987Rochester CityStrafford29,752Keene CityCheshire23,409Derry CDPRockingham22,015Portsmouth CityRockingham20,779Laconia CityBelknap15,951Claremont CitySullivan13,355Lebanon CityGrafton13,151Somersworth CityStrafford11,766Londonderry CDPRockingham11,037Strafford10,345Durham CDPBerlin CityCoosTotal Population in Places above10,051450,352Source: Census 2010, Places with Population of more than 10,000 in 2010CHAPTER ECONOMIC CONTRIBUTIONPAGE 9-9
Figure 9-2 - Population DensityFIGURE 9-2:POPULATION DENSITY QUEBECBasicGiffordErrolLocalBerlin RegionalRegionalMAINEMt. WashingtonRegionalNationalGorhamTwin MountainPrimaryPopulation/Sq. MileFranconiaCensus Tract LevelLess than 100Dean Memorial100 - 200200 - 400400 - 800PlymouthMunicipal800 - 2,500Greater than 2,500MoultonboroDATE: FEBRUARY 2015NewfoundValleyLebanon Municipal\\mjcolo-dc\K\17898.01 State Airport System Plan\Draw\GIS\PopSqMi.mxdVERMONTClaremont MunicipalParlinLaconia MunicipalAlton BaySkyhavenConcord MunicipalHawthorne FeatherDillant HopkinsManchesterBoston RegionalJaffrey-Silver Ranch02040MilesBoireMASSACHUSETTSATL ANT ICOCEANPortsmouth Int'lHamptonPrepared By:Source: GRANIT, Natural Earth.Louis Berger, U.S. CensusSource: The Louis Berger GroupPAGE 9-10STATE AIRPORT SYSTEM PLAN
Figure 9-3 - Employment DensityFIGURE 9-3:EMPLOYMENT DENSITY QUEBECGiffordBasicErrolLocalBerlin RegionalRegionalMAINEMt. WashingtonRegionalNationalGorhamTwin MountainPrimaryFranconiaJobs/Sq. MileCensus Tract LevelLess than 10Dean Memorial10 - 2020 - 3030 - 40PlymouthMunicipal40 - 5050 - 100100 - 200Greater than 200NewfoundValleyDATE: FEBRUARY 2015\\mjcolo-dc\K\17898.01 State Airport System Plan\Draw\GIS\JobsSqMi.mxdLebanon MunicipalClaremont MunicipalMoultonboroParlinLaconia MunicipalAlton BaySkyhavenVERMONTConcord MunicipalHawthorne FeatherDillant HopkinsManchesterBoston RegionalJaffrey-Silver Ranch02040MilesBoireMASSACHUSETTSATL ANT ICOCEANPortsmouth Int'lHamptonPrepared By:Source: GRANIT, Natural Earth.Louis Berger, U.S. CensusSource: The Louis Berger GroupCHAPTER ECONOMIC CONTRIBUTIONPAGE 9-11
PopulationOver half of the NH population lives in Hillsborough and RockinghamCounty (Table 9-4). These two counties are also the most denselypopulated counties in the state. The least populated counties, Carrolland Coos, account for 30 percent of the land area and 6 percent ofthe state’s population. Access to general aviation airports is critical forresidents of these remote, sparsely populated areas since emergencyaviation services would otherwise be unavailable without air access.Table 9-4 - Population and Population Density by County, 2012PopulationDensity (pop/sqm)PopulationHillsborough County400,72130%87610%457Rockingham County295,22322%6958%425Merrimack County146,44511%93410%157Strafford County123,1439%3694%334Grafton County89,1187%1,70919%52Cheshire County77,1176%7078%109Bellknap County60,0885%4004%150Carroll County47,8184%93110%51Sullivan County43,7423%5376%81Coos ountyTotal PopulationLand Area inSquare MilesPercent of TotalLand AreaPercent of TotalPopulationSource: American Community Survey, 2008-2012Historically, the largest populated counties have experienced a fasterpopulation growth than the state as a whole (Table 9-5). Between 2010and 2012, population of several other counties experienced a decline,especially Coos County, the most northern county bordering both Maineand Vermont.Table 9-5 - Annual Population Change by County, 2Hillsborough County2.00%1.30%0.50%0.30%Rockingham County2.60%1.20%0.60%0.40%Merrimack County2.00%1.30%0.70%0.10%Strafford County2.00%0.70%0.90%0.40%Grafton County1.30%0.90%0.90%0.00%Cheshire County1.20%0.50%0.40%-0.20%Belknap County1.40%1.20%0.80%0.20%Carroll County2.40%2.10%0.90%-0.30%Sullivan County0.70%0.50%0.80%-0.80%Coos County-0.10%-0.50%0.00%-1.50%State Total1.90%1.10%0.60%0.20%Source: NH Employment Security, Community Profiles http://www.nhes.nh.gov/elmi/products/cp/PAGE 9-12STATE AIRPORT SYSTEM PLAN
Based on the most recent projections from State of NH, Office of Energyand Planning Regional Planning Commissions, NH’s population has aprojection of 1,427,098 by 2040, with an increase of 110,628 between2010 and 2040 or a growth rate of 2.3 percent per year (Table 9-6).Annual growth is projected to be 0.3 percent between 2010 and 2020;0.4 percent between 2020 and 2030; and 0.1 percent between 2030and 2040.Following a nationwide trend, NH’s population is aging. However, by2040, every NH County is projected to experience a natural decline,which means that the number of deaths will exceed the number of birthsand that any potential population growth will come from immigration.Between 2030 and 2040, population growth is projected to slow downin every county.The population of Hillsborough County is projected to grow at thestatewide average rate in every decade while Rockingham County’spopulation is projected to grow faster than state average between 2010and 2020. Beyond 2020 Rockingham county is expected to grow at thestate average. Carroll County, which was the fastest growing countyin the past three decades, is projected to continue to grow faster thanthe state average. Its neighbor to the south, Belknap County, is alsoprojected to grow faster than the state average.Table 9-6 - Population Projections by County, 2010-2040Growth RateCounty2010-20202020-20302030-2040Hillsborough County0.30%0.40%0.10%Rockingham County0.40%0.40%0.10%Merrimack County0.30%0.40%0.10%Strafford County0.40%0.40%0.20%Grafton County0.30%0.30%0.10%Cheshire County0.10%0.20%0.10%Belknap County0.40%0.50%0.20%Carroll County0.50%0.70%0.30%Sullivan County0.40%0.50%0.30%Coos County-0.40%-0.40%-0.80%State Total0.30%0.40%0.10%Note: Compound Annual Growth Rate (CAGR)Source: rojections-state-counties.pdfHousehold IncomeBased on the most recent data, household income was the highest inthe Rockingham and Hillsborough counties (Table 9-7).CHAPTER ECONOMIC CONTRIBUTIONPAGE 9-13
Table 9-7 - Household Income Distribution by County, 2012Less than 25,000 25,000 to 49,999 50,000 to 74,999 75,000 to 149,999 150,000 7%27.0%8.3% 77,939Hillsborough19.2%29.7%22.3%22.2%6.5% 70,472Merrimack20.0%24.7%20.1%28.0%7.2% 65,487Statewide29.5%29.8%19.2%18.2%3.3% 64,925Strafford20.7%26.1%18.1%25.6%9.5% 58,538Belknap15.5%19.5%17.8%33.4%13.8% 57,163Cheshire16.7%21.6%18.4%33.4%9.9% 56,062Sullivan12.2%18.1%17.4%35.9%16.5% 53,821Grafton18.9%23.9%18.7%29.0%9.5% 53,386Carroll20.5%25.7%20.2%27.8%5.8% 50,865Coos16.7%21.7%18.5%31.3%11.8% 41,774CountySource: American Community Survey, 2008-2012 (in 2012 dollars)EmploymentHillsborough and Rockingham counties accounted for 53 percent of theemployment in 2013 (Table 9-8). Rockingham, Strafford and Graftoncounties experienced the strongest employment growth during the 20022007 expansion, with an annual growth rate of 1.2 percent. Straffordand Grafton counties also experienced less employment decline thanthe state as a whole during the recession from 2007 to 2010.Table 9-8 - Employment by County, 2013Employment LevelAnnual Employment Growth (CAGR)2013% of borough County190,60731.0%0.9%-2.3%Rockingham County137,50022.0%1.2%-1.6%Merrimack County73,49812.0%0.6%-0.6%Grafton County52,1668.0%1.2%-0.9%Strafford County45,3927.0%1.2%-1.0%Cheshire County31,9295.0%0.8%-2.1%Belknap County25,5194.0%0.9%-2.9%Carroll County19,9683.0%0.6%-0.9%Sullivan County13,7912.0%0.1%-1.9%Coos County12,5132.0%0.2%-2.6%State Total*618,781100%0.90%-1.60%CountySource: US Bureau of Labor Statistics, Quarterly Census of Employment and Wages* discrepancy due to NHDOL non-disclosureI-93 Corridor submarkets, Manchester and Nashua in HillsboroughCounty, and Concord in Merrimack County accounted for two thirds,or 13.9 million, of the corridor’s total 21.1 million square feet of officespace. Portsmouth and the Tradeport accounted for 3.8 million squarefeet which is nearly half of the total 8.1 million square feet in office spacein the I-95/Seacoast submarket.PAGE 9-14STATE AIRPORT SYSTEM PLAN
Retail, health care and government are the largest sectors in NH(Figure 9-4). Accounting for 31 percent of all employment, HillsboroughCounty’s industry pattern mirrors that of the state as a whole (Table 9-9).Bordered by the seacoast and I-95 corridor on the eastern side andthe I-93 corridor on the west, Rockingham County has proportionallymore jobs in transportation and warehousing. Sullivan County, whichis on the border with Vermont, has
National Plan of Integrated Airport Systems (NPIAS) (Table 9-1). The plan identifies nearly 3,400 existing and proposed airports that are significant to national air transportation and eligible to receive Federal grants under the Airport Improvement Program (AIP). The individual economic contribution of each of the 12 NPIAS airports is presented