Transcription
“Reducing drug-related crime is oneof the main objectives of thegovernment’s drug strategy. Thisrecognises that good quality drugtreatment can prevent high-volumeacquisitive offending ”estimating the crimereduction benefitsof drug treatmentand recovery
NTA 2012Estimating the crime reductionbenefits of drug treatment andrecovery122.12.22.334566.16.26.36.47Executive nEstimating the counterfactual volume of drug-related crime forclients in effective treatmentCalculating the upper estimateCalculating the lower estimateCalculating the mid-point estimateEstimating the counterfactual cost of drug related crime for clientsin effective treatmentEstimating the potential reduction in drug-related offending for clientsin effective treatmentEstimating the potential impact of disinvestment in drug treatmentEstimating the potential reduction in drug-related offending forformer clients who go on to sustain long term recoveryEstimating the period of time by which treatment may hasten therecovery processEstimating the number of people who go on to sustain long-term recoveryAllocating the crime reduction benefits of recovery over timeEstimating and valuing the potential crime reduction benefits of recoveryConclusionAppendix A: GlossaryAppendix B: Key assumptionsAppendix C: A taxonomy of drug-related harmsAppendix D: Matching DTORS offence categories with offences in legislationAppendix E: Sustaining long term recovery dataEndnotes3455588912131314151618192021242627The National Treatment Agency for Substance Misuse, 6th Floor, Skipton House, 80 London Road, London SE1 6LHT:020 7972 1999 F: 020 7972 1997 E: nta.enquiries@nta-nhs.org.uk W: www.nta.nhs.ukMay 20122
NTA 2012Executive SummaryBackgroundThe Home Office estimates that drug related crimecosts 13.9bn per year1 and that offenders who useheroin, cocaine or crack cocaine commit betweena third and a half of all acquisitive crimes2. As aresult, reducing drug-related crime is one of themain objectives of the government’s drug strategy3.This recognises that the provision of good qualitydrug treatment, combined with stable housing andemployment, can be very effective in preventing highvolume acquisitive offending.Drug addicted people often develop a tolerancethrough daily compulsive use, which can result inan expensive addiction. For instance, the estimatedaverage value of drugs used in the four weeks prior totreatment among participants of the Drug TreatmentOutcomes Research Study (DTORS) was 1,2964. Withlittle income they may resort to crime to pay for theirdrug use. This might include acquisitive crimes suchas shoplifting, burglary or robbery, or other financiallymotivated crimes such as soliciting and begging. Drugtreatment is designed to reduce people’s need fordrugs, which in turn reduces the driving force behindtheir drug-related offending.The National Treatment Agency for Substance Misuse(NTA) has worked closely with economists in theHome Office (HO) and the Department of Health (DH)to build a Value for Money (VFM) model in responseto the National Audit Office recommendation todevelop a framework for evaluating value for moneyin relation to the previous drug strategy5. The VFMmodel estimates the crime prevention and healthimprovement benefits of treatment and recovery. Thisis the first time such estimates have been made at anational level.This report sets out a detailed explanation of how theestimates were calculated for the crime componentof the VFM model and has been endorsed by HO.It will be followed by a publication later this year onthe health improvement benefits of drug treatment,presenting our work with DH on the potentialimprovements to Quality Adjusted Life Years (QALYs)from drug treatment and recovery. Crime preventionand health improvement are not the only potentialbenefits of drug treatment. There are a variety ofdifferent harms associated with drug use and we hopeto look at other potential benefits of treatment andrecovery in relation to these in the future.society of 960m in costs to the public, businesses,the criminal justice system and National HealthService (NHS). We also estimate that approximately19.6m crimes may be prevented over the course ofthe Spending Review 2010 period (SR10) (2011-12to 2014-15), with an estimated saving to society of 3.6bn.In addition we estimate that up to a further 4.1moffences may be prevented over a nine year period(from 2011-12 to 2019-2020), because we estimatethat 13,702 people who left treatment in 2010-11 willgo on to sustain long term recovery, with an estimatedvalue of 700m. We also estimate that continuedinvestment in drug treatment over the SR10 periodcould lead to up to an estimated 54,000 former clientssustaining long term recovery which may prevent upto 16.6m more offences with an estimated value of upto 2.6bn by 2023-24.The model also helps us to estimate the potentialimpact of disinvestment in adult drug treatment. Weestimate that, all else being equal, for every 1mtaken out of the system there could be an increase ofapproximately 9,860 drug-related crimes per year atan estimated cost to society of over 1.8m.These findings are based on an empirical analysis ofdata from the National Drug Treatment MonitoringSystem (NDTMS) linked to conviction records from thePolice National Computer (PNC) and on self reportedoffences data from DTORS.QualificationsMany of the figures included in this report areestimates rather than observations and so thesefigures cannot be interpreted as direct, quantifiablemeasures of a causal effect of drug treatment and assuch the findings are indicative and not definitive. Webased our estimates on the best available evidence,but we are aware that there is not always as muchevidence as we would like. These estimates can beimproved over time as new evidence comes to light.Where evidence was not available we have had to relyon assumptions.FindingsWe estimate that drug treatment and recovery systemsin England may have prevented approximately 4.9mcrimes in 2010-11, with an estimated saving to3
NTA 20121. IntroductionThere is a well established, but complex relationshipbetween illicit drug use and crime6. This relationshipdiffers between individuals and even for the sameindividual over time. For some, committing crimepreceded drug use and for others drug use precededcriminality. Not everyone with a treatment needcommits drug related crime, for instance roughly halfof treatment clients do not7. Also some treatmentclients will commit crime which is not drug related, thismeans that even if they stop taking drugs and recoverfrom their addiction, they may continue to commitcrime (Assumption 6, Appendix B).The European Monitoring Centre for Drugs andDrug Addiction (EMCDDA) has identified fourkey explanations for drug related crime whichhighlight this complexity: economic-compulsive;psychopharmacological, systemic and drug lawoffences8. This report focuses on the first of these, theeconomic-compulsive relationship.The economic-compulsive relationship means thatdrug addicted people often develop a tolerancethrough daily compulsive use, which can result inan expensive addiction. For instance, the estimatedaverage value of drugs used in the four weeks prior totreatment among participants of the Drug TreatmentOutcomes Research Study (DTORS) was 1,2969. Withlittle income they may resort to crime to pay for theirdrug use, such as shoplifting, burglary or robbery, orother crimes such as soliciting and begging.This report describes the evidence, assumptions andmethodology which have been used to produce thecrime component of the VFM model. We plan topublish a suite of themed papers on the Value forMoney of drug treatment and recovery. This is the firstof such papers and will be followed by a publicationlater this year on the health improvement benefitsof drug treatment, presenting our work with theDepartment of Health on Quality Adjusted Life Years(QALYs). Crime prevention and health improvementare not the only potential benefits of drug treatment.There are a variety of different harms associated withdrug use and we hope to look at other potentialbenefits of treatment and recovery in relation to thesein the future. We have included a taxonomy of drugrelated harms in Appendix C.treatment. Section 5 estimates the potential impact ofdisinvestment in drug treatment. Section 6 estimatesthe potential reduction in drug-related offending forformer clients who leave treatment successfully andare predicted to go on to sustain long term recovery.Appendix E includes data on the estimated number offormer clients who go on to sustain long term recoveryfrom their addiction.These findings are based on an empirical analysis ofdata from the National Drug Treatment MonitoringSystem (NDTMS) linked to conviction records from thePolice National Computer (PNC)10and on self reportedoffences data from the Drug Treatment OutcomesResearch Study (DTORS). Appendix D includes a tablewhich shows how we linked DTORS offence categorieswith offences in legislation. A report detailing theNDTMS and PNC data matching results, The Impact ofTreatment on Reconviction for Drug-Related Offenceshas recently been published to accompany this report.The VFM model only includes clients who haveremained in treatment for at least 12 weeks (or exitedprior to this in a care-planned way), which is theNDTMS measure of effective treatment. While theremight be significant benefits for those individualswho do not reach the 12-week point or leave in anunplanned way before then, they have not beenincluded in the analysis. Where we do provideestimates of potentially prevented offences at anindividual level, the findings are for an average clientand so we do not distinguish between opioid and/or crack cocaine users (OCUs) and non-opioid and/orcrack cocaine users (non-OCUs). We have provided aglossary of terms in Appendix A.Many of the figures included in this report areestimates rather than observations and so thesefigures cannot be interpreted as direct, quantifiablemeasures of a causal effect of drug treatment andas such the findings are indicative and not definitive(Assumption 5, Appendix B). We have tried to baseour estimates on the best available evidence, but weare aware that there is not always as much evidence aswe would like. These estimates can be improved overtime as new evidence comes to light. Where evidencewas not available we have had to rely on assumptions.Appendix B provides a table of key assumptions.Section 2 of this report estimates the counterfactualvolume of drug related crime for clients in effectivetreatment. Section 3 estimates the counterfactual costof drug related crime for clients in effective treatment.Section 4 estimates the potential reduction in drugrelated offending for clients who are in effective4
NTA 20122. Estimating the counterfactualvolume of drug related crime forclients in effective treatmentTo assess the impact of drug treatment on drug-relatedcrime, we first needed to estimate what would havehappened in the absence of treatment. This is knownas the counterfactual. We have calculated an upperestimate, lower estimate and mid-point estimate.2.1 Calculating the upper estimateUnfortunately, there is no data on the self-reportedlevel of offending of drug users in the 12-monthperiod prior to treatment, presumably because thatlength of recall is unlikely to be reliable or the studywould be too costly and difficult. We therefore have torely on estimates.To do this, we used self-reported offence data fromDTORS11. There were 1,796 drug users recruited to thestudy who were considered to be representative of thedrug treatment population (Assumption 8, AppendixB). Of these, 1,698 participants were asked to reportwhether they had committed an offence in the 28-dayperiod prior to being interviewed and if so the volumeand type of offence that they had committed. A rangeof offences were reported, with the most commonbeing shoplifting and the least common being houseburglary. The mean number of self reported offenceswas 10.35 per person. As this report is focused onthe economic-compulsive drug crime link, we haveexcluded ‘other violent crime’ from our analysis andso the average we use is 10.24 rather than the 10.35reported in DTORS (Table 1).If the offences committed in the 28 days prior totreatment were representative of the year prior totreatment, then we could assume that each drug usercommits 133.5 drug related offences on average eachyear when not in treatment (10.24*13.04).In 2010-11, there were 191,129 clients engaged ineffective treatment. The NDTMS measure of treatmenteffectiveness refers to retaining clients in treatment formore than 12 weeks, or leaving the treatment systembefore then in a care-planned way. Only clients whomeet these criteria are included in the VFM model.T1. Reported offences in the four weeks beforetreatment (DTORS)DTORS offence typeMean number of offencesShoplifting3.71Theft of a vehicle0.05Theft from a vehicle0.15House burglary0.03Business burglary0.19Violent theft (robbery)0.06Bag snatch0.07Cheque or credit card fraud0.08Begging0.47Buying and selling stolen goods2.43Drug dealing2.13Prostitution0.49Other stealing0.38Benefit FraudNo meanOther violent crimeDTORS TotalTotal (excluding violent crime)0.1110.3510.24 (10.35 – 0.11)T2. Upper estimate total and per person counterfactual offences by DTORSoffence categoryEstimated averageEstimated counterfactualDTORS offence typecounterfactual offencesoffences 2010-11per person 2010-119,243,33148.4Theft of a vehicleShoplifting124,5730.7Theft from a vehicle373,7202.0House burglary74,7440.4Business burglary473,3782.5Violent theft (robbery)149,4880.8Bag snatch174,4020.9Cheque or credit card fraud199,3171.0Begging1,170,9886.1Buying and selling stolen goods6,054,25731.7Drug dealing5,306,81827.8Prostitution1,220,8176.4Other stealingTotal (excluding violent crime)946,7565.025,512,591133If all of these clients were not in treatment, it isestimated that they would have committed a total of25.5m offences in the 12 months preceding treatment(133.5*191,129) (Table 2). We refer to this as theupper estimate in the VFM model.2.2 Calculating the lower estimateIt could be argued that the four-week period prior todrug treatment is not representative of the year priorto treatment, because the offence pattern of drug5
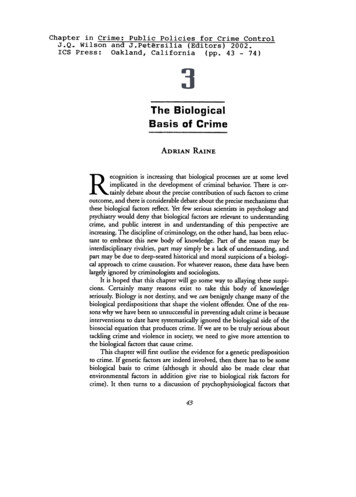
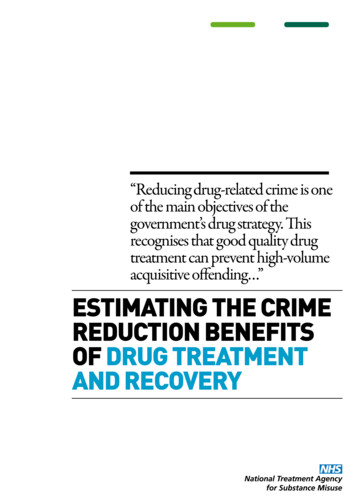
NTA 2012using offenders can fluctuate, with peaks and troughsover the course of a year (and their drug taking‘career’ more generally) owing to a variety of complexand interconnected issues.F1. rate of convictions in the year prior to treatment for 53,851 individualsstarting treatment in 2006-07Convictions5,000Arguments could be made that the self-reporteddata is potentially an underestimate. For instance,in DTORS, respondents were asked whether theiroffending in the four weeks prior to interview was“More, less or the usual amount” and found that43% of the participants said that they had offendedless than usual. In addition, 40% of treatment seekersreported to use a lesser quantity of drugs14. However,it is not possible to determine from the data what thetrue extent of this underestimate might have been andso for the purposes of the VFM model we have notincreased the upper estimate.Conversely, it could also be argued that it is anescalation in drug use and therefore drug relatedoffending which causes some individuals to comeinto contact with drug treatment either through selfreferral or criminal justice referral. Indeed, 24% ofDTORS respondents reported to offend more thanusual before starting treatment.To address this issue we anonymously matchedconvictions data from the PNC with data from NDTMSfor the cohort of 53,851 individuals starting treatmentduring the financial year 2006-07. This analysisenabled an observation of the conviction rates for‘trigger offences’15 in the year prior to treatment. It isimportant to note however, that convictions will notnecessarily reflect the pattern of actual offending,however for the purpose of the VFM model we haveassumed that they do (Assumption 7, Appendix B).As Figure 1 shows, the greatest number of convictionsoccurs in the four weeks immediately before clientsengage with treatment, suggesting that there couldbe increased criminal behaviour during that time. Thegraph is divided into thirteen 28-day periods to mirrorthe 28-day period used in DTORS. The upper lineshows the level of convictions if the four-week periodbefore treatment was representative and the lowerline shows the mean conviction rate for the year.Convictions if the four-week period prior to treatment is representative of convictions in a year4,5004,0003,500Mean number of 7654321Four-week periods before treatmentT3. convictions in the 13x28-day periods before dtors interviewFour-week periodpre DTORSinterviewActualconvictionsProportion ofconvictionsConvictions ifProportion ifDTORS period was DTORS period 1,303100%Assuming the convictions trend is a good proxy foroffences, the findings support the argument that thefour-week DTORS self-reported data is unrepresentativeof the previous 12 months offending activity.However, a case could be made that the observedpattern is biased towards a greater rate of convictionsin the four weeks before treatment due to the closeworking relationship between the criminal justice anddrug treatment systems. There is a direct referral route6
NTA 2012for individuals into treatment following arrest for adrug-related offence: an appearance in the PNC dataof a trigger offence means there is a greater probabilitythe same individual would then appear in NDTMS data.T4. lower estimate total and per person counterfactual offences by DTORSoffence categoryEstimated averageEstimated counterfactualDTORS offence typecounterfactual offencesoffences 2010-11per person 2010-115,547,68729.0This is supported by the convictions data itself whichreveals that the mean convictions per offender in thetwo-year period prior to treatment was 1.30 comparedto 1.35 in the 30-day period prior to treatment. Whatthis data shows is that the increase in offences in the30-day period prior to treatment is primarily a propertyof the increasing number of offenders being convictedjust prior to treatment, rather than the number ofconvictions per person increasing.Theft of a vehicle74,7670.4Theft from a vehicle224,3001.2House burglary44,8600.2Business burglary284,1131.5Violent theft (robbery)89,7200.5Bag snatch104,6730.5Cheque or credit card fraud119,6270.6Begging702,8073.7ShopliftingA further complication is that DTORS did not alwaysinterview participants on the day that they engagedwith treatment. In fact, the average time elapsedbetween the initial contact with the drug treatmentservice and the DTORS interview was 13 days. Thismeans that on average, almost half of the 28 dayswithin which each person was asked to recall theiroffending behaviour in the previous four weeksactually occurred after they had engaged withtreatment, thereby potentially reducing the likelihoodof offending or other harmful actions. To deal withthis anomaly, we adjusted the 28-day window priorto a hypothetical DTORS interview date (i.e. toinclude convictions committed 13 days after startinga treatment intervention, as well as 15 days before)when modelling the annual rate of offending usingthe PNC data. This gives a figure of 4,716 offencesoccurring during the equivalent period of the DTORSinterview (see period 1 in Table 3). Each other period inthe table below represents a 28-day window countedback from this index period.If all convictions happened equally during theprevious year, the assumption which the upperestimate is based on, then each 28-day periodwould provide 7.7% (28/365) of the convictions.However, the proportion of convictions occurring inthe relevant period versus the annual total is 12.8%(4,716/36,796).Assuming that the number of convictions isproportionate to the volume of actual offencescommitted in a given period, a lower estimate of theannual cost of drug-related crime can be establishedby supposing that the criminal activity reported atthe DTORS interview is taken to represent 12.8%of crimes committed during the whole year. Thislower estimate of the annual number of drugrelated offences is thus 60% of the upper estimate(36,796/61,308) (Table 4).Buying and selling stolen goods3,633,66019.0Drug dealing3,185,06016.7Prostitution732,7133.8Other stealing568,2273.015,312,21580Total (excluding violent crime)T5. mid-point estimate total and per person counterfactual offences byDTORS offence categoryEstimated averageEstimated counterfactualDTORS offence typecounterfactual offencesoffences 2010-11per person 2010-11Shoplifting7,395,50938.7Theft of a vehicle99,6700.5Theft from a vehicle299,0101.6House burglary59,8020.3Business burglary378,7462.0Violent theft (robbery)119,6040.6Bag snatch139,5380.7Cheque or credit card fraud159,4720.8Begging936,8974.9Buying and selling stolen goods4,843,95925.3Drug dealing4,245,93922.2Prostitution976,7655.1Other stealing757,4924.020,412,403107Total (excluding violent crime)T6. Estimates of the upper, mid-point and lower estimates of the volume ofcounterfactual offences for clients in effective treatment 2010-11EstimatedEstimatedcounterfactualNumber of clients incounterfactual crimescrimes 2010-11 (pereffective treatment2010-11person)Upper estimate133191,12925.5mMid-point estimate107191,12920.4mLower estimate80191,12915.3m7
NTA 20122.3 Calculating the mid-point estimateAs there is not an overwhelming argument eitherway between using the lower or upper estimates, wedecided to use the mid-point between them as ourestimate of the counterfactual of drug-related crimes,or in other words the number of drug-related crimeswhich might have been committed if no drug userswere in effective treatment in 2010-11 (Table 5).The mid-point estimate is 20.4m and is the mean ofthe upper and lower estimates. This translates into107 offences per person per year on average. As this isan average it is worth remembering that some clientswill have committed no offences at all and others willhave committed more than this.Throughout the report we provide estimates based onthe mid-point, but also a range using the upper andlower estimates. Table 6 provides a summary of thethree estimates.3. Estimating the counterfactual costof drug related crime for clients ineffective treatmentThe Home Office (HO) has estimated the economicand social costs of crime against individuals andhouseholds. However, they have not estimated all ofthe crimes which are included in the DTORS offencecategories. This means that our cost estimates willunderestimate the counterfactual cost of drug relatedcrime. Table 7 highlights which DTORS offencecategories we have been able to cost and those wehave excluded and why.Table 8 sets out the unit costs we have used in theVFM model based on the most up to date estimatesprovided by the HO.18 The HO was content for ‘Theft –not vehicle’ to be used as a proxy for ‘bag snatch’ and‘cheque or credit card fraud’. The unit costs of drugrelated offences are made up of a range of elementsthat are incurred by different groups, such as thephysical and emotional impact on victims and costs toindividuals, businesses and public services19.These unit costs can then be multiplied by theestimated annual offences to estimate thecounterfactual costs of offending in 2010-11. Themid-point estimate is 5bn with a range from 3.7bnto 6.2bn (Table 9). Note that these figures cannotbe directly compared to the estimated social andeconomic cost of drug related crime in the HO OnlineReport 16/06. The latter’s estimate of 13.9bn wasbased on National Treatment Outcomes ResearchStudy (1998) offending data whereas the approachdescribed in this paper is based on data from the morerecent DTORS (2007). They also both use a differentsubset of crime types and the latter estimate was notT7. DTORS offences excluded from our cost estimatesDTORS offence typeCosts includedShopliftingReason for exclusionYesTheft of a vehicleYesTheft from a vehicleYesHouse burglaryYesBusiness burglaryYesViolent theft (robbery)YesBag snatchYesCheque or credit card fraudYesBuying and selling stolengoodsNoBeggingNoDrug dealingNoProstitutionNoOther stealingNoIn calculating the unit cost of buying andselling stolen goods, the costs to the victim ofthe original theft have already been countedwithin other categories and the criminaljustice system costs have not been calculatedby the Home Office. It was also omitted fromthe estimated costs of drug-related crime inDTORS for these reasons.The Home Office has not estimated the costsof these offences as its estimates are generallyof crimes against individuals and householdsand begging, drug dealing and prostitution areclassed as neither. They were also omittedfrom the estimated costs of drug-relatedcrime in DTORS for this reason.There is no unit cost for this offence as it is nota statutory offence, but rather a term used inthe DTORS questionnaire on offending.T8. unit cost of offences included in the vfm modelDTORS offence typeUnit cost 2010-11 pricesShoplifting 124Theft of a vehicle 4,970Theft from a vehicle 1,034House burglary 3,925Business burglary 4,608Violent theft (robbery, personal) 8,810Bag snatch (theft, not vehicle) 763Cheque/credit card fraud (theft, not vehicle) 763T9. estimates of the total counterfactual cost of offending in 2010-11(2010-11 prices)DTORS offence typeLower estimateMid-pointestimateUpper estimateShoplifting 688m 917m 1,146mTheft of a vehicle 372m 495m 619mTheft from a vehicle 232m 309m 386mHouse burglary 176m 235m 293m 1,309m 1,745m 2,181mViolent theft (robbery) 790m 1,054m 1,317mBag snatch 80m 106m 133mCheque or credit card fraud 91m 122m 152mBeggingUnknownUnknownUnknownBuying and selling stolen goodsUnknownUnknownUnknownDrug nownUnknownOther stealingUnknownUnknownUnknown 3.7bn 5bn 6.2bnBusiness burglaryTotal8
NTA 2012a counterfactual. Also this paper only estimates thecounterfactual for clients in effective treatment anddoes not estimate the drug related crime cost forclients who are not in effective treatment.T10. estimates of the total counterfactual cost of offending per person in2010-11 (2010-11 prices)Shoplifting 3,599 4,798 5,997These estimates can then be divided by the numberof clients in effective treatment to estimate thecounterfactual costs of offending per person in 201011. The estimated cost per person using the midpoint estimate is 26,074 with an estimated range of 19,559 to 32,589 (Table 10).Theft of a vehicle 1,944 2,592 3,239Theft from a vehicle 1,213 1,618 2,022 921 1,228 1,535Business burglary 6,850 9,131 11,413Violent theft (robbery) 4,136 5,513 6,891 418 557 6964. Estimating the potential reductionin drug-related offending for clientsin effective treatmentThe NTA study ‘The Impact of Drug Treatment onReconviction’21 compared the differences in theconviction rates of known offenders in the two yearsbefore their initial assessment for drug treatmentand the two years after. It presented the results of ananalysis of data from NDTMS and conviction recordsfrom the PNC using the government’s Drug DataWarehouse (DDW)22.The data is drawn from a cohort of people who starteda new course of drug treatment in 2006-07 and whohad at least one conviction during the two years priorto their start date. The study was limited to triggeroffences and sex working. It found that the individualsretained in treatment for the entire two-years (4,677)showed an average 47% reduction in convictions.The VFM model is also based on the data containedin the DDW, but a slightly different method has beenused which is why the results differ. While the reportdescribed above focused on people with a previousconviction, the VFM model focuses on all clients,whether they had a conviction or not prior to startingtreatment. It also only includes people who were intreatment continuously for two years from when theystarted treatment in 2006-07, whereas the previousreport only specified that people had to have startedtreatment in 2006-07.Two years of continuous treatment contact have beenused to represent as closely as possible the averagelength of time a client spends in continuous treatmentand also because the purpose of this analysis was tobest estimate the protective factor treatment has onreducing offending during the time that clients areengaged in effective treatment. There were 13,819individuals included in this category.DTORS offence typeLower estimateHouse burglaryBag snatchCheque or credit card fraudMid-pointestimateUpper estimate 478 637 796BeggingUnknownUnknownUnknownBuying and selling stolen goodsUnknownUnknownUnknownDrug nownUnknownOther stealingUnknownUnknownUnknown 19,559 26,074 32,589TotalT11. the reduction in convictions before and during treatment for thestudied cohortConvictionsConvictionsin the twoin the twoyears beforeyears afterPercentageDTORS offence typeReductiontreatment, less treatment, lesschangethose from one those from onemonth beforemonth afterShoplifting7,2475,763-20%-1,484Theft of a vehicle315230-27%-85Theft from a vehicle349260-26%-89House burglary527320-39%-207Business burglary521426-18%-95Violent theft (robbery)10060-40%-40Bag snatch175132-25%-43Cheque or credit card ing stolen goods511278-46%-233Drug 22930-24%-292Other stealingBy anonymously matching the cohort of 13,819individuals on NDTMS with PNC data, for two yearsbefore and two years after they
key explanations for drug related crime which highlight this complexity: economic-compulsive; psychopharmacological, systemic and drug law offences8. This report focuses on the first of these, the economic-compulsive relationship. The economic-compulsive relationship means that