Transcription
Application NoteUSING TDR TO DEBUG SIGNALINTEGRITY ISSUESProducts: R&S RTO2000 R&S RTP R&S ZNBRohde & Schwarz Version 1.00 08.2020
Contents12345Overview. 3Introduction . 4The Basics of TDR . 5Matching Performance with Characteristics. 7Best Practices and a Suggested Process . 105.15.25.3Two best practices .10A suggested process .12Another useful technique.1467Examples from a Debug Workflow . 15Solutions from Rohde & Schwarz. 177.17.2R&S RTP and R&S RTO2000 oscilloscopes .17R&S ZNB vector network analyzers .188Conclusion . 19Rohde & Schwarz Application Note Using TDR to Debug Signal Integrity Issues 2
1 OverviewTime Domain Reflectometry (TDR) has long been used as a tool for evaluation of boards, cables, andconnectors. For signal integrity analysis, the TDR "measurement" has traditionally been done on oneinstrument (sampling oscilloscope or VNA) and the system-level "analysis" performed on another instrument(real-time oscilloscope). Integrating the TDR measurement and analysis into the same instrument not onlysaves time using a single instrument but offers a more intuitive approach to overall signal integrity analysis.Rohde & Schwarz Application Note Using TDR to Debug Signal Integrity Issues 3
2 IntroductionFrom LAN to USB, from DDR4 to PCI Express, every digital design has three basic building blocks:transmitters, channels and receivers. The transmitter output may look clean on the screen of an oscilloscope,but high-speed signals degrade as they travel through the channel to the receiver. At the far end of thechannel, the receiver has to properly detect data in the presence of noise and other types of interference.Three issues are most likely to affect signal integrity. One is signal attenuation, and engineers often useequalization to fix this problem. Another issue is “outside” interference such as crosstalk or coupled noisefrom the power-distribution network (PDN). Third is “internal” interference from reflections due to impedancemismatches.Impedance problems are often related to discontinuities in the channel. These may be present in connectors,printed circuit board (PCB) traces, solder pads, or any other element in the path between transmitter andreceiver. Time-domain reflectometry (TDR) is a highly effective way to measure impedance effects andlocate the mismatches.Oscilloscopes and vector network analyzers are both capable of making informative TDR measurements.Each has important strengths and weaknesses relative to performance, measurement noise, and additionalcapabilities (e.g., protocol analysis, S-parameters).In this white paper our focus is on the use of an oscilloscope to measure TDR and then identify and debugthe effects of reflections due to impedance mismatches. We start with a review of TDR basics and then, withthat foundation, shift to the matching of scope performance with SUT requirements. From there, the narrativeoutlines a suggested process for TDR measurements. The final section presents an overview ofrecommended solutions from Rohde & Schwarz.Rohde & Schwarz Application Note Using TDR to Debug Signal Integrity Issues 4
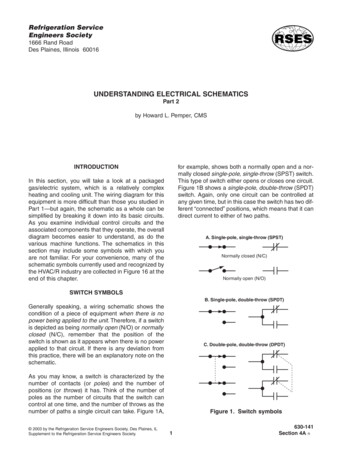
3 The Basics of TDRDevelopers often start with a device data sheet and a reference design. When the device is used in a circuit,reality is often different. The eye diagram in Figure 1 includes a test mask (red hexagon) that indicates avariety of mask failures: signal attenuation; narrowing due to jitter (lower eye); and reduced margin frompower rail noise, crosstalk, or reflections.Figure 1: An eye diagram is an informative diagnostic tool when debugging and troubleshooting digitaldesigns.To help track down the underlying problems, TDR generates a step stimulus and measures the response inthe time domain. The responses from the unknown or “black box” circuit are voltage reflections caused byimpedance mismatches, including open circuits.The stimulus is a fast step, and its rise time corresponds to an equivalent measurement bandwidth. If thechannel has uniform impedance and is properly terminated, there will be no reflections. If reflections aredetected, the amplitudes and polarities depend on the impedance at each discontinuity.The round-trip time between transmitted step and received reflection is related to the distance between thetransmitter and the fault. By calculating length along the channel, TDR pinpoints the discontinuities that arecausing reflections. From this perspective, more resolution in the TDR measurement means greater precisionin locating the cause of each reflection.Within this process, four key parameters determine the accuracy of TDR: the quality of the stimulus (i.e.,incident step signal); rise time and system bandwidth; and differential measurements.TDR stimulus: The quality of the incident step pulse generated by the TDR instrument is especiallyimportant when measuring short traces. The step pulse must have a fast rise time, accurate amplitude and,to ensure quality measurements, minimal aberrations (e.g., overshoot, ring).Rohde & Schwarz Application Note Using TDR to Debug Signal Integrity Issues 5
In addition, the stimulus generator should be as close as possible to the device under test (DUT). Reason:When making TDR measurements, every discontinuity in the channel also acts like a filter and reducesmeasurement resolution. Shorter cables and fewer connections minimize the number of discontinuities in thetest setup itself.Rise time and system bandwidth: The faster the rise time, the wider the bandwidth that can be analyzed.Rise time also determines the spatial resolution or smallest spacing between impedance discontinuities.System bandwidth is a function of source rise time and oscilloscope rise time.The physical spacing of any two discontinuities determines how closely their reflections will occur in the TDRwaveform. To distinguish neighboring faults, the intervening travel time must be less than half the rise time ofthe TDR pulse. A faster rise time will improve resolution and thereby make it easier to view wider-bandwidthartifacts and locate smaller discontinuities.Differential measurements: Many of today’s high-speed serial standards rely on differential transmissiontechniques, using complementary signals. Although more complex than a single-ended architecture,differential transmission is less susceptible to external influences such as crosstalk and induced noise, and itgenerates less of both. 1True differential measurements require a TDR instrument capable of launching simultaneous andcomplementary incident pulses. Also, because precise time alignment is very important, it is best to useskew-matched cables in the measurement setup.The complementary pulses are sent down both sides of the differential pair and the reflections measured.Because the SUT receives a differential stimulus similar to what it sees in the end application, the measuredresults provide insights into the device’s real-world response.1This concept applies to TDR and time-domain transmission (TDT). TDT requires two channels, one connected to thetransmit end of the electrical path and the other connected to the receive end. Consequently, differential TDTmeasurements require four measurement channels.Rohde & Schwarz Application Note Using TDR to Debug Signal Integrity Issues 6
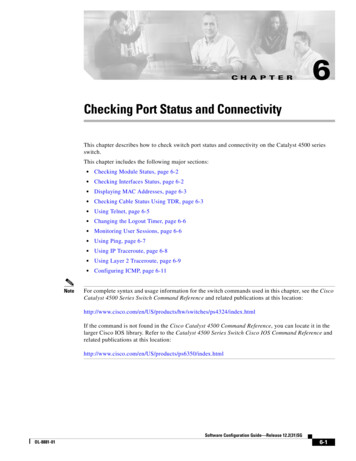
4 Matching Performance with CharacteristicsUnderstanding what you need to measure as well as how your system operates for that measurement willhelp you understand the tradeoffs between TDR rise time and resolution. As a starting point, we need to besure the performance of the oscilloscopes meets or exceeds the characteristics of the system under test(SUT).For example, emitter-coupled logic (ECL) families have rise times in the range of 200 ps to 2 ns. As another,USB3 testing requires TDR with rise times of 50 ps (20 to 80%) or 75 ps (10 to 90%). In all cases,measurements require enough rise time to separate closely spaced discontinuities, but not so muchbandwidth that the in-band noise affects measurement quality.Let’s look at oscilloscope performance relative to TDR measurements. In this application, scope rise timedetermines resolution, as defined by the following equation:𝑙𝑙 2𝑡𝑡𝑟𝑟 𝑐𝑐 𝜀𝜀𝑒𝑒𝑒𝑒𝑒𝑒𝑙𝑙 is the minimum length and therefore the resolution of distance measurements 𝑡𝑡𝑟𝑟 is the system rise time ε is the relative permittivity of the channel 𝑐𝑐 is the speed of light in vacuumSystem rise time, tr, is a root-sum-of-squares function of the pulse and oscilloscope rise times:2𝑡𝑡𝑟𝑟 𝑆𝑆𝑆𝑆𝑆𝑆𝑆𝑆𝑆𝑆𝑆𝑆 𝑡𝑡𝑟𝑟2 𝑃𝑃𝑃𝑃𝑃𝑃𝑃𝑃𝑃𝑃 𝑡𝑡𝑟𝑟2 𝑆𝑆𝑆𝑆𝑆𝑆𝑆𝑆𝑆𝑆Table 1 provides a quick summary of system rise time versus resolution, and Figure 2 shows an examplemeasurement with resolution of 3.5 mm.TDR system rise timeTDR resolution10 ps1 mm20 ps2 mm30 ps3 mm100 ps10 mmTable 1: Faster system rise time equates to finer resolution in locating faults in the electrical path.Rohde & Schwarz Application Note Using TDR to Debug Signal Integrity Issues 7
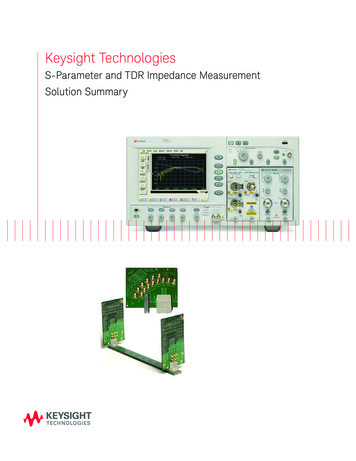
Figure 2: This TDR display has impedance on the vertical axis and distance on the horizontal axis.Next, we need to consider the relationship between rise time and bandwidth as well as their individualeffects. For example, a slow rise time will filter in-bound reflections and limit measurement resolution. Incontrast, a fast rise time provides better resolution, making it easier to see more of the effects that disturbsignal integrity: overshoot, noise, reflections, and so on.There is also a crucial tradeoff: a faster rise time equates to a wider bandwidth, which increases the amountof noise in the measurement. Consequently, we have to make a judgement call: use a narrow bandwidthwhen excess noise is present or use a wide bandwidth when greater TDR resolution is needed (Figure 3).Figure 3: This conceptual diagram illustrates faster and slower rise times, hinting at the direct relationshipswith bandwidth and resolution (e.g., faster means wider/more, slower means narrower/less).The final considerations are the coefficient of reflection and the calculated impedance. As described above,scopes rely on voltage waveforms to measure TDR, comparing incident and reflected signals. These are alsoused to calculate the reflection coefficient, rho (ρ):ρ ��Rohde & Schwarz Application Note Using TDR to Debug Signal Integrity Issues 8
Rho is used in the calculation of impedance in a nonlinear equation:𝑍𝑍(𝑡𝑡) 1 ρ(𝑡𝑡)𝑍𝑍1 ρ(𝑡𝑡) 0We can check the behavior of this relationship by considering three general cases for the resultingimpedance value and corresponding values for rho: A short circuit has zero impedance: Z 0 and therefore ρ –1 An open circuit has infinite impedance: Z and therefore ρ 1 All other cases: the equivalent impedance is Z0 and therefore ρ 0More InformationIf you would like to take a deeper dive into the reflection theory, test methods, and more, please visit theIPC.org website (formerly the Institute for Printed Circuits). It offers detailed information around all thingsrelated to test methods for interconnects: Temporal/spatial resolution Connector torque specifications Protection from electrostatic discharge (ESD) Proper measurement windowing Signal attenuation measurement methods And much moreRohde & Schwarz Application Note Using TDR to Debug Signal Integrity Issues 9
5 Best Practices and a Suggested ProcessA few key ideas can help ensure useful, informative TDR measurements. When preparing to debug a design,two quick checks will help ensure the scope is ready for TDR. Then, a three-step process will help ensureinformative results—and software built into Rohde & Schwarz oscilloscopes can guide you through eachstep.5.1 Two best practicesExperienced users rely on two best practices when preparing to debug a design. One is to review theconfiguration settings that affect distance measurements, and this requires an impedance check followed bymeasurement of a known length. The other involves optimization of averaging settings to reduce noise andensure convergence on the mean value of the measured impedance.The impedance check requires two measurements: an open circuit and a known termination. Figure 4 showstwo example measurements of an 85-ohm differential-coupled trace on a PCI Express PCB. On the left, themeasurement shows an infinite response or open circuit; on the right, the far end has been properlyterminated and the screen trace shows the expected impedance values.Figure 4: These traces show an open circuit (infinite Z) response on the left and a properly terminatedresponse (85 Ω) on the right. The actual distance can be calculated using the time ( 1.9 ps) and the relativepermittivity.It’s worth noting the screen annotation in Figure 4: the vertical axis is impedance (ohms) and the horizontalaxis is time (picoseconds). This is the default for most oscilloscopes; however, the horizontal axis can beswitched to distance based on the relative permittivity value for the transmission channel. Of course, you maynot know the relative permittivity for your design. If this is the case, a quick check with an open or terminatedstructure can help you determine the value.With regard to averaging, digital averaging in the time domain is equivalent to intermediate-frequency (IF)filtering in the frequency domain. Because TDR signals are periodic, averaging can reduce random noise andthus improve measurement accuracy and repeatability.Rohde & Schwarz Application Note Using TDR to Debug Signal Integrity Issues 10
One way to check the effect of averaging is to consider the mean value versus the peak-to-peak spread.Figure 5 shows the results of an experiment that progresses from 10 to 250 averages, and the tracesillustrate the expected effect: there is an inverse-square relationship between the number of averages andthe resulting reduction in noise.10 averages50 averages100 averages250 averagesFigure 5: In this example, the most striking improvement occurred after increasing from 10 to 50 averages.Table 2 compares the mean value and the peak-to-peak spread after 10, 50, 100 and 250 averages.Statistics suggest the mean value will converge after about 50 averages, and the data bear this out.AveragesMean valuePeak-to-peak (absolute) Percent error1099.5 Ω20.9 Ω10.5%5099.8 Ω9.2 Ω4.6%10099.8 Ω6.4 Ω3.2%2502.3%99.6 Ω4.6 ΩTable 2: Increasing the number of averages will reduce the absolute peak-to-peak value, but the mean valueis likely to converge after about 50 averages.Rohde & Schwarz Application Note Using TDR to Debug Signal Integrity Issues 11
5.2 A suggested processA simple three-step process will help you achieve informative results. The steps are calibrate, measure andanalyze.Step 1, Calibrate: The first step is to choose the necessary configuration: TDR or TDT; single-ended ordifferential. As a common example, let’s look at differential TDR. The calibration process requires threemeasurements: short, open, and match (with termination; Figure 6). For each, the measurement sequence isto (1) transmit a known reference from the initial launch point, (2) measure the reflection and (3 backcalculate the variance.Figure 6: In this example, a software wizard guided the calibration process (left) and saved results such asthe frequency-dependent loss curve (right).When the calibration measurements are complete, the oscilloscope software saves the results—cable loss,launch delay, low-frequency leveling, etc.—for use with the actual TDR measurements. In most cases, theentire process takes about 15 seconds to complete.Step 2, Measure: In R&S scopes with the pulse-source option, the resident software includes ameasurement “control console” that presents the relevant user-selectable attributes (Figure 7, left). Theresulting measurement display can be configured to show impedance, reflection coefficient, and more (Figure7, right).Rohde & Schwarz Application Note Using TDR to Debug Signal Integrity Issues 12
Figure 7: Through words, numbers and diagrams, the control console (left) simplifies TDR differentialmeasurements. The example screen (right) shows impedance (upper trace) and reflection coefficient (lower)versus distance (in millimeters).Step 3, Analyze: As a real-world example, let’s look at a 10 Gbps link with skew-matched traces. In Figure 8,the highlights show two trouble spots on the PCB: an etching problem on the left and a discontinuity on theright. Visually, it appears that each is roughly the same distance from its associated PCB pad.Figure 8: This enlarged photo of a 10 Gbps link shows two trouble spots on the PCB.Measurements confirm the visual estimate. In Figure 9, the top trace places the etching problem at adistance of 27 mm from the pad (X2 and X in the lower inset); the lower image places the discontinuity atabout 27 mm from its pad (first upward step in the blue trace).Rohde & Schwarz Application Note Using TDR to Debug Signal Integrity Issues 13
Figure 9: Separate measurements show the location of the etching problem (top) and the trace discontinuity(right) relative to their respective PCB pads.5.3 Another useful techniqueThe preceding approaches are the foundation of a timesaving technique: identify a known-good PC assemblyand use it to create a set of “golden reference” measurements. From those, you can set up a measurementmask with a known impedance profile. Then, when new boards arrive, measuring all against the golden testmask will quickly identify good and bad articles.Rohde & Schwarz Application Note Using TDR to Debug Signal Integrity Issues 14
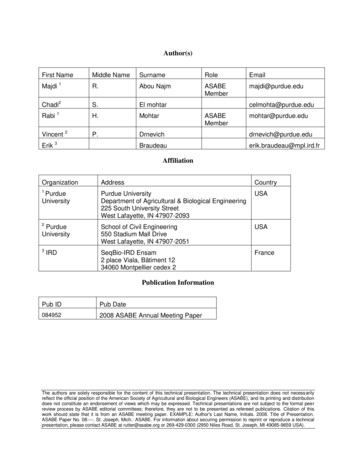
6 Examples from a Debug WorkflowAs noted earlier, the eye diagram is an informative way to debug high-speed digital designs. In this example,TDR was used to optimize a USB3 test setup. A sequence of eye diagrams will illustrate the progressiveimprovement in measured results.Figure 10a shows the initial measurement, made at the far end of the channel. The large areas of red in thehexagonal mask emphasize the numerous mask hits, and the failure rate was 1.039 percent.Figure 10a: In the early stages of debugging, the ability to eliminate problems in the test setup is often thefirst step toward better measurement results.Figure 10b shows a slight improvement after applying de-embedding of the cables and test fixture used in themeasurement setup. Here, the failure rate has decreased to 0.518 percent.Figure 10b: Fast TDR measurements, with rapid convergence on useful results, provided useful deembedding data.Rohde & Schwarz Application Note Using TDR to Debug Signal Integrity Issues 15
Next, TDR revealed the coupling of PDN noise onto the clock line (e.g., a lower impedance value is a sign ofcapacitive coupling). Addressing this issue provided further improvement in the failure rate, bringing it downto 0.086 percent.Figure 10c: Detecting PDN noise and reducing its effects provided a significant reduction in mask hits.Finally, TDR also revealed a variety of layout issues related to lane skew and PCB stubs. Addressing theseissues and also optimizing the test setup provided a significant improvement in the eye diagrammeasurement: as shown in Figure 10d, there are no mask hits and the failure rate is zero percent.Figure 10d: Thorough debugging of the test setup led to a true measurement of the SUT and, ultimately,greater confidence in the “PASS” test result.Rohde & Schwarz Application Note Using TDR to Debug Signal Integrity Issues 16
7 Solutions from Rohde & SchwarzOscilloscopes and vector network analyzers (VNAs) and are both capable of making valid, informative TDRmeasurements. In general, choosing a solution has as much to do with the user’s comfort zone—timedomain versus frequency domain—as it does the relative strengths and weaknesses of each instrument: Oscilloscope: The ability to work with time, frequency, logic and protocol measurements along with eyediagrams and TDR makes this the preferred choice for digital designers and signal integrity engineers. Vector Network Analyzer: Lower noise and higher dynamic range means greater measurementaccuracy. Also, the ability to perform measurements such as S-parameters makes this the preferredchoice for component developers and RF designers.Table 3 provides a side-by-side comparison of these two widely used instruments.OscilloscopeVector Network AnalyzerSourceFast pulseDiscrete continuous wave ge waveform of incident andreflected stepPost-processed via inverse Fouriertransform of frequency-domainmeasurementsSpeedFast: single pulse, rapid reflectionsSlow: multiple discrete CW stimuli pluspost-processing to compute TDRResolutionLimited to pulse rise timeDepends on bandwidthAccuracyLimited dynamic range, good noiseperformanceHigh dynamic range, excellent nsFault location, de-skew, propagationFault location, impedance plus Sdelay, impedance, and probe/cable deparameters, and cable/fixture deembedding (e.g., for debug)embedding (e.g., for characterization)Table 3: Eight key items differentiate the strengths and weaknesses of oscilloscopes and VNAs whenmaking TDR measurements.A brief look at specific solutions from Rohde & Schwarz will highlight the benefits of each approach.7.1 R&S RTP and R&S RTO2000 oscilloscopesThese two families of oscilloscopes are the leading choice for general-purpose measurements plus TDR/TDTcharacterization: R&S RTO2000: Offering bandwidths from 600 MHz to 6 GHz, this series excels at time- and frequencydomain testing. With excellent signal fidelity, 1M waveforms/sec, up to 16-bit vertical resolution, andintuitive SmartGrid operation, you can measure quickly and with confidence.Rohde & Schwarz Application Note Using TDR to Debug Signal Integrity Issues 17
R&S RTP: The R&S RTP high-performance oscilloscope combines high-class signal integrity with afast acquisition rate. Customized frontend ASICs and realtime processing hardware enable highlyaccurate measurements with unprecedented speed in a compact form factor.Recently introduced options add TDR capabilities to the R&S RTP and R&S RTO2000 oscilloscopes: Option R&S RTP-B7/RTO-B7: This plug-in module adds an integrated 16 GHz differential pulsesource to the oscilloscope. Option R&S RTP-K130/RTO-K130: This software option creates a TDR/TDT analysis system thatsupports the characterization and debugging of signal paths using differential and single-endedmeasurements. Option R&S RTP-K121/RTO-K121: This software option adds de-embedding capabilities and realtimewaveform correction; it also leverages TDR/TDT to characterize and de-embed probe and cable effects(e.g., Proven Probe and Proven Cable).7.2 R&S ZNB vector network analyzersMore than 60 years of experience in the field of vector network analysis pays off: the R&S ZNB family ofVNAs sets new benchmarks in speed, dynamic range, precision and ease of operation. The ability to makehigh-resolution measurements enables detailed analyses of the fine structures within the device under test.Four ports are needed to perform differential measurements, and four-port models are available with 4.5 to40 GHz bandwidth. Two options add the necessary capabilities for TDR and time-domain analysis: Option R&S ZNB-K2: This software option adds time-domain analysis, including TDR. It transforms Sparameters into the time domain, making it possible to display discontinuities versus time delay orelectrical/mechanical length. Option R&S ZNB-K20: This software option adds extended time-domain capabilities such as the eyediagram; requires option K2.Time-domain analysis is based on the inverse Fourier transform of the VNA’s frequency-domainmeasurements.Rohde & Schwarz Application Note Using TDR to Debug Signal Integrity Issues 18
8 ConclusionEvery digital design includes transmitters, channels and receivers. When a signal travels through the channelto the receiver, noise and other disturbances can cause signal integrity issues, especially at higherfrequencies. Reflection problems are the result of impedance mismatches, and oscilloscope-based TDRmeasurements are an efficient and effective way to identify, isolate and debug the associated discontinuities.Understanding what you need to measure versus how your instrument operates will help you understand thetradeoffs between TDR rise time and resolution. Applying proven best practices and a three-stepmeasurement process—calibrate, measure and analyze—will ensure better results. These techniques areequally applicable to the DUT and the connected test setup.Within the Rohde & Schwarz lineup, our scopes are engineered to fit your requirements and your budget,from top value to top performance. Across the portfolio, our focus is on delivering oscilloscope innovation thatinspires measurement confidence.Rohde & Schwarz Application Note Using TDR to Debug Signal Integrity Issues 19
Rohde & SchwarzThe Rohde & Schwarz electronics group offersinnovative solutions in the following business fields: testand measurement, broadcast and media, securecommunications, cybersecurity, monitoring and networktesting. Founded more than 80 years ago, theindependent company which is headquartered inMunich, Germany, has an extensive sales and servicenetwork with locations in more than 70 countries.www.rohde-schwarz.comCertified Quality ManagementISO 9001Rohde & Schwarz trainingPAD-T-M: mRohde & Schwarz customer supportwww.rohde-schwarz.com/supportR&S is a registered trademark of Rohde & Schwarz GmbH & Co. KGTrade names are trademarks of the owners. Version 1.00 08.2020Application Note Using TDR to Debug Signal Integrity IssuesData without tolerance limits is not binding Subject to change 2020 Rohde & Schwarz GmbH & Co. KG 81671 Munich, Germanywww.rohde-schwarz.com
To help track down the underlying problems, TDR generates a step stimulus and measures the response in the time domain. The responses from the unknown or "black box" circuit are voltage reflections caused by . incident step signal); rise time and system bandwidth; and differential measurements.