Transcription
Author(s)First NameMiddle NameSurnameRoleEmail1R.Abou NajmASABEMembermajdi@purdue.eduChadi2S.El mohtarRabi 1H.MohtarVincent u@mpl.ird.frMajdiErik tyPurdue UniversityDepartment of Agricultural & Biological Engineering225 South University StreetWest Lafayette, IN 47907-2093USA2PurdueUniversitySchool of Civil Engineering550 Stadium Mall DriveWest Lafayette, IN 47907-2051USA3SeqBio-IRD Ensam2 place Viala, Bâtiment 1234060 Montpellier cedex 2FranceIRDPublication InformationPub IDPub Date0849522008 ASABE Annual Meeting PaperThe authors are solely responsible for the content of this technical presentation. The technical presentation does not necessarilyreflect the official position of the American Society of Agricultural and Biological Engineers (ASABE), and its printing and distributiondoes not constitute an endorsement of views which may be expressed. Technical presentations are not subject to the formal peerreview process by ASABE editorial committees; therefore, they are not to be presented as refereed publications. Citation of thiswork should state that it is from an ASABE meeting paper. EXAMPLE: Author's Last Name, Initials. 2008. Title of Presentation.ASABE Paper No. 08----. St. Joseph, Mich.: ASABE. For information about securing permission to reprint or reproduce a technicalpresentation, please contact ASABE at rutter@asabe.org or 269-429-0300 (2950 Niles Road, St. Joseph, MI 49085-9659 USA).
An ASABE Meeting PresentationPaper Number: 084952Improving TDR Measurements through Accounting forSoil Shrinkage PropertiesMajdi R. Abou NajmAgricultural & Biological Engineering, Purdue University, majdi@purdue.eduChadi El mohtarCivil Engineering, Purdue University, celmohta@purdue.eduRabi H. MohtarAgricultural & Biological Engineering, Purdue University, mohtar@purdue.eduVincent P. DrnevichCivil Engineering, Purdue University, drnevich@purdue.eduErik BraudeauInstitut de Recherche pour le Développement (IRD), FranceWritten for presentation at the2008 ASABE Annual International MeetingSponsored by ASABERhode Island Convention CenterProvidence, Rhode IslandJune 29 – July 2, 2008Mention any other presentations of this paper here, or delete this line.Abstract. Time domain reflectometry (TDR) is a widely used tool for indirect measurement of soilmoisture content. Empirical formulation is used to link the apparent dielectric constant of soil to thevolumetric moisture content (Topp’s Equation: Topp et al., 1980) or gravimetric moisture content as afunction of soil bulk density (Siddiqui and Drnevich Equation: Siddiqui and Drnevich, 1995). Thispaper introduces a methodology to account for soil volume change by integrating the true bulkThe authors are solely responsible for the content of this technical presentation. The technical presentation does not necessarilyreflect the official position of the American Society of Agricultural and Biological Engineers (ASABE), and its printing and distributiondoes not constitute an endorsement of views which may be expressed. Technical presentations are not subject to the formal peerreview process by ASABE editorial committees; therefore, they are not to be presented as refereed publications. Citation of thiswork should state that it is from an ASABE meeting paper. EXAMPLE: Author's Last Name, Initials. 2008. Title of Presentation.ASABE Paper No. 08----. St. Joseph, Mich.: ASABE. For information about securing permission to reprint or reproduce a technicalpresentation, please contact ASABE at rutter@asabe.org or 269-429-0300 (2950 Niles Road, St. Joseph, MI 49085-9659 USA).
density of the soil into the measurements using the soil Shrinkage Curve (specific volume (cm3/g)versus gravimetric water content). Thus, bulk density becomes a non-constant parameter that can becalculated as a function of the soil water content in the Siddiqui and Drnevich Equation. Experimentalevidence demonstrates accounting for soil shrinkage improves the accuracy of TDR measuredmoisture contents and allows for estimating the shrinkage curve. Direct water content calculation forthe Chalmers soil was compared to water contents from TDR readings with and without shrinkagecorrections; those with shrinkage corrections showed significantly improved accuracy in TDRdetermined soil moisture.Keywords. TDR, soil structure, shrinkage properties, shrinkage curve, drying process, watercontent.The authors are solely responsible for the content of this technical presentation. The technical presentation does not necessarily reflect theofficial position of the American Society of Agricultural and Biological Engineers (ASABE), and its printing and distribution does notconstitute an endorsement of views which may be expressed. Technical presentations are not subject to the formal peer review process byASABE editorial committees; therefore, they are not to be presented as refereed publications. Citation of this work should state that it isfrom an ASABE meeting paper. EXAMPLE: Author's Last Name, Initials. 2008. Title of Presentation. ASABE Paper No. 08----. St. Joseph,Mich.: ASABE. For information about securing permission to reprint or reproduce a technical presentation, please contact ASABE atrutter@asabe.org or 269-429-0300 (2950 Niles Road, St. Joseph, MI 49085-9659 USA).
IntroductionAchieving accurate measurements of the soil moisture content is an active area of research andexperimentation (Noborio, 2001, Evett and Parkin, 2005, Robinson et al., 2003 and 2008).Various direct and indirect methods for the measurement and estimation of the water contenthave been developed including oven-drying, as well as the in-situ electrical resistance, neutronprobe, tensiometers, and time domain reflectometry (TDR). While the oven-drying methodrepresents the only direct method for the measurement of soil water content, non-destructive insitu measurements require empirical or constitutive correlations between water content and soilresponse to certain sensor stimuli like change in concentration of slowed neutrons, electricalconductivity, or the soil apparent dielectric constant, Ka.TDR, a widely accepted and increasingly accurate measurement method of soil water content,relies on the accurate measurement of Ka given its sensitivity to the amount of water in the soil(Topp et al., 1980, Siddiqui et al., 2000, Drnevich et al., 2005, Yu and Drnevich, 2004). Thissensitivity comes from the large difference between Ka for water (around 81), soil particles(between 2 and 7) and air (around 1) (Drnevich et al., 2005). Most TDR equipment uses theTopp equation (Equation 1: Topp et al., 1980) in the estimation of the volumetric water contentusing a cubic equation in terms of Ka. Siddiqui and Drnevich (1995) derived a relationshipbetween Ka, dry bulk density (ρd), and the gravimetric water content of the soil, w (Equation 2): TDR 5.3 10 2 2.92 10 2 k a 5.5 10 4 k 2a 4.3 10 6 k 3aKa w a bw dEquation 1Equation 2where ρw is the density of water. a and b are soil-dependent parameters with a related to ρd andthe Ka of the dry soil and b related to the increase Ka with increase in the pore fluid.While the effect of ρd on the Siddiqui and Drnevich Equation has been studied in the context ofcompaction energy due to its direct relevance to geotechnical applications (Drnevich et al.,2005), the effect of change in ρd due the soil shrinkage has not been addressed yet.Accordingly, the effect of structural interaction and internal stress (or energy) change due toshrinkage on Ka and TDR response is not fully understood. Moreover, various studies on clayeyand silty soils have observed considerable effect for temperature, clay content, salinity,saturating cations, frequency, pH, and CEC on the water content predictability using Ka throughempirical formulation (Saarenketo, 1998, Ponizovsky et al., 1999, Ishida and Makino, 1999,Logsdon and Laird, 2004, Kelleners et al., 2004, Chen and Or, 2006, Robinson et al., 2008).Such observations call for more physically based understanding of the relationship between Kaand water content.This paper assesses the performance of the Topp’s as well as the Siddiqui and DrnevichEquations in predicting the volumetric and gravimetric water contents of a drying silty clay loamsoil. The paper then introduces a methodology to account for the soil hydro-structural changeeffect by introducing the real soil specific volume, 1/ d, as a function of the gravimetric watercontent, w, (obtained from the soil Shrinkage Curve) into Equation 2 that is used for themeasurement of w. Thus, bulk density becomes a non-constant parameter that can becalculated as a function of the soil water content using the experimental procedure defined inBraudeau et al., 1999. Finally, the paper presents a new methodology to reconstruct/estimatethe shrinkage curve using only five data points to calibrate the TDR estimates of gravimetric andvolumetric water contents. The new methodology is tested by calibrating the TDR with data from2
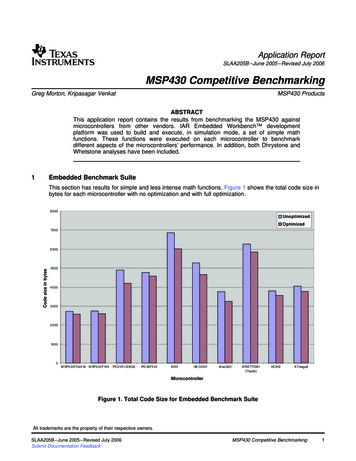
a soil sample and then using the calibration parameters to reconstruct the shrinkage curve (ofanother experiment) with a very close fit.Materials and MethodsTo assess the effect of soil volume change due to shrinkage, continuous measurements ofvolumetric water content as estimated by the TDR ( TDR ) must be compared with simultaneousand direct measurement of the real gravimetric water content wReal, as well as simultaneouscalculation of 1/ρd, taking into account the relationship between gravimetric (w) and volumetric( ) water contents (Equation 3). This becomes an ideal setup for a typical shrinkage curveexperiment (Braudeau et al., 1999, Braudeau et al., 2004) with the addition of the TDR probeand equipment.w w dEquation 3Accordingly, comparisons can be made between the measured (wReal) and predicted gravimetricwater content (wTDR), derived from TDR using Equation 3 and results of ρd from the shrinkagecurve. Similarly, comparisons can be made between the measured volumetric water content( Real ), (derived from wReal using Equation 3 and results of ρd from the shrinkage curve) and predicted TDR . The effect of change in ρd due to shrinkage on the TDR methodology formeasuring the soil water content, can be assessed by comparing the performance of TDRequipment using: (1) built-in parameters vs. soil-specific parameters, (2) a single value of ρd and(3) the specific volume, 1/ρd, as function of wReal (according to the Shrinkage Curve).ProcedureThe procedure followed in the experiments (Figure 1) was:1. Soil preparation: Disturbed soil was sieved using sieve #4 and mixed with water to thedesired water content (near saturation). The soil mixture was sealed and kept for a weekin humid room to allow the water content to equilibrate.2. Specimen base: An acrylic sheet, randomly perforated (with 3/16-inch (4.7-mm)diameter holes) was used as the base for the soil specimen. The sheet was overlaid withrandomly-cut small geotextile sheets (Figure 1) to allow for water exfiltration orevaporation from the bottom of the specimen while preventing the loss of soil as waterescapes the soil.3. Sample preparation: The soil specimen was prepared by uniformly compacting soil inmultiple layers (6 to 8) inside a PVC tube (15cm long and 7.73cm in diameter), used onlyto confine the soil. A thin layer of oil was placed on the inside of the PVC tube to reducethe friction between the PVC and the soil.4. TDR Equipment: A TRASE TDR unit (SoilMoisture Equipment Corp) was used in theseexperiments. The TDR three-rod probe provided with the TRASE TDR was inserted intothe soil specimen and the TDR equipment built-in software was used to collect Ka and TDR readings every 10 minutes for the test duration which lasted approximately fourweeks.5. Calculation of wReal: The soil specimen was placed on an electronic balance connectedto a data acquisition system (using WinWedge software) and the data acquisition system3
was programmed to measure the mass of the soil specimen at 10 minute intervals. Atthe end of the experiment, the gravimetric water content of the specimen wasdetermined by oven drying. Using the last gravimetric water content as a starting point,the water contents of the soil specimen was back calculated as a function of time by useof the measured specimen mass.6. Calculation of ρd: The change in specimen length due to shrinkage was measure byusing an LVDT. Assuming isotropic shrinkage of the specimen (Braudeau et al., 1999,Braudeau et al., 2004), and using the soil mass obtained from the previous step, the bulkdensity (or specific volume) can be calculated as function of time. To avoid any punchingeffect by the LVDT core, the core was placed on a geotextile sheet instead of directlybeing placed on the soil.Figure 1. Schematic of the experiment procedure.It was a challenge to minimize the water content gradients in the soil specimen because thosegradients could affect the TDR readings. This objective was partially achieved by allowing thesoil specimen to dry at room temperature from the top, bottom, and side boundaries (as the soilshrinks, the soil loses contact with the PVC tube). The design of the soil specimen base and theuse of oil at the PVC tube allowed for drying from the bottom and boundaries, respectively.In nutshell, the shrinkage curve experimental setup is used as a control for the purpose of thisstudy providing wReal and ρd as function of time. The TDR equipment on the other hand provides4
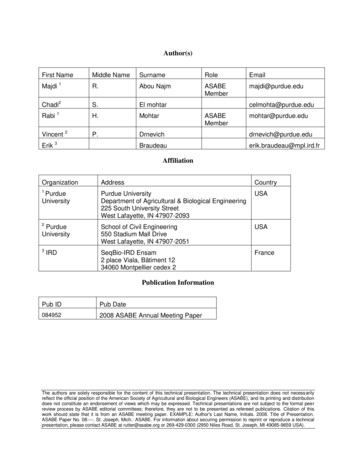
TDR (volumetric water content estimated by the TDR) and Ka. The objective of this study isassess the accuracy of TDR (and the wTDR derived there from) as provided by the TDRequipment to improve those values over those by solving for soil-specific constants (Equations 1and 2) using a single value of ρd (wTDR Single ρd), through solving for soil-specific constants usinginstantaneous values of ρd as predicted and measured by the shrinkage curve (wTDR ShC).MaterialsSamples of the Chalmers clay loam soil were collected from the Agronomy Center for Researchand Education (ACRE) at Purdue University. The Chalmers soil consists of 15% sand, 45% silt,and 40% clay. A complete list of soil properties is provided by Abou Najm et al. (2008). The useof disturbed samples (as explained in the previous section) instead of undisturbed field-collectedspecimens was favored since laboratory-made soil specimens can be prepared with moreuniformity, thus avoiding the presence of large stones, non-soil residues, and major cracks anddiscontinuities.Experimental ResultsThree experiments were conducted for the same soil following the procedure explained in theprevious section. The average duration of each experiment was around 27 days. At the end ofeach experiment, data was downloaded and analyzed to obtain: TDR and Ka (from the TDRunit), wReal (from electronic balance), and ρd (from electronic balance and LVDT). wTDR and Re alwere then derived using TDR , wReal, ρd and Equation 3. Figure 2 shows the shrinkage curve ofthe Chalmers soil from the first experiment (experiment 1). The shrinkage curve is presented inspecific volume, 1/ρd (cm3/g), as function of w.Figure 2. The shrinkage curve of the Chalmers Soil from experiment 1.5
Comparison with Topp’s EquationFigure 3 shows a comparison between the non-calibrated TDR readings ( TDR and wTDR: usingTopp’s Equation) and the real gravimetric (wReal) and volumetric ( Re al ) water contents forexperiment 1 as obtained by the shrinkage curve. It is clear from Figure 3 that the TDRpredictions ( TDR and wTDR) were not very representative of the real water content of the soilspecimen ( Re al and wReal). The main reasons behind the differences in the water contents are:(1) the relatively high clay content of the soil causing dielectric dispersion or change inpermittivity as function of frequency (Saarenketo, 1998, Ishida and Makino, 1999, Chen and Or,2006, Robinson et al., 2008), (2) the high shrinkage range of the soil (ρd increased from around1.30 g/cm3 to 2.0 g/cm3as the soil dried from wReal 40.01% to wReal 6.75%), and (3) theempirical nature of the Topp’s equation (Topp et al., 1980).wReal: real gravimetric water content obtained by backcalculation of weighing balance readings; TDR : volumetric water content as obtained from TDR. Topp : Application of Equation 1 to obtain volumetricwater content using Ka values; Re al : Obtained by multiplying W Real by the bulk density(Equation 3 assuming ρw 1);wTDR,Topp: gravimetric water content obtained from theTopp’s equation and bulk density (Theta Topp’s/bulkdensity).Figure 3. Comparison between the non-calibrated TDR readings and the real gravimetric(kg/kg) and volumetric (m3/m3) water content values as estimated by the shrinkage curveexperiment.The objective of this study is to improve the predictability of TDR equipment for the watercontent of swelling soils. Thus, the coefficients of the Topp’s equation (Equation 1) werecalibrated through optimization that minimizes the sum of the square of the error between thereal and predicted volumetric water content (Equation 4.a). Similar empirical form of the Toppequation was obtained for the gravimetric water content as function of Ka by minimizes the sumof the square of the error between the real and predicted gravimetric water content (Equation4.b). Figure 4 shows a comparison between the calibrated TDR readings and the real6
gravimetric and volumetric water content values showing an excellent fit between the real andthe four-parameter Topp’s equation (after calibration). TDR,calibrated 9.79 10 2 5.01 10 4 k a 1.84 10 3 k 2a 4.56 10 5 k 3aEquation 4.a 2 2 3 2 5 3wTDR,calibrated 9.55 10 1.18 10 k a 1.7 10 k a 3.3 10 k aEquation 4.bGravimetric Water Content (g/g)60 Re al : Obtained by multiplying W Real by the bulk density(Equation 3 assuming ρw 1);Theta Topp Calibrated: Application of optimization toderive soil specific parameter of Equation 1 to obtainvolumetric water content using Ka values;WReal: real gravimetric water content obtained by backcalculation of weighing balance readings;W Topp Calibrated: gravimetric water content obtainedfrom Theta Topp Calibrated and ρd (Theta Topp’s/ ρd).50403020100051015202530Time (Days)theta RealTheta Topp CalibratedWRealW Topp CalibratedFigure 4. Comparison between the calibrated TDR readings and the real gravimetric (kg/kg)and volumetric (m3/m3) water content values as estimated by the shrinkage curve experiment.Comparison with Siddiqui and Drnevich EquationIn addition to comparison with the Topp’s Equation, the Siddiqui and Drnevich Equation wasutilized in two ways: (1) using a single value of ρd obtained from the shrinkage curve and (2)using the real ρd as function of w.First, the a and b parameters of Equation 2 were obtained by minimizing the square of the error(wReal - wTDR Single BD)2 using the Microsoft Excel optimization solver assuming constant value ofbulk density. An interesting observation was that the optimized values of wTDR Single BD followedthe same curve irrespective of the choice of ρd (or BD). However, the a and b parametersdecreased as ρd increased (or wReal decreased). Table 1 shows the results of the a and bparameters for three ρd values taken at wReal 40%, 20% and 6.75%. Figure 5 shows a7
considerable improvement in the predictability of the water content using Equation 2 (forexperiment 1). However, error (wReal- wTDR Single BD)2 was still within five water content percentagepoints over a considerable portion of the experimental range.Table1. Variation in the a and b parameters for experiment 1.abAssumingconstant ρd atWReal 40%1.455.79Assumingconstant ρd atWReal 20%1.124.45Assumingconstant ρd atWReal 6.75%1.034.10Assuming dynamicρd as predicted bythe ShC0.607.56Further improvement of TDR prediction using the Siddiqui and Drnevich Equation was achievedby solving for a and b after substituting the corresponding value of ρd (function of w) to obtaingravimetric water content predictions using Ka, ρd, and calibrated a and b values (wTDR ShC). Thea and b were also obtained by minimizing the square of the error (wReal- wTDR ShC)2 (Table 1).Figure 5 shows an excellent match between wReal and wTDR ShC. This shows the importance ofthe shrinkage properties of soils in predicting the water content using the two-parameterSiddiqui and Drnevich Equation 2. Statistically, the coefficient of determination, R2, improvedfrom 0.9664 to 0.9846 when changing from single bulk density value to a variable value that is afunction of w. Similarly, the mean absolute error improved from 1.50 to 0.85 percentage pointsfor gravimetric water contents when changing from single bulk density value to values asfunction of w.To demonstrate the uniqueness of this approach for a given soil type, the analysis performedfrom the first experiment (experiment 1) was tested on experiments 2 and 3 using theparameters from experiment 1. Here, uniqueness is defined as the repetitiveness of theobtained parameters from one experiment to the others if the same soil type is used. Resultswill be discussed in the next section.DiscussionResults of the second and third experiments were analyzed similar to experiment 1 (the threeexperiments utilized three replicates of the same soil). Results were first analyzed with thecomplete dataset for each experiment. The shrinkage process changes quickly at high watercontents and becomes very slow at low water contents (Figure 2). This means that all thedatasets in the three experiments have more data points per unit of wReal at low water contentsand this may affect the results of the optimization process, whether calibrating for the soilspecific four parameters of the Topp Equation or for a and b for the Siddiqui and DrnevichEquation. Thus, to provide a uniform distribution of the dataset across the range of watercontents, datasets were rearranged by considering only one representative data point for eachhalf percentage point of wReal.The uniqueness of this method was tested by substituting the values of a and b obtained forexperiment 1 to experiments 2 and 3. Figure 6 shows a comparison between wReal andwTDR ShC. An excellent match between wReal and the predicted wTDR ShC is observed for the threeexperiments based on using the a and b values of experiment 1. However, it was observed thatat wReal values higher than 39%, the wTDR ShC consistently over-predicted wReal. This means thatabove a certain threshold value of wReal, Equation 2, or the procedure adopted in this analysis,fails to predict the gravimetric water content of the soil. Thus a physical meaning for the8
threshold wReal value needs to be established or else the predictability of water content byEquation 2 may not be unique or reliable.wTDR ShC: Calibrated Siddiqui and Drnevich TDRreading estimate using dynamic bulk densityvalue as predicted by the shrinkage curve.wTDR Single BD: calibrated Siddiqui and DrnevichTDR reading estimate using single bulk densityvalue in Equation 1.Figure 5. The performance of the Siddiqui and Drnevich Equation in estimating Wdemonstrated through a comparison between W Real and W TDR SingleBD (as estimated by Equation2 and a single bulk density value) and W TDR ShC (as estimated by Equation 2 and a dynamic bulkdensity value) for experiment 1.Figure 6. Results of the three experiments showing the effectiveness of accounting for thechange in the soil bulk density in improving TDR predictions. The a and b of experiment 1 wereused for experiment 2 and experiment 3.9
The search for a physical explanation to the threshold value above which Equation 2 overpredicts wReal triggered the attention towards the shrinkage curve. By mapping the shrinkagecurve over wReal vs. wTDR ShC, it was observed (Figure 7) that the same threshold value abovewhich wTDR ShC over predicts wReal is the air entry point of the macro structure in the shrinkagecurve (as explained by Braudeau et al., 2004). This point is defined when the slope of theshrinkage curve becomes less than one thus implying that the soil is no more at saturation.Physically, it means that the change in volume of the soil is less than the change in wReal withsome of the pores filled with water becoming filled with air (instead of being totally lost to volumechange). For TDR, this means that Equation 2 may best predict the gravimetric water content ofthe soil when the soil is at or below the saturation limit. At much higher water contents, the soilmay act as a slurry more than a soil and it is assumed that this is the reason why TDR overpredicted the water content in that range.Range of W belowwhich TRD canhighly predict WRealusing Equation 1.Range of W above which TRDover predicts WReal. This pointhappens to be the air entrypoint in the Shrinkage curve,i.e. the point above whichshrinkage curve has a slopeequal to 1.Figure 7. The use of the Shrinkage Curve to define threshold for TDR predictability.Relevance to the IndustryRelevance to industry comes through incorporating the effect of the soil structural interactionsby accounting for the soil dynamic shrinkage/swelling behavior in the calculation of the soil bulk10
density. This can be achieved by allowing users to enter the unique shrinkage/swelling curveparameters as part of the input in the TDR equipment. This however requires one further stepthat is to translate the x-axis of the shrinkage curve from wReal to Ka. The reason is that TDRmeasures Ka directly and infers TDR or wTDR by relating Ka to the volumetric or gravimetricwater content through Equations 1, 2, and/or 3. Thus, the TDR equipment would require allmodels to be a function of Ka rather than w or . Moreover, accounting for volume changeimproved the predictability of the gravimetric water content by the TDR equipment simplybecause Equation 2 contained the bulk density term (which makes it more physically based thanTopp’s Equation which is totally empirical). Accordingly, incorporating volume change propertiesof the soil in TDR equipment requires mapping the soil shrinkage/swelling properties into aunique relationship with Ka as demonstrated in Figure 8.It is proposed that this research be extended to the swelling direction. This can be achieved byslightly modifying the experimental procedure by allowing for adding water to a dry soilspecimen, and again taking TDR and electronic balance readings at fixed time intervals. In allcases, shrinkage/swelling behavior can be incorporated into the new TDR equipment by relatingthose properties to Ka for a given soil and include them in the calculations for the nextgeneration of TDR equipment.Figure 8. Shrinkage Curve as function of Ka instead of W Real.Predicting the Shrinkage CurveGravimetric and volumetric water contents interact in a unique relationship (Equation 3) that canbe re-written as:w w 1 d SpecificVo lumeEquation 511
Thus, if w and can be predicted by the TDR, then the specific volume of the soil can becalculated using Equation 5.To test this hypothesis, five points from experiment 3 were considered (Table 2). The values forw and vs. Ka were used to construct a cubic polynomial constitutive relationship similar inform to the Topp’s Equation (Figure 9). This allows for the prediction of w and for every valueof Ka as explained in Equations 6 and 7: TDR,Calibrated 9.6 10 2 4.3 10 3 k a 2.7 10 3 k 2a 7.0 10 5 k 3aEquation 6 2 4 3 2 5 3W TDR,Calibrated 4.15 10 2.00 10 k a 1.1 10 k a 2.0 10 k aEquation 7Using Equation 5, estimates of the specific volume of the soil in experiment 1 were plottedagainst the gravimetric water content (i.e. the shrinkage curve) and compared to the realshrinkage curve of experiment 1 (Figure 10). Although results are not a perfect match, the factthat such an estimate of shrinkage curve of experiment 1 was obtained from calibration of fivedata points of a different soil replicate (experiment 3) make this method a promising tool toestimate the bulk density of the soil, and definitely an application worth considering for TDRequipment.Figure 9. Calibration of the gravimetric and volumetric water content predictions using Topp’slike polynomial equations estimated from five experimental points in experiment 3.12
Figure 10. Comparison between the real shrinkage curve of experiment 1 and the predictedcurve based on calibrated gravimetric and volumetric water content predictions using Topp’slike polynomial equations estimated from only five experimental points in experiment 3.Table2. Five data points from experiment 3 used to estimate theshrinkage curve of experiment 1.Point12345KaWReal Re 620.813.9ConclusionTDR equipment provides accurate predictions of the soil volumetric and gravimetric watercontent through direct measurement of the apparent dielectric constant of the soil, Ka.Experimental evidence was provided to demonstrate the effect of soil shrinkage on improvingthe accuracy of water contents from TDR measurements. Direct water content calculation forthe Chalmers soil was compared to TDR readings with and without shrinkage correction andshowed considerable improvements in soil moisture by accounting for soil shrinkage. This workprovides experimental evidence on the importance of incorporating the volume change behaviorof soils into TDR equipment for improving the predictability of volumentric water content ( ) orgravimetric water content (w) as follows:13
1. Comparison between direct measurements of or w and indirect measurements usingTDR’s factory built-in parameters showed unsatisfactory accuracy for swelling soils.2. Improving the predictability by solving for soil-specific parameters assuming a single bulkdensity value (thus no volume change) showed considerable improvement, but errors upto five water content percentage points at high and low extremes i
moisture contents and allows for estimating the shrinkage curve. Direct water content calculation for the Chalmers soil was compared to water contents from TDR readings with and without shrinkage corrections; those with shrinkage corrections showed significantly improved accuracy in TDR-determined soil moisture. Keywords.