Transcription
IJCSI International Journal of Computer Science Issues, Vol. 9, Issue 6, No 1, November 2012ISSN (Online): 1694-0814www.IJCSI.org202Trading Signal Generation Using A Combination of ChartPatterns and IndicatorsChalothon Chootong and Ohm SornilDepartment of Computer Science, National Institute of Development AdministrationBangkok, ThailandAbstractChart patterns and indicators are popular technical tools formaking investment decisions. This article presents a tradingstrategy combining price movement patterns, candlestick chartpatterns, and trading indicators, including Moving Average,Exponential Moving Average, Bollinger Bands, On BalanceVolume, Relative Strength Index, Moving Average ConvergenceDivergence, and Stochastic Oscillator, with the aim to increasethe return on investment. A neural network ensemble isemployed to determine buy and sell signals on the next tradingday. Experimental results, using stocks from five differentindustries in Stock Exchange of Thailand, show that the proposedstrategy yields higher returns than do traditional technical tradingmethodsKeywords: Stock Trading Signals, Chart Patterns, CandlestickCharts, Indicators, Neural Network Ensemble1. IntroductionAn investment decision may increase or decrease thereturn on investment. Information and investors’ experiencesare significant factors to successful stock trading.Fundamental analysis and technical analysis are two mainapproaches which form the basis of most traders’ decisions.Fundamental analysis involves economic, political anddetailed studies of companies’ financial positions. Tradersapply this approach to price predictions over a long periodof time. Technical analysis [10] focuses on price andvolume movements of stocks. Typically, traders useindicators, such as Moving Average, Bollinger Band,Relative Strength Index, Moving Average ConvergenceDivergence, and Stochastic Oscillator, to determine buyand sell signals. In addition, they may use chart patterns,such as price movement patterns and candlestick chartpatterns, to analyze the past trading data and predict futureprices and trends.Artificial Intelligence has been used in finance andinvestment and supported decisions by analyzing largeamount of data [14], such as managing portfolios foroptimal resource allocations [5], predicting prices andtrends, and determining trading signals which is the focusof this article. Abraham et al. [1] proposed a hybridintelligent system based on an artificial neural networktrained by scaled conjugate algorithm and a neuro-fuzzysystem for stock market analysis. Wen [13] proposed anintelligent trading system based on oscillation boxprediction by combining stock box theory and supportvector machine algorithm. The paper consists of two parts:one part is to predict the future trend or price, and theother is to construct a decision support system which cangive certain buy/sell signals.A neural network is an interconnected set of elementswhich can learn a nonlinear relationship between inputfeatures and the output, from a set of training patterns [2].It has a number of applications in financial decisionmakings, such as predicting market trends, and isconsidered to give higher accuracy than many modelingtechniques [15]. Zhang and Coggins [8] evaluate afinancial time-series forecasting strategy using multiresolution properties of the wavelet transform and a neuralnetwork model, trained using Bayesian techniques. Kumaret al. [12] use neuro fuzzy based techniques to predictstock trends.Stock chart patterns are major tools for stock markettechnical analysis. Chart pattern analysis can helpinvestors improve trading profits in both short-term andlong-term investments [16]. Two popular types of chartpatterns are line (or price movement) chart patterns andcandlestick chart patterns. Examples of price patterns arethe head-and-shoulder pattern which suggests the fall ofprice, and the double top pattern which describes the riskof a stock [4]. Chart patterns provide hints for investors tomake buy or sell decisions.Candlestick chart patterns have been recognized as goodindications of stock price. They can be used to createtrading rules. Izumi et al. [11] propose a new approach todevelop stock trading strategies using Genetic NetworkProgramming (GNP) and candlestick charts. GNP consistsof several judgment nodes and processing nodes. In a GNP,judgment nodes check candlestick chart patterns, andprocessing nodes suggest buying or selling stocks. A chainof judgment nodes, and the following processing nodesexpress the buying/selling strategy.Copyright (c) 2012 International Journal of Computer Science Issues. All Rights Reserved.
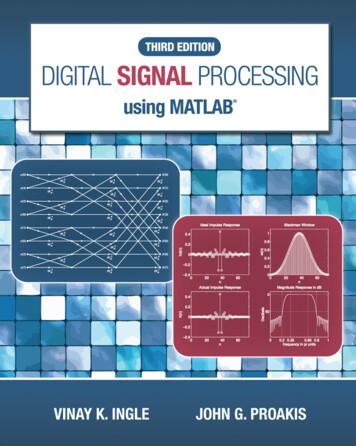
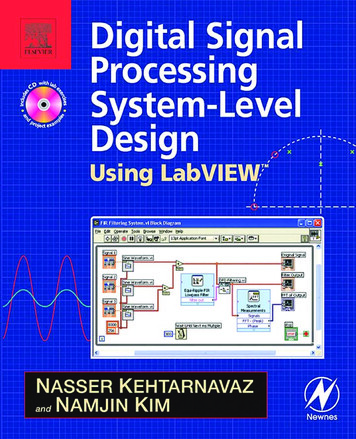
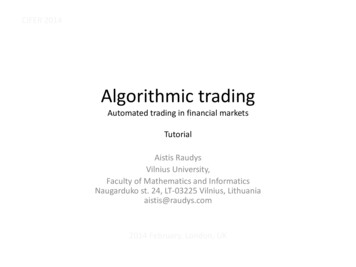
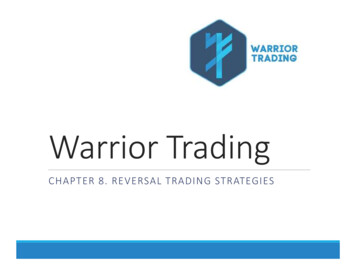
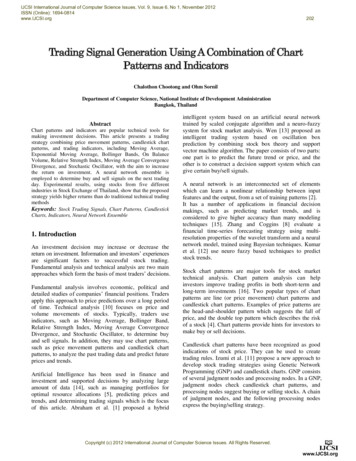
IJCSI International Journal of Computer Science Issues, Vol. 9, Issue 6, No 1, November 2012ISSN (Online): 1694-0814www.IJCSI.org203This article presents a novel strategy that provides tradingsignals using a neural network ensemble to combinetechnical indicators, price movement patterns, andcandlestick chart patterns. The method is evaluated usingactual data from the Stock Exchange of Thailand.candlestick, which is a reversal pattern that shows up aftera pullback, and Fig.2 (b) shows a bearish candlestickwhich is opposite to the bullish pattern. If it is not a bullishor bearish candlestick, it is considered a neutralcandlestick.In the rest of the article, Section 2 provides backgroundsof price movement patterns, candlestick chart patterns, andtechnical trading indicators. Section 3 describes thestrategy to combine features from both chart patterns andindicators. Section 4 describes experiments and results.Section 5 provides concluding remarks of the research.There are many candlestick chart patterns normally used intrading. This research divides candlestick chart patternsinto three main types as follows: Bullish candlestickpatterns, which are reversal patterns that show up a after apullback, i.e., the closing price is higher than the openingprice. Bearish candlestick patterns which are opposite tothe bullish pattern, i.e., the opening price is higher than theclosing price. These patterns come after a rally and signifya possible reversal just like the bullish patterns. If it is nota bullish or a bearish candlestick, it is a Neutralcandlestick pattern. Each pattern type is divided furtherinto three subtypes which are high reliability, mediumreliability, and low reliability.2. Chart Patterns and Trading Indicators2.1 Price Movement PatternsPrice movement patterns can be used to identify pastrelationships from historical data and applied them topredict future prices [21]. In stock trading, pricemovement studies play an important role in technicalanalysis. They show reversal or continuation of price andput all buying and selling into perspective by consolidatingforces of supply and demand into a concise picture.Examples of price movement patterns are shown in Fig. 1.(a)(a)Bullish candlestick(b)Bearish candlestickDouble top patternFig. 2 Candlestick charts(b)Head and shoulders patternFig. 1 Examples of price movement patterns2.2 Candlestick Chart PatternsCandlestick charts display open, close, high and low prices,of a time frame, and also show upward or downward ofprices and the range of time frame. A candlestick consistsof three main parts: upper shadow, real body, and lowershadow, as shown in Fig.2. Fig.2 (a) shows a bullishFig. 3 Bullish concealing baby swallow patternCopyright (c) 2012 International Journal of Computer Science Issues. All Rights Reserved.
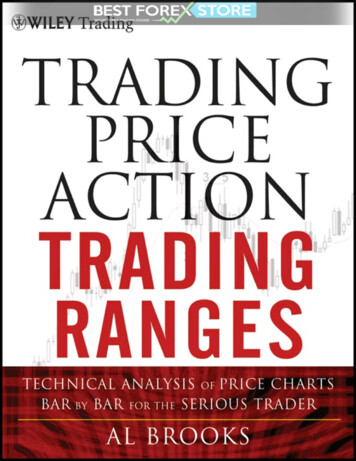
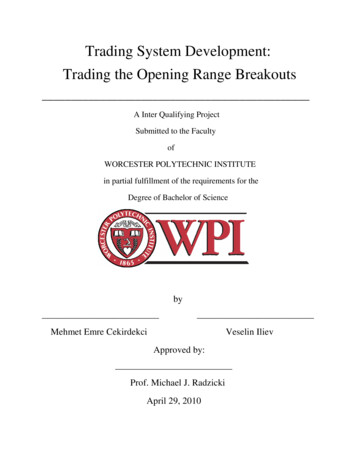
IJCSI International Journal of Computer Science Issues, Vol. 9, Issue 6, No 1, November 2012ISSN (Online): 1694-0814www.IJCSI.org204where 𝐸𝑀𝐴𝑡 is EMA of the current day t, 𝐸𝑀𝐴𝑡 1 isEMA of the previous day, 𝑆𝐹 is the smoothing factor, and𝑃𝑡 is the current price, and n is the number of days.Relative Strength Index (RSI): RSI was invented byWelles Wilder [19] It is a calculation of the total numberof days at a higher price multiplied by the price change,compared with the sum of the absolute values of pricechanges. It can be calculated as:Fig. 4 Bearish dragonfly doji patternRSI 100-(1001 𝑅𝑆𝑅𝑆𝐴𝑈) 100 (1 𝑅𝑆 ); RS 𝐴𝐷where AU is the total upward price change during the pastn days, and AD is the total downward price change duringthe past n daysFig. 5 Neutral high waveFig. 3 shows the bullish concealing baby sallow pattern.This pattern is highlighted by two consecutive blackMarubozus in the first and second. The two blackMarubozus show that the downtrend is continuing to thesatisfaction of the bears. The reliability of this pattern isvery high, but still a confirmation in the form of acandlestick with a higher close or a gap-up is suggested.Fig. 4 shows a bearish dragonfly doji pattern which is asingle candlestick pattern and occurs at a market top orduring an uptrend. A neutral high wave is shown in Fig. 5,which is a type of candlestick characterized with either avery long upper or a lower shadow. It has only a short realbody. A group of these patterns may signal a market turn.2.3 Technical IndicatorsIn trading, indicators are tools for providing buy, hold, andsell signals. Many indicators are used in stock trading,including:Moving Average (MA): MA is widely used because it issimple to understand and use. It sums up stock prices overan n-day period then divides it by n, MA at the current dayt can be calculated as:MAt 𝑃𝑡 𝑃𝑡 1 𝑃1 𝑛 1𝑛 𝑛𝑖 1 𝑃 𝑡 𝑖 1𝑛, n i.Exponential Moving Average (EMA): EMA was a typeof moving average that is similar to the simple movingaverage, except the average is weighted to place theemphasis on the most recent price action.EMAt EMAt 1 SF(Pt EMAt 1 )Bollinger Band (BB): BB is developed by John Bolinger[19]. It is a technical tool to show the state of the market.It is a signal that moves around the moving average line.Middle Band 20-day MAUpper Band 20-day MA ( 20-day standarddeviation of price x 2)Lower Band 20-day MA – (20-day standarddeviation of price x 2)On Balance Volume (OBV): OBV shows a correlationthat includes the amount of volume coming with a pricechange, multiplied by the sum of the turnover, comparedto the total volume in the period. The result will be eitherpositive or negative because price changes may increase ordecrease, depending on the product of the volume of theday.OBV (t, n) sign ct i𝑛 1𝑖 0 𝑠𝑖𝑔𝑛𝐶 𝑡 𝑖 𝐶 𝑡 𝑖 1 𝑥 𝑉(𝑡 𝑖)𝑛 1𝑖 0 𝑉(𝑡 𝑖) ct i 11 ,if Positive numbernumber { 1 ,if Negative}where sign is a function that returns the sign of itsargument (1 for a positive number and -1 for a negativenumber), V(t) is the volume of the day t, ct is today’sclosing price, and n is numbers of days in a period.Moving Average Convergence Divergence (MACD):MACD suggests trends of overbought, oversold, anddivergence. Overbought is a state of a very matureuptrend, and oversold is a state of saturated sales. MACDis calculated by the difference between two EMA lineswhere one line is from a longer period of time than theother.Copyright (c) 2012 International Journal of Computer Science Issues. All Rights Reserved.
IJCSI International Journal of Computer Science Issues, Vol. 9, Issue 6, No 1, November 2012ISSN (Online): 1694-0814www.IJCSI.orgMACD 12-day EMA - 26-day EMASignal Line 9-day EMA of MACD LineMACD Histogram MACD Line – Signal LineMACD histogram represents a difference between MACDand its signal line. A histogram is positive when theMACD line is above its signal line and negative when theMACD line is below its signal line.Stochastic Oscillator: Stochastic oscillator was presentedby George Lane [19] in 1950s. It compares the differenceof the closing prices between highest and lowest prices ina short period of time. It is a good indicator to determineoverbought and oversold levels. %K and %D are theresults from the stochastic method, such as the followingequations:C t L t (m)R t (m)%K 100CtLt(m)Rt(m), %D ( ti t n %K)n today (day t)’s closing price the low price of the last 5 days the price range of the 5 days (difference of thehighest price and price and the lowest price.3. Combining Chart Patterns and TradingIndicators205𝜓 𝑥 𝑘 𝑍 𝑏𝑘𝜑(2𝑥 𝑘)Wavelet transformation decomposes time series intodifferent components. Capobiacnco [6] applies waveletmethods to the multi-resolution analysis of high frequencyNikkei stock index data and the matching pursuitalgorithm of Mallate [1], and argues that it suitsexcellently to financial data. Coefficients of the analysisare then used to represent the price movement pattern ofeach window.Due to the large number of coefficients, Singular ValueDecomposition (SVD) is applied to reduce the number offeatures from WMRA by compressing them into a lowerdimensional feature space [20]. SVD decomposes matrix Ainto three components: an orthogonal matrix of singularvalues, where r min (m, n), and the left and the rightsingular vectors (i.e., U and V, respectively), as show inFig. 6.By keeping k r largest values of the singular matrix alongwith their corresponding columns in U and V, the resultingmatrix is the matrix of rank k which is closest to theoriginal matrix A in the least square sense. With respect tothis new space of k dimensions, the attributes are no longerindependent from each other.In this research, the price movement pattern, thecandlestick chart pattern, and a set of trading indicators arecombined to determine a stock trading signal.3.1 Representing Price Movement Chart PatternsTo capture price movement patterns, wavelet multiresolution analysis (WMRA) [18] is performed to slidingwindows of daily prices. WMRA implicates a hierarchicalsequence of nested subspaces 𝑉𝑗 of the function space V(i.e., 𝑉𝑗 𝑉𝑗 1 ) which imply intersections anddense closures L2(R) [12]. It is a decomposition in severalresolution levels that requires a two-scale relation such as𝑥 𝑉𝑗 𝑓(2𝑥) 𝑉𝑗 1 . A finer space 𝑉𝑗 is extendedby integer translates of the scaled function 𝜑(2𝑗 x-k).Scaling by 2𝑗 provides the basis functions for the space 𝑉𝑗 ,and the nestedness of the spaces 𝑉𝑗 yields a scalingequation:𝜑 𝑥 𝑘 𝑍 𝑎𝑘 (2x-k)where 𝜑 is
Candlestick chart patterns have been recognized as good indications of stock price. They can be used to create trading rules. Izumi et al. [11] propose a new approach to develop stock trading strategies using Genetic Network Programming (GNP) and candlestick charts. GNP consists of several judgment nodes and processing nodes. In a GNP,