Transcription
WhitepaperCongestion Spreading and How to Avoid ItThis document describes how Congestion Spreading (a.k.a., Slow Drain) canimpact your Storage Area Network (SAN), the metrics used to describe theseverity of each type of congestion for both Connectrix B-Series and the MDSSeries as well as preventive measures that can be taken to avoid the effects ofCongestion SpreadingMay 2019Congestion Spreading and How to Avoid It H17762.1 Congestion Spreading and How to Avoid It 2019 Dell Inc. or its subsidiaries.\
RevisionsDateDescriptionMay 2019Initial releaseAcknowledgementsThis paper was produced by the following members of the Dell EMC storage engineering team:Authors:Alan RajapaErik SmithThe information in this publication is provided “as is.” Dell Inc. makes no representations or warranties of any kind with respect to the information in thispublication, and specifically disclaims implied warranties of merchantability or fitness for a particular purpose.Use, copying, and distribution of any software described in this publication requires an applicable software license. Published May 2019: Dell Inc. or its subsidiaries. All Rights Reserved. Dell, EMC, Dell EMC and other trademarks are trademarks of Dell Inc. or itssubsidiaries. Other trademarks may be trademarks of their respective owners.Dell believes the information in this document is accurate as of its publication date. The information is subject to change without notice.
Table of Contents1Preface . 42Overview . 5PREREQUISITES . 53What is Congestion Spreading? . 74Congestion Spreading Due to Oversubscription . 10Application Base Line . 11Generating Application Base Profile Graphs . 114.1.1Brocade . 174.1.2Cisco . 18VMAX UNISPHERE CONGESTION SPREADING ALERTS. 19CONCLUSION . 245Remediation . 25PREVENTION . 25Bandwidth Ratio . 25Implement Bandwidth Limits . 266Appendix . 28ENABLE PERFORMANCE MONITORING . 28CONNECTRIX CONGESTION SPREADING MONITORING. 306.1.1Brocade . 306.1.2Cisco . 356.1.3Dell EMC . 436.1.4Brocade . 436.1.5Cisco . 446.1.6Oversubscription . 456.1.7Brocade . 466.1.8Cisco . 47
Connectrix Congestion Spreading1PrefaceThis document describes how Congestion Spreading (a.k.a., Slow Drain) can impact your StorageArea Network (SAN), the metrics used to describe the severity of each type of congestion for bothConnectrix B-Series and the MDS-Series as well as preventive measures that can be taken toavoid the effects of Congestion Spreading.As part of an effort to improve and enhance the performance and capabilities of its product line,Dell EMC from time to time releases revisions of its hardware and software. Therefore, somefunctions described in this document may not be supported by all revisions of the software orhardware currently in use. For the most up-to-date information on product features,refer to your product release notes.If a product does not function properly or does not function as described in this document, pleasecontact your Dell EMC representative.AudienceRelatedDocumentationThis TechBook is intended for Dell EMC field personnel, including technology consultants, and forthe storage architects, administrators, and operators involved in acquiring, managing, operating, ordesigning a networked storage environment that contains EMC and host devices.All related documentation and release notes can be found on https://dell.com/support. ClickSupport by Product, input the product name and click Documentation.EMC Support Matrixand E-LabInteroperabilityNavigatonFor the most up-to-date information, always consult the EMC Support Matrix (ESM), availablethrough E-Lab Interoperability Navigator (ELN) at http://elabnavigator.EMC.comWhere to get helpDell EMC support, product, and licensing information can be obtained on the Dell EMC OnlineSupport site as described next.Note: To open a service request through the Dell EMC Online Support site, you must have avalid support agreement. Contact your Dell EMC sales representative for details about obtaininga valid support agreement or to answer any questions about your account.Product informationFor documentation, release notes, software updates, or information about Dell EMC products,licensing, and service, go to the Dell EMC Online Support site (registration required) at:https://www.dell.com/supportTechnical supportDell EMC offers a variety of support options.Support by Product — Dell EMC offers consolidated, product-specific information on the Web at:https://support.dell.com/productsThe Support by Product web pages offer quick links to Documentation, White Papers, Advisories(such as frequently used Knowledgebase articles), and Downloads, as well as more dynamiccontent, such as presentations, discussion, relevant Customer Support Forum entries, and a linkto Dell EMC Live Chat.Dell EMC Live Chat — Open a Chat or instant message session with a Dell EMC Support Engineer.eLicensing supportTo activate your entitlements and obtain your license files, visit the Service Center onhttps://dell.com/support, as directed on your License Authorization Code (LAC) letter e-mailed toyou.4 Technical White paper
Overview2OverviewThe goal of this white paper is to:1. Describe how Congestion Spreading (a.k.a., Slow Drain) can impact your Storage Area Network (SAN),2. Define the metrics used to describe each severity and type of congestion for both Connectrix B-Seriesand MDS-Series products,3. Describe the preventive measures that can be used to avoid the effects of Congestion Spreading, and4. Demonstrate how to use the above information to detect, prevent and remediate Congestion Spreadingdue to oversubscription.PREREQUISITESPlease Note:This document assumes the following software versions are in use. The steps may differ in older versions.Please refer to the Appendix for details that describes how to enable the features required.1. Unisphere for VMAX/PowerMax is installed and running and the array has been registered to collectperformance data.https://support.emc.com/products/27045 Unisphere-for-/Documentation/?source promotion2. SAN Management GUIs are installed.a. For Brocade Fabrics: Connectrix Manager Data Center Edition (CMCNE) 14.x or t CMCNE%2014&searchLang en US&facetResource DOWNAdmin Guide:https://support.emc.com/search/?text CMCNE%2014%20admin%20guide&searchLang en USb. For Cisco Fabrics: Cisco Data Center Network Manager(DCNM) 10.x or t DCNM%2010&facetResource DOWNAdmin r/products-installation-guides-list.html3. SAN Switch Firmware should be the following:a. Brocade: Fabric O.S 7.4.1d or t Brocade%20FOS%20download&searchLang en US&facetResource DOWNb. Cisco: NX-OS 6.2(13) or t NX-OS%20downloadDell EMC Connectrix Congestion Spreading Technical White paper
Overview4. All necessary performance monitoring licenses are installed.a. Brocade requires a MAPS 04b. Cisco requires DCNM-SAN Server package ger/products-installation-guides-list.htmlc. VMAX/PowerMAX requires a Unisphere eLicense. Refer to page 21 of the following PDFfor more cument/docu88904.pdf6 Technical White paper
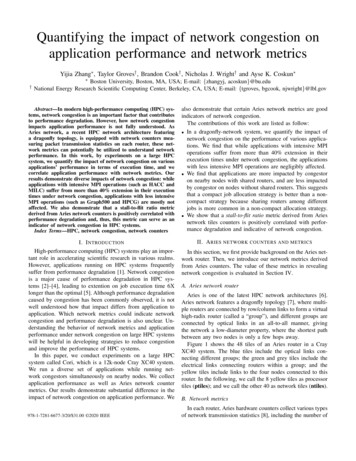
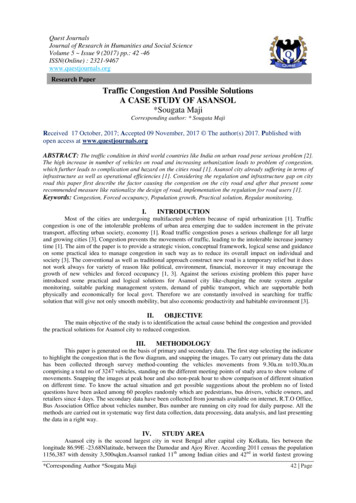
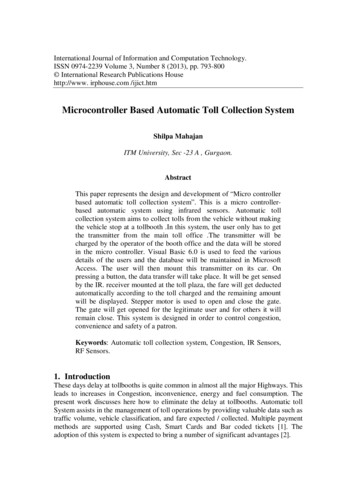
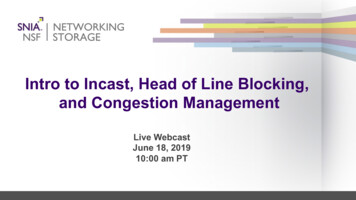
What is Congestion Spreading?3What is Congestion Spreading?Transporting data to and from a storage array requires all data to be delivered to the destination in a timely fashion. Thisis especially true for block-based storage protocols that make use of SCSI (e.g. Fibre Channel - FCP). Although the exactreasons for this are outside the scope of this white paper, more detail can be found in the "Congestion and Backpressure"section of the Networked Storage Concepts and Protocols cpts-prtcls-sol-gde.pdf).Like any other network protocol, Fibre Channel (FC) needs to ensure this timely delivery of data under a wide range ofcommon network congestion situations. The mechanism used by FC focuses on the prevention of frame loss by usingbuffer-to-buffer flow control. Because of this, FC is considered a "Lossless Protocol".Although the flow control mechanisms used by each protocol are slightly different, FC and other Lossless protocols (e.g.,DCB Ethernet and inifiniband) prevent buffer overflow at either end of a link by allowing the transmitter to determine whenthe receiver at other end of the link is nearing capacity. When this determination is made, a port will stop transmitting datauntil the other end of the link indicates it's ready to receive additional data. While a transmitter is in this state, it's unable totransmit frames and we say that it's experiencing congestion. If a transmitter experiences congestion for a long enoughperiod of time, this congestion can propagate backwards towards the source. This phenomenon is known as congestionspreading and an example is shown in the following sequence of diagrams.Figure 1 is an example of a SAN that is not experiencing congestion. Both Host 1 and Host 2 are performing READcommands to the array.Since both the array and host are attached at 16Gbps and there is sufficient ISL bandwidth (i.e., 32G), there is nocongestion in the SAN.Figure 1 No CongestionFigure 2 shows an example of a SAN that is experiencing Congestion Spreading due to Oversubscription. Note that theonly difference between the two figures is that in Figure 3, the interface on Host 1 was set to run at 4Gbps instead of16Gbps. As soon as this is done, if the array interface transmits data at a rate that is anything greater than the speed ofthe attached HBA (i.e., 4G), Host 1 will be unable to receive the data at the rate that’s being transmitted, and theimmediate impact is the queuing of frames. As Queue 1 fills, the congestion spreads back to the source of the data. Sinceboth Host 1 and Host 2 are sharing the same Inter Switch Link (ISL), this congestion impacts the "innocent flow" betweenHost 2 and Storage 2, reducing throughput from 16Gbps to 4Gbps.Dell EMC Connectrix Congestion Spreading Technical White paper
What is Congestion Spreading?Figure 2 CongestionAdditional information about congestion and congestion spreading can be found in the Congestion and Backpressuresection of the Networked Storage Concepts and Protocols cpts-prtcls-sol-gde.pdf).It's important to note that oversubscription is only one of the potential causes of congestion spreading. Other causes willbe explained in the following sections. Congestion Ratio (c ratio)The Congestion Ratio or c ratio is a calculated value that can help detect when congestion spreading is occurring. Forexample, Figure 3 depicts a host (i.e., Host 1) that is capable of receiving data at a rate of 4Gbps but is receiving datafrom a storage interface that is capable of transmitting data at 16Gbps.Figure 3 Congestion RatioPart of what makes these problems so difficult to detect and troubleshoot is that from the perspective of the 4G interfaceon switch 1, everything is fine. The switch interface is transmitting frames as fast as the link allows. However, since thestorage is transmitting data at the rate it’s link allows (i.e., 16Gbps), there is going to be 12Gbps (16Gbps - 4Gbps) ofbandwidth that will be transmitted by the array and will need to be queued somewhere. This queuing typically happens in8 Technical White paper
What is Congestion Spreading?the Fabric and is the cause of Congestion Spreading. As mentioned above, one method that can be used to detect thepresence of Congestion Spreading is to calculate the congestion ratio. To do this, take the "Time Spent at zero transmitcredit" counter and divide it by the Frames Transmitted counter and you will have a number (typically between 0 and 1). Ifthis number is greater than .2, you have congestion. By the way, this number needs to be calculated on a per interfacebasis, so it's probably best just to script the process for checking this value.9 Technical White paper
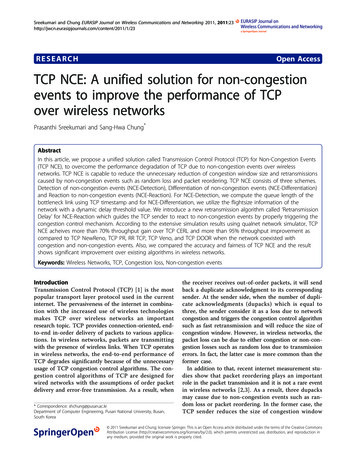
Congestion Spreading Due to Oversubscription4Congestion Spreading Due to OversubscriptionThe following case study is based on congestion spreading due to oversubscription. The topology for this case study isshown in Figure 4 below. In this case study, you will learn about the tools and techniques that are currently available tohelp detect and prevent this issue from occurring.Note: Congestion Spreading is an extremely difficult problem to detect and resolve. This is primarily due to theinability of the current generation of management tools to provide a clear indication that the issue is occurring, letalone providing any guidance on how to actually solve the problem. As a result, troubleshooting these problemsrequires the end user to understand what the problem is, and then know how to use the tools that are currentlyavailable to draw conclusions from the limited data available.Figure 4 Topology of Oversubscription Case Study Scenario:User 1 has had an existing application running on Host 2 (16G HBA) that is running I/O at various block sizes, queuedepths and I/O patterns. This application has been running for a long time in this environment and has not experiencedany issues until recently. Earlier this month, User 2 decided to load an application on Host 1 (4G HBA) for testing. Initiallyeverything was fine in the environment with regards to performance and latency. However, User 1 recently started tonotice performance issues with their application. Troubleshooting Overview:To troubleshoot any problem in general, you must first understand how things perform and are configured when workingin their ideal conditions. As you know, a SAN has many moving parts that make up the ecosystem, so it's very importantto build out an environment profile consisting of profiles for the 3 major components that make up a SAN: Application(s),SAN Fabric and Storage.Building these baseline profiles at various components in your environment will give you the necessary ability to easilypinpoint issues when they arise. It should be noted that these profiles are not a one-time thing. You should constantlygather baseline line data throughout the lifetime of your environment so that you not only troubleshoot issues, but plan forfurther grow and expansion.In the next few sections, we will show that you must gather these baseline statistics from your storage array, so that whenan issue does arise as stated in the scenario above, you are well equipped to find the root cause.10 Technical White paper
Congestion Spreading Due to OversubscriptionApplication Base LineWith Dell EMC VMAX/PowerMax, when you enable Performance monitoring you can go back into your history (up to ayear since enabling the feature) so that you can understand what your application profile was in terms of IOPs andresponse times before any changes were made. Having this application base profile will allow you to use the chartsgenerated and easily determine where there might be issues.Generating Application Base Profile Graphs1. In Unisphere, click on Performance Charts2. Select a Time Frame. This would be any time BEFORE you noticed the performance issue. Under theCategory drop down menu, select Hosts Hosts.11 Technical White paper
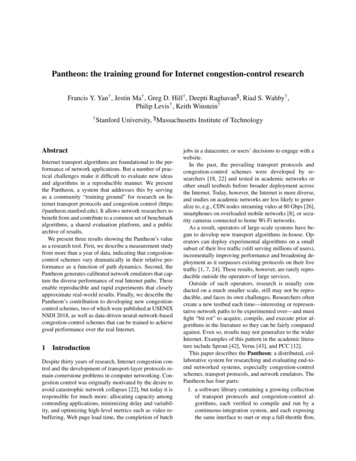
Congestion Spreading Due to Oversubscription3. Select the Host in question. For KPI Metrics we will generate seven (7) different charts. Repeat thissection for each KPI metric. If you click all the metrics at once, the chart will place them in a single graph.a. Host IOs/secb. Host MBs/secc. Host Reads/secd. Host Writes/sece. Read RT (ms)f. Response Time (ms)g. Write RT (ms)In Figure 5, “Host IOs and MBs/secs,”, we are looking at the Host IOs and MBs/sec. From these charts we can see whenand for how long the application has been running the most IOs and utilizing the full bandwidth of the link as well as thelow points.12 Technical White paper
Congestion Spreading Due to OversubscriptionNote: In the legend you will notice there are two hosts but currently we are only showing the IO for one of thehosts because the other host is not doing any IO"Host IOs/secHost MBs/secFigure 5 Host IOs and MBs/secs13 Technical White paper
Congestion Spreading Due to OversubscriptionThe charts shown in Figure 6, “Read and Writes/secs,” provide a breakdown of the type of IO the application generates.Based on these charts, we can determine what percentage of the application IOs are READs versus WRITEs. In this casewe can confirm that the application is about 70/30 in terms of READs/WRITEs.Host Reads/secHost Writes/secFigure 6 Read and Writes/secs14 Technical White paper
Congestion Spreading Due to OversubscriptionFigure 7 and Figure 8 are probably the most useful charts to use when troubleshooting. They provide a breakdown ofresponse times between READs and WRITEs that allows us to understand the latency that the application isexperiencing. This is extremely useful for when we need to troubleshoot performance issues, because if there is a spike inresponse times, we can correlate the spike back to specific events using the previous charts.Read Response Time (ms)Write Response Time (ms)Figure 7 Read and Write RT (ms)15 Technical White paper
Congestion Spreading Due to OversubscriptionResponse Time (ms)Figure 8 Response Times (ms)Now we have an application profile for User 1's app; we know it's about 70/30 Reads/Writes with response times onaverage of 0.7ms with a max of 2.3ms response time.As discussed in the scenario section, we recently added a new host that started a performance issue in the environment,so let’s look at how we can troubleshoot that issue.Since we are having a performance issue in our environment, we will need to implement the features available in the SANthat can help us determine when these types of issues arise.Because we know what our average response times are, based on the application profile, we know that this performanceissue is higher than the expected response times.16 Technical White paper
Congestion Spreading Due to OversubscriptionConnectrix SAN Congestion Spreading AlertsIn this section, we will review the type of congestion events that we reported from the SAN switch side.Please ensure that you have completed enabling these features in the environment per the Prerequisites.4.1.1Brocade1. Ensure that you have at least Top Port Traffic and BB Credit Zero on your dashboard. You can click thewrench in the upper left-hand corner to add them if you do not.Figure 9 CMCNE Dashboard2. When congestion spreading due to oversubscription occurs, as in the example in Figure 9, “CMCNEDashboard”, you will typically see the following alerts in CMCNE dashboard:a. Highly utilized F-Portb. BB Credit ZeroFigure 10 CMCNE Dashboard displaying alerts17 Technical White paper
Congestion Spreading Due to Oversubscription3. The combination of these two events—highly utilized F-port and high buffer-to-buffer credits going zero on theISLs can indicate you have a potential performance issue that needs to be investigated. Refer to the Remediationchapter for steps on what to review.4.1.2Cisco1. In the DCNM dashboard. You should have Top SAN End Ports as a dashlet. If not, you can add it from the dropdown menu. In the Top SAN End Ports, you will see a device(s) reporting to be over 90% utilized. DCNM willhave default thresholds that cause it to flag a port either yellow or red when it starts to exceed the defaultutilization. This alert by itself does not necessarily mean that there is a performance issue in the SAN. We willneed to look for other alerts in the fabrics as well.-2. If you see a highly utilized F port, run the Slow Drain Analysis tool.Click on Monitor— SAN Slow Drain Analysis.3. Run the slow drain analysis tool for 10 minutes. When the report finishes you will notice that there is a largeamount of TxWait counter incrementing during the time when the report was running. The combination of thesealerts and the highly utilized F-port indicates that there is SAN congestion occurring due to oversubscription.18 Technical White paper
Congestion Spreading Due to OversubscriptionThe combination of these two events – highly utilized F-port and high buffer-to-buffer credits going zero on theISLs – can indicate that you have a potential performance issue that should be investigated. Refer to theRemediation section for steps on what to review.VMAX UNISPHERE CONGESTION SPREADING ALERTSIn this section, we will learn how to use the Unisphere for VMAX/PowerMAX to correlate the SAN switch events to thestorage array.Please make sure that you have completed enabling of these features in the environment per the Prerequisites section.1. Use the steps from Generating Application Base Profile Graphs. Generate the same seven (7) charts, addingUser 2’s host into the mix (because that was one of the recent changes in the environment before theperformance issue occurred). Review the data.Keep in mind that our Application Base Profile 70/30 Reads/Writes with average response times of 0.7ms with a maxof 2.3ms response time.In Figure 11 below, when we compare the IOs and MBs/sec, we don't really see an indication of an issue. In fact, if youcompare it to the original base line application chart, we are in fact doing more IOPs.In addition, you can see there are some points where we are getting close to line rate (highlighted below). These pointswill come into play later.19 Technical White paper
Congestion Spreading Due to OversubscriptionHost IOs/sec20 Technical White paper
Congestion Spreading Due to OversubscriptionHost MBs/secFigure 11 Host IOs and MB/secs21 Technical White paper
Congestion Spreading Due to OversubscriptionFigure 12 shows the compare in Reads/Writes between the two servers as you can see there is not muchdifference between the IO profile between the servers at this point.Host Reads/secHost Writes/secFigure 12 Host Reads and Writes/secs22 Technical White paper
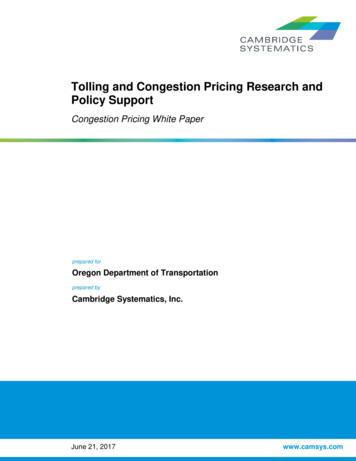
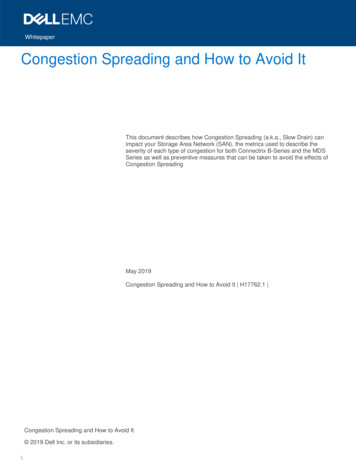
Congestion Spreading Due to OversubscriptionFigure 13 provides the most useful information. Keeping our application profile in mind, we are seeing Response times ofaverage of 0.7ms and max of 2.3ms. From the chart below, we can see that there is a massive spike in response timeswhere we get into the 8ms range, and our overall average response times have increased as well.Looking back at Figure 11, we can see that these high response times correlate back to when the both servers are closeto line rate.Typically, in Fibre Channel, you will need large block IOs (greater than 128k) to saturate a link.Host Read Response Times (ms)Host Write Response Times (ms)23 Technical White paper
Congestion Spreading Due to OversubscriptionHost Response Time (ms)Figure 13 Host Read and Write Response Times (ms)CONCLUSIONTo re-cap all the information we know thus far in this case study: Connectrix SAN:1. Our SAN is reporting high numbers of buffer-to-buffer credits going to zero.2. We are seeing high traffic utilization on our F-port(s). Dell EMC VMAX/PowerMAX:1. High response times during full link utilizationAs stated earlier, congestion due to bandwidth mismatch is extremely difficult to detect and confirm with the set of toolsavailable today. However, based on the above alerts, we can infer the issue is due to bandwidth mismatch and large blockReads/Write. This is indicated by the high response times during full link utilization.Another way to detect this issue is by using the congestion ratio. Today we must calculate this manually in theenvironment (or you can attempt to script it) but we know once your C-ratio is greater than .2, you will experiencecongestion because of the backpressure that is occurring in the SAN environment. The C-ratio would be your firstindication of a slow drain.24 Technical White paper
Remediation5RemediationPREVENTIONFor this specific case study (Congestion Spreading due to Oversubscription) there are a few options you can deploy inyour environment to help prevent this issue from occurring.Bandwidth RatioWhen reviewing the SAN, you want to identify devices that are running at lower speeds and then understand their type ofapplication traffic profiles. Remember, just because you have a bandwidth mismatch, does NOT mean there is necessarilyan issue.Review the fabric end-to-end to ensure all end devices are running at the same link speeds.Ensure ample amount of bandwidth on your ISLs. A good rule of thumb is the total ISL bandwidth should be equal to orgreater than the total amount of storage bandwidth in the fabric where possible.You can modernize your entire SAN by ensuring that you upgrade all components end-to-end as shown in Figure 14below. The con with this approach is that zero oversubscription from end-to-end is impractical in larger environments. Inaddition, it can be very expensive. Therefore, you should just focus on upgrading the specific host, switch and storageconnectivity as well.Figure 14 Modernize25 Technical White paper
RemediationAnother way would be to re-zone as shown Figure 15.Figure 15 Before and After Re-zoningImplement Bandwidth LimitsOn Dell-EMC VMAX and Unity platforms create bandwidth limits on the Storage Groups (VMAX) or the LUNs (Unity). Inthe case study above where we had congestion spreading due to oversubscription when we implemented bandwidth limitswe saw the performance was restored as noted in Figure 16 below. This can be done directly through Unisphere on theStorage group.Figure 16 Host I/O Limited Applied26 Technical White paper
RemediationWith I/O limits, it's important to note that this will not work well with clusters. Let's take Figure 17, below, for example.When the host limit is applied to a 4Gb host that is causing the back pressure, the array starts to limit the amount of data itsends ba
Where to get help Dell EMC support, product, and licensing information can be obtained on the Dell EMC Online Support site as described next. Note: To open a service request through the Dell EMC Online Support site, you must have a valid support agreement. Contact your Dell EMC sales representative for details about obtaining