Transcription
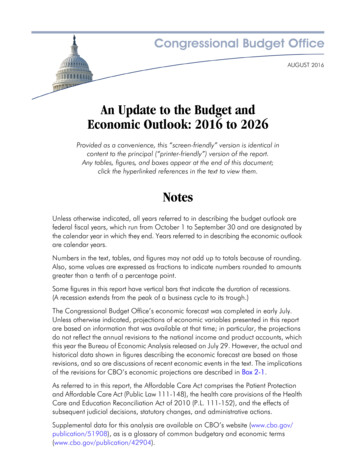
FISCAL YEAR 2020OPERATING BUDGETFiscal Year 2021-2025 Financial ProjectionsNew Route 49Bus Service15 MAX ROUTESA bus or train every 15 minutes or less, 15 hours a day (6AM - 9PM), 5 days per week (M-F)30 MAX ROUTESA bus or train every 30 minutes or less, 15 hours a day (6AM - 9PM), 5 days per week (M-F)60 MAX ROUTESA bus or train every 60 minutes or less, 15 hours a day (6AM - 9PM), 5 days per week (M-F)NewTransitRouteNetwork49 Bus MapIntroducedSoutheastern Pennsylvania Transportation Authority
Government Finance Officers Association of the United States and Canada (GFOA) presented a DistinguishedBudget Presentation Award to Southeastern Pennsylvania Transportation Authority, for its Annual Budget for thefiscal year beginning July 1, 2018. In order to receive this award, a governmental unit must publish a budgetdocument that meets program criteria as a policy document, as a financial plan, as an operations guide, and asa communications device.This award is valid for a period of one year only. We believe our current budget continues to conform to programrequirements, and we are submitting it to GFOA to determine its eligibility for another award.iReturn to Table of Contents
Southeastern Pennsylvania Transportation AuthorityBoard MembersChairmanPasquale T. Deon, Sr.Vice-ChairmanThomas E. BabcockBucks CountyPasquale T. Deon, Sr.Honorable Charles H. MartinChester CountyJoseph E. Brion, EsquireKevin L. Johnson, P.E.Montgomery CountyRobert D. Fox, EsquireHonorable Kenneth Lawrence, Jr.Delaware CountyThomas E. BabcockDaniel J. KubikCity of PhiladelphiaMichael A. Carroll, P.E.Beverly ColemanGovernor’s AppointeeObra S. Kernodle, IVSenate MajorityLeader AppointeeHonorable Stewart J. GreenleafHouse MajorityLeader AppointeeHonorable Marcy ToepelSenate MinorityLeader AppointeeWilliam J. Leonard, EsquireHouse MinorityLeader AppointeeJohn I. KaneSEPTA OfficersGeneral ManagerJeffrey D. Knueppel, P.E.Deputy General Manager TreasurerRichard G. BurnfieldGeneral CounselGino J. Benedetti, EsquireController to the BoardStephen A. Jobs, CPASecretary to the BoardCarol R. LoobyiiReturn to Table of Contents
Return to Table of Contents
Return to Table of Contents
Return to Table of Contents
SEPTA FY 2020 Operating BudgetTable of ContentsPREFACEGFOA Award . iSEPTA Board Members and Officers. iiGeneral Manager’s Memorandum . iiiTable of Contents . vi1. INTRODUCTION AND PROFILESEPTA History. 1SEPTA Service Profile at a Glance . 2SEPTA Rail & Transit Maps . 3Passenger Profile/Customer Satisfaction Ratings . 6Key Regional Transportation Trends . 8Strategic Business Plan . 10Key Performance Indicators . 112. THE BUDGET PROCESSBudget Development . 18Fiscal Year 2020 Calendar . 19Key Activities in the Budget Process . 203. FISCAL YEAR 2020 ASSUMPTIONS & CONSOLIDATED BUDGETAssumptions . 21Fiscal Year 2020 Consolidated Budget . 224. FINANCIAL & BUDGETARY POLICIESFinancial Planning Policies . 23Revenue Policies . 24Expenditure Policies . 25Description of Existing Debt and Debt Service Policies . 25Statement of Changes in Equity. 315. ORGANIZATIONAL STRUCTUREOperating Divisions. 32Operating and Staff Departments . 33Corporate Team Organization Chart . 35viReturn to Table of Contents
SEPTA FY 2020 Operating BudgetTable of Contents6. THREE YEAR COMPARISON FISCAL YEARS 2018 - 2020Consolidated . 36City Transit Division . 37Victory Division . 38Frontier Division . 39Regional Rail Division . 407. FINANCIAL PROJECTIONSSummary of Assumptions . 41Financial Projections of Consolidated Budget . 428. OPERATING REVENUE AND SERVICE PLAN OVERVIEWAnnual Service Plan Overview . 43Revenue Assumptions by Category . 44Ten Year Revenue Trends. 45Summary of Operating Revenue. 469. OPERATING SUBSIDIESSubsidy Allocation and Detail . 47Service Stabilization Fund . 50Detail of Subsidies . 51Summary of Operating Subsidies . 52Detail of Local Subsidies and Other by County . 53Summary of Local Subsidies by County. 5410. OPERATING EXPENSESExpense Assumptions by Category . 55Ten Year Expense Trends . 57Summary of Operating Expenses . 59FY 2020 Budget – Detail of Expenses . 60FY 2020 Budget – Allocation By Company . 61FY 2019 Actual – Detail of Expenses . 62FY 2018 Actual – Detail of Expenses . 63viiReturn to Table of Contents
SEPTA FY 2020 Operating BudgetTable of Contents11. HEADCOUNT AUTHORIZATIONSHeadcount Designations . 64Fiscal Year 2020 Headcount Authorizations . 65Fiscal Years 2016-2020 Headcount Authorization . 67Headcount Authorization Cause of Change . 6912. DEPARTMENTAL SUMMARIES BY DIVISIONCorporate Staff. 72Transit Police. . 78System Safety . 82Operations. 88Vehicle Engineering & Maintenance . 101Engineering, Maintenance & Construction . 112Deputy General Manager/Treasurer’s Staff . 124Finance and Planning . 132Employee Development/Relations . 143Human Resources . 149Procurement, Supply Chain & Disadvantaged Business Enterprise . 156Audit and Investigative Services. 165Customer Experience and Advocacy . 171Office of General Counsel . 177Public and Government Affairs . 18513. SUMMARY OF INTERDEPARTMENTAL EXPENSESFringe Benefits . 192Non-Departmental Expenses . 194CCT Connect ADA and Shared Ride Programs . 195Other Operating Expenses . 19514. SUMMARY OF CAPITAL IMPROVEMENT PROGRAMCapital Sources of Funding. 197Fiscal Year 2020 Capital Budget. 198Fiscal Year 2020-2023 Capital Budget. 199Capital Improvement Program FY 2020-FY 2031 and Beyond. 200Capital Project Impact Analysis. 201GLOSSARYAcronyms . 204Terms . 208viiiReturn to Table of Contents
1. Introduction and ProfileSEPTA’s HistoryGreater Philadelphia has evolved into a vibrant center of economic growth in the country andthe Southeastern Pennsylvania Transportation Authority’s (SEPTA) multi-modal transit systemhas been a catalyst for this development; providing service to three states and giving riders inthe region easy access to work, school, healthcare appointments, recreational outings, andmajor shopping destinations. The policy makers’ commitment to investing in transportation atthe federal, state, and local level has enriched the lives of residents, visitors, and tourists.SEPTA was created by the Pennsylvania GeneralAssembly in 1964 as a solution to the need for aregional approach to transit, which would provideneeded transportation for passengers, shared servicesto reduce expenses and greater access to financialmarkets to help maintainand expand the system.On September 30, 1968,afterfiveyearsofnegotiations,SEPTAacquired the PhiladelphiaTransportation Company.The Philadelphia Transportation Company was created January1, 1940 and was responsible for the operation of buses, trolleys,trackless trolleys, and subway elevated lines: the Market-Frankford line and the Broad Streetline in the Philadelphia area.In 1983, SEPTA was required to take over all operations of Conrail’s passenger railroad to beintegrated with the Authority’s existing transit services. Conrail, which was federally funded, hadoriginally assumed responsibility for the passenger services of the Pennsylvania Railroad andthe Reading Company in 1976. Both railroads went bankrupt due to the decline in the demandfor the transportation of coal, the introduction of superhighways, and the advance of air travel.After a difficult transition and a 108 day strike by Conrail railroad workers, SEPTA’s RegionalRail Division was established. Between Fiscal Years 2012-2016, Regional Rail had outpacedtransit in annual ridership growth and is a critical component in Southeastern Pennsylvania’seconomic engine.INTEGRATING SOUTHEASTERN PENNSYLVANIA’S TRANSIT NETWORK1964Created byPA rtLine1 S E P T A F Y 2 0 2 0 O p e r a t i n g B u d g e tReturn to Table of Contents
1. Introduction and ProfileToday, 55 years after its creation by the PennsylvaniaGeneral Assembly, SEPTA is the nation’s sixth largesttransit system, with a vast network of fixed routeservices including bus, subway, light rail, tracklesstrolley (trolley bus), and Regional Rail, as well as ADAParatransit and Shared Ride programs. This networkprovides service in Bucks, Chester, Delaware,Montgomery, and Philadelphia Counties withconnections into New Jersey and Delaware. SEPTA isalso one of the region’s largest employers, with aworkforce of approximately 9,500 employees.SEPTA SERVICE PROFILE AT A GLANCEFIXEDROUTESREVENUEVEHICLESSTATIONS& RD LINE12182852.0BROAD STREET LINE11252535.5REGIONAL RAIL1339615534.2LIGHT RAIL815967024.4NORRISTOWN HIGH SPEEDLINE126223.1N/A460N/A1.5BUS & TROLLEY BUSADA PARATRANSIT/SHAREDRIDE(in millions)*Exact number varies as new buses are acquired and old vehicles are retired.2 S E P T A F Y 2 0 2 0 O p e r a t i n g B u d g e tReturn to Table of Contents
1. Introduction and Profile3 S E P T A F Y 2 0 2 0 O p e r a t i n g B u d g e tReturn to Table of Contents
1. Introduction and Profile4 S E P T A F Y 2 0 2 0 O p e r a t i n g B u d g e tReturn to Table of Contents
1. Introduction and Profile5 S E P T A F Y 2 0 2 0 O p e r a t i n g B u d g e tReturn to Table of Contents
1. Introduction and ProfileSEPTA PassengersThe following charts serve to illustrate the demographic distribution of SEPTA ridership. Thisdata was recorded and compiled as part of the SEPTA 2018 Customer Satisfaction Survey.The next Customer Satisfaction survey is expected to commence in the Spring of 2020.Age ofAdult Passengers56 to 6515%66 to 755%76 or older1%46 to 5518%18 to 2514%26 to 3527%36 to 4520%Annual Household Income ofPassengers 75 k to 100 k8% 50 k to 75 k17% 100 k or more11% 35 k to 50 k16%Under 15 k18% 15 k to 25 k15% 25 k to 35 k15%6 S E P T A F Y 2 0 2 0 O p e r a t i n g B u d g e tReturn to Table of Contents
1. Introduction and ProfileEthnicity n Americanor BlackWhiteHispanic or LatinoAsian or PacificIslanderOtherNote: In the above chart, percentages total more than 100% as respondents were able to select multipleresponses to this question to more accurately reflect an individual’s racial and ethnic background.Gender ofPassengersMale39%Female61%7 S E P T A F Y 2 0 2 0 O p e r a t i n g B u d g e tReturn to Table of Contents
1. Introduction and ProfileCustomer Satisfaction RatingSEPTA conducted a Customer Satisfaction Survey from April 24, 2018 to May 4, 2018, resultingin 1,542 rider and 400 non-rider interviews (1,942 total respondents). Respondents had theoption of taking the survey online or via telephone interview. Riders provided ratings on a scaleof 0 – 10 and could provide observations on up to 3 modes taken within the last seven daysprior to their interview. A total of 2,840 mode observations were collected. In 2018, the averageoverall SEPTA Modal Performance Satisfaction rating was a 7.3.SEPTA Overall7.3Broad Street Line7.3Market‐Frankford Line7.1City Bus7.2City Trolley7.2Suburban Trolley7.8Suburban Bus7.87.4Regional Rail0.01.02.03.04.05.06.07.08.09.0Note: In the above chart, “SEPTA Overall” score is weighted by mode ridership in order to berepresentative of overall rider population. Due to changes in methodology in how the survey wasconducted, the results were deemed not comparable to previous years’ results.10.0Key Regional Transportation TrendsTransit RidershipTotal ridership has decreased over the past five years due to a number of factors, such asincreased competition, structural changes in ridership patterns, and moderate gas prices.SEPTA RIDERSHIPUnlinked Passenger Trips400.0350.0300.0250.0200.0150.0100.050.00.0FY 07 FY 08 FY 09 FY 10 FY 11 FY 12 FY 13 FY 14 FY 15 FY 16 FY 17 FY 18 FY 19City Transit256.1 269.6 273.9 266.3 277.9 282.2 279.3 271.8 270.7 266.9 252.0 245.8 1.521.622.522.2Regional Rail .2Total307.2 325.2 329.5 321.0 334.0 339.3 337.3 330.2 330.1 326.1 308.3 302.7 292.9Note: Suburban includes both Victory and Frontier Transit Divisions.8 S E P T A F Y 2 0 2 0 O p e r a t i n g B u d g e tReturn to Table of Contents
1. Introduction and ProfileDriving RatesAutomobile use trends underscore the extent to which transit is increasingly becoming a modeof choice for residents of Southeastern Pennsylvania. As transit ridership increases, drivingrates decrease. Historically, the City of Philadelphia and Southeastern Pennsylvania drivingrates have been roughly one-third and two-thirds the national urban average, respectively. Inrecent years, as national driving rates have rebounded with improving economic conditions,local driving rates have remained flat. The most recent miles traveled data available is 2017.Daily Automobile Miles Traveled per Person 822.221.520.6DAILY 810.09.99.79.75PHILADELPHIASOUTH 9419931992199119900SOUTHEASTERN PAUS URBAN AVERAGE9 S E P T A F Y 2 0 2 0 O p e r a t i n g B u d g e tReturn to Table of Contents
1. Introduction and ProfileStrategic Business PlanIn July 2014, the SEPTA Board adopted a five-year Strategic Business Plan for Fiscal Years2015 through 2019. The plan positions SEPTA to evaluate and take advantage of key trendsthat will allow SEPTA to become a public transportation system that meets the region’s evolvingtransportation needs. The plan is available at www.septa.org/strategic-plan and represents aframework for all other SEPTA planning documents, including the Operating Budget. SEPTA iscurrently working on an update to the plan.The framework includes a vision, mission, core values, and strategic objectives to guideorganizational planning and development for the next five years:VISION: To be the region’s preferred choice for transportation, and to earn that choice by: Connecting the region for integrated mobility Sustaining our environment and preserving our system for future generations Committing to continuous improvement and innovation Providing safe, excellent service by a team of dedicated employeesMISSION: SEPTA is dedicated to delivering safe, reliable, sustainable, accessible, andcustomer-focused public transit services, contributing to the region’s economic vitality,sustainability, and enhanced quality of life.CORE VALUES:For our service: Safe Reliable Sustainable Accessible Customer-FocusedFor our people: Diverse Honest Creative Empowered AccountableFor our culture: Collaborative Constructive Respectful Engaging TransparentThese principles serve as a framework for approaches to pursue SEPTA’s eight strategicobjectives in the five-year plan: Safety and Security Rebuilding the System The Customer Experience Ridership Growth Sustainability Business Partnerships Human Capital Development Emerging Technologies10 S E P T A F Y 2 0 2 0 O p e r a t i n g B u d g e tReturn to Table of Contents
1. Introduction and ProfileBalanced Scorecard of Key Performance IndicatorsSEPTA’s Strategic Business Plan establishes a “balanced scorecard” approach to performancemanagement. The Key Performance Indicators (KPIs) are designed to guide strategydevelopment based on a quantitative evaluation of progress during plan implementation. TheKPIs were carefully selected to represent meaningful measures of achievement towardsstrategic objectives across all business units.Progress updates on each KPI are posted quarterly at www.septa.org/strategic-plan.The balanced scorecard has six key focus areas: Safety & Security: develop a safety-first culture Financial Efficiency: responsibly manage resources The Customer Experience: provide best-in-class transportation services Resource Management: implement best management practices State of Good Repair & Reliability: reduce the backlog of capital repair needs Employee Growth: attract, develop, and retain a diverse, healthy, and versatileworkforceSafety & SecurityGoal Statement: to develop a safety-first culture that results in fewer customer and employeeincidents.Employee Lost Time Injuries per 200,000 Work HoursInjuries causing missed work divided by work hours times 200,000FY 2016FY 2017FY 2018ActualActualActualFY 2019FY 4.24.03.83.283.51TotalNote: KPI reporting metrics were revised for FY 2019 to report lost time injury data by the railroad andnon-railroad classification. Based on past trends, the total FY 2020 lost time goal was determined to be3.51. Because of lack of comparative historical data, the FY 2020 goal for railroad and non-railroadclassifications are kept the same as the FY 2019 52020 T TIME RATEEMPLOYEE LOST‐TIME PER 200,000 HOURS11 S E P T A F Y 2 0 2 0 O p e r a t i n g B u d g e tReturn to Table of Contents
1. Introduction and ProfileVehicle, Passenger, and Station IncidentsReported vehicle and passenger incidents per 100,000 miles; reported station incidents per 1,000,000passenger tripsFY 2018 ActualFY 2019 ActualFY 2020 Goal5.215.135.06Vehicle Incidents3.823.713.69Passenger Incidents0.420.530.46Station IncidentsFinancial EfficiencyGoal Statement: to responsibly manage resources in a way that provides requisite budgetstability to grow the system.Operating Expenses per Unlinked Passenger TripGoal: Change in SEPTA is Below Change in Philadelphia CPI-U and Industry CPI-UTotal operating expenses divided by total unlinked passenger tripsFY 2017 ActualFY 2018 ActualFY 2019 ActualOperating Expenses 1,353,073 1,371,790 1,411,366(in thousands)Unlinked Passenger Trips308,300302,700292,857(in thousands)Operating Expenses Per 4.39 4.53 4.82Unlinked Passenger TripFY 2020 Goal 1,485,902300,117 4.95OPERATING EXPENSES PER UNLINKED PASSENGER TRIPSEPTA VS. BENCHMARKSEXPENSE PER TRIP 5.00 4.65 4.95 4.50 4.00 3.78 3.50 3.00PHILA USTRY2020 GoalSEPTA20092008200720062005 2.5012 S E P T A F Y 2 0 2 0 O p e r a t i n g B u d g e tReturn to Table of Contents
1. Introduction and ProfileUnlinked Passenger Trips per CapitaTotal unlinked passenger trips divided by total five county SEPTA populationFY 2016FY 2017FY 2018FY 2019ActualActualActualActualUnlinked Passenger Trips326,100308,300302,700292,857(in thousands)Regional Population4,0964,1194,1284,128*(in thousands)Unlinked Passenger79.6174.8573.3370.94Trips per Capita*Reflects most recent estimated data availableFY 2020Goal300,1174,128*72.70 12010076.1 76.8 0274.972.740202020 003TRIPS PER SE PA RESIDENTUNLINKED PASSENGER TRIPS PER CAPITAOther Measureso New Route Utilization Criteria – As part of the SEPTA FY 2020 Annual ServicePlan, the SEPTA Service Standards and Process was revised to reflect newroute utilization criteria. These criteria reflect a peer review of nearly a dozenlarge transit agencies in North America and metrics from PennDOT’sperformance review. While operating ratio data will still be collected and reportedupon, the evaluation now focuses on passengers per revenue hour (measuringroute productivity) and cost per passenger (measuring route effectiveness). Inaddition, comparative evaluations will be made based on a new routeclassification system, segmented into City, Suburban, Arterial, Expressway,Fixed and Special Purpose. Any route falling in the bottom 15th percentile forboth passengers per revenue hour and cost per passenger will be identified ascandidates for possible evaluation and intervention.A minimum economic performance standard is used for Regional Rail stations. Astation failing to meet this minimum standard will be targeted for evaluation aspart of a future Annual Service Plan. The evaluation will consider the station(s)which have not met the minimum economic performance standard.13 S E P T A F Y 2 0 2 0 O p e r a t i n g B u d g e tReturn to Table of Contents
1. Introduction and ProfileIt will be done in context of the station’s line, adjacent stations, availableamenities including parking, nearby Regional Rail lines, other local SEPTA transitoptions, physical infrastructure constraints or opportunities for service, drivingand non-driving access to the station and nearby stations, trip-time impacts onthe overall line, planned or recent investments and the costs associated withthose investments. Other Financial and Productivity GoalsooooScheduled Service Requirements – 98% or higher of service operating asscheduled.Accessibility by Elderly and Disabled – Achieve 100% of total requests forADA trips (622,000 ADA City Division and 295,000 ADA Suburban Division trips).Vehicle Miles per Employee – 10,593 or more vehicle miles per employee(includes miles in contracted services, Shared Ride, and ADA Paratransit).Administrative-to-Operating Employee Ratio – 1:20 ratio betweenadministrative employees and operating employees. Note: Operating employees includes anyone in the Operations, VehicleEngineering and Maintenance, Transit Police, Engineering Maintenanceand Construction, and System Safety Divisions, Revenue Operations,Training and Development, and Customer Experience and Advocacy.Vehicles per MechanicA key staffing measure that establishes goals based on vehicle types reflecting the varying size,complexity, and condition of each fleetFY 2016FY 2017FY 2018FY 2019FY 2020ActualActualActualActualGoal3.03.13.33.23.0Bus and Trackless Trolley1.81.81.92.01.6City Trolley3.33.43.53.33.5Market-Frankford Line1.91.92.12.12.5Broad Street Line1.51.51.51.51.3Media-Sharon Hill Line2.02.12.02.11.7Norristown High Speed Line1.61.51.51.51.6Regional RailNote: Mechanics assigned to SEPTA’s vehicle overhaul program not included.The Customer ExperienceGoal Statement: provide best-in-class transportation services that meet or exceed customerexpectations.Commendations-to-Complaints RatioTotal customer commendations divided by complaints received through media (mail, e-mail, phone, web)FY 2016FY 2017FY 2018FY 2019FY aintsCommendations-to-Complaints Ratio0.0530.0550.0580.05680.057014 S E P T A F Y 2 0 2 0 O p e r a t i n g B u d g e tReturn to Table of Contents
1. Introduction and ProfileRAILSURFACEService ReliabilityGoal: Varies by ModePercentage of arrivals within 5 minutes, 59 seconds of scheduleFY 2017FY 2018FY 2019ActualActualActualCity/Suburban y Trolley94%93%87%Media-Sharon Hill Line100%98%92%Norristown High Speed Line99%99%99%Broad Street Line97%98%97%Market-Frankford Line78%87%89%Regional RailFY Uptime of Mission Critical IT SystemsPercentage of time during which mission critical communication platforms are fully operationalFY 2017FY 2018FY 2019FY %99.99%Real-Time Application99.76%99.40%99.68%99.99%Program Interface (API)Communications Activity IndexComposite index of activity on SEPTA’s customer facing electronic communications platformsFY 2017FY 2018FY 2019FY SEPTA.org 1K Page Views61,86856,94152,801N/A@SEPTA Social Activity104,888188,149212,198N/AMobile App Do
MARKET-FRANKFORD LINE 1 218 28 52.0 BROAD STREET LINE 1 125 25 35.5 REGIONAL RAIL 13 396 155 34.2 LIGHT RAIL 8 159 670 24.4 NORRISTOWN HIGH SPEED LINE 1 26 22 3.1 ADA PARATRANSIT/SHARED RIDE N/A 460 N/A 1.5 *Exact number varies as new buses are acquired and old vehicles are retired.