Transcription
Paper 3388-2019Power Up Your Reporting Using theSAS Output Delivery SystemChevell Parker, SAS Institute Inc.ABSTRACTMaking sense of a large amount of data is one of the most important aspects of a reportingsystem. Reporting helps you and others in your organization discover important insights intotrends, business strengths and weaknesses, and the overall health of a company. Therefore,report output should be in a format that anyone can understand easily. To create suchoutput, you need to use the correct reporting tools. This paper, written for data analysts,discusses techniques to power up (amplify) the effectiveness of your reporting. Thesetechniques use SAS Output Deliver System (ODS) destinations (especially the ODS Exceldestination) to generate functional, presentation-ready Microsoft Excel worksheets. Thediscussion also explains how to use the ODS destinations to enhance web pages and othertypes of documents. Finally, the paper explains how you can use Python open-sourcesoftware with the SAS System and ODS destinations to further enhance your reporting.INTRODUCTIONThe SAS Output Delivery System has an ODS destination to fit almost every formattingneed, including Excel, CSV, HTML, PowerPoint, EPUB, Word, and others. So, it’s easy tounderstand why ODS is so popular. You can do so much with the standard functionality ofthese destinations. However, this paper also discusses how you can enhance some of thestandard functionality to make these destinations even more useful. The discussion coversseveral of the destinations that you can use to enhance your reports. The paper concludesby explaining how you can use Python open-source software to enhance your reporting.EXPORTING OUTPUT TO MICROSOFT EXCEL USING THE SAS OUTPUT DELIVERY SYSTEMODS provides multiple methods for exporting output to an Excel file. For example, the ODSExcel destination writes output in the XLSX file format that is native to Excel. This sectiondiscusses using the ODS Excel destination.This section covers the following topics: using the ODS Excel destination to generate native Microsoft Excel files enhancing Microsoft Excel worksheets using formats using the SAS Report Writing Interface with formats and formulas to enhanceUSING THE ODS EXCEL DESTINATION TO GENERATE NATIVE MICROSOFTEXCEL FILESThe ODS Excel destination generates native Excel files from SAS procedures and the DATAstep. The ODS Excel destination has three prongs that allow you to plug in to its power forcreating functional and highly presentational worksheets. The first prong consists of the ODS Excel options. You can choose from over 50 suchoptions in SAS 9.4M6 (TS1M6). These options work alone or in combination with theExcel options to perform tasks such as filtering, freezing headings or rows, or addingprinting options.(list continued)1
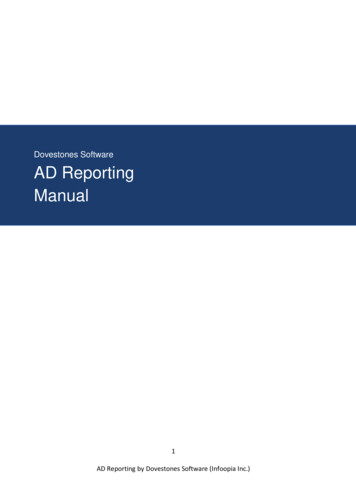
The second prong entails built-in styles that you can use to enhance yourpresentation. Those styles include global styles that you obtain by using either theTEMPLATE procedure or cascading style sheets. The STYLE override option forprocedures is also a part of this prong.The third prong is the TAGATTR style attribute, which works like an API that youcan use with the Excel destination. This attribute enables you to add Excel formatsand formulas, rotated text, and more.You can see these three prongs at work in the following example, which reads a JSON filefrom an open data site and creates a SAS data set. The example uses ODS Excel options,the TAGATTR style attribute (used in this case, to rotate headings), and the style CALLDEFINE statement in the PROC REPORT step to create striped rows. The data set from thisexample is included in the downloads.Example 1filename temp q.json";libname temp json;proc transpose data temp.root out budget name Category;id fy;var capital assets net current and other assetsdeferred loss on refundingnet investment in capital assets total assetslong term liabilities other liabilities total liabilitiestotal net position;run;ods excel file "c:\temp\test.xlsx" options(frozen headers "1"frozen rowheaders "1"row heights "30"tab color "blue");proc report data budget style(header) {tagattr "rotate:45" color whitebackground #b0b0b0};define Category / " ";compute Category;count 1;if mod(count,2) then calldefine( row ,"style","style {background #edfbf5}");endcomp;run;ods excel close;In This Example The JSON engine reads open budget data from the state of Hawaii, and theTRANSPOSE procedure reshapes the data by making the FY values the columnheadings.The TAGATTR attribute in the PROC REPORT statement rotates the headers by 45degrees.In the ODS Excel statement, the options FROZEN HEADERS andFROZEN ROWHEADERS are included, respectively, to freeze the column headingsand the first row. In addition, the ROW HEIGHTS option adds height to the rotatedheader, and the TAB COLOR option adds the color blue to the worksheet tab.(list continued)2
The MOD function in the PROC REPORT compute block, along with the CALL DEFINEstatement and the value ROW , create rows in alternating colors, as shown in theoutput below.OutputOutput 1. Excel File That Is Generated by Options, Style Attributes, and the TAGATTR AttributeENHANCING YOUR MICROSOFT EXCEL WORKSHEETS WITH FORMATS ANDFORMULASThis section examines methods for enhancing output that is created with the ODS Exceldestination. The section also describes potential problems that you might encounter. One ofthe ways you can add more power to the ODS Excel destination is by using Excelformatting. This formatting includes the use of SAS formats that are converted to Excelformat and the use of custom Excel formats that are implemented with the TAGATTR styleattribute.You can use formatting to facilitate the correct display of data in Excel as well as to enhanceyour presentation. If you do not apply a format, the default format used for all cells is theGeneral format. However, this format might not display the data as you want it to appear.Be aware that various formatting issues can occur when you use the ODS Excel destinationand Excel formats with (or without, in some cases) the ODS Excel destination. The followinglist describes certain problems that can occur when you use the General format. Leading and trailing zeros are not retained, with the exception of numbers between 1 and 1.Numbers with eleven or more digits are displayed in scientific notation.Numbers that have an embedded "E" might be interpreted as a value in scientificnotation.Ranges might be translated into dates.Values that Excel does not recognize as numbers are stored as text. This problemcan prevent calculations or affect sorting order.All numbers, regardless of how they are stored in SAS, default to the General formatif you do not specifically apply a SAS format or a custom Excel format.To display text as you type it, you should use the TYPE parameter with a value ofString in the TAGGATR attribute (Example 3) or by using the w. SAS format.(list continued)3
An Excel number format consists of four sections, separated by semicolons, that appear inthis order:The format includes positive numbers, negative numbers, zero values and text. If youspecify only one section, the number format applies to all number types (for example,positive numbers, negative numbers, and zeros). If you specify only two sections, the firstsection is applied to positive numbers and zero values, and the second section is applied tonegative numbers.The following table lists features of SAS formats and custom Excel formats.SAS FormattingSAS formatting is convenient and easy touse.If you are already a SAS user, you mightalready be familiar with SAS formatting.Custom Excel FormattingYou have total formatting control (via control ofeach section of the format).There is a small learning curve with using customformatting.You cannot validate custom formatting with theTAGATTR attribute (invalid values can corruptthe file).Custom formatting is efficient.Custom Excel formatting changes the appearanceand not the underlying value.SAS formatting supports National LanguageSupport (NLS).Limited formatting is available.SAS formats are documented extensively.SAS FormattingWhen you apply SAS formats in your worksheets, the formats are mapped to the equivalentExcel format without you having to do anything else. This mapping ensures that Excelformats are applied, guaranteeing that the displayed Excel output looks the way that youexpect. The SAS formats implement basic formatting, and the use of these formats enablesyou to avoid some of the issues that are mentioned earlier about using the General formatwithout an Excel format.The following example demonstrates the use of SAS formatting (with both character andnumeric formats) to maintain the correct display in Excel.Example 2data one;char leading "0001";Num leading 0001;char long "123456789012"; Num long 123456789012;char string "22.900";Num string 22.900;char sci "1e9";run;(code continued)4
ods excel file "c:\temp\format.xlsx";proc print data one;format Char leading char4. Num leading Z4.;format Char long 13.Num long Best.;format Char string 8.Num string 6.3;format Char sci 3.;run;ods excel close;In This Example The CHAR4. SAS format is applied to the character variable Char leading, and thenumeric format Z4. is applied to the numeric variable Num leading. These formatsmaintain the leading zeros for each variable value.The 13. format ( w.d) is applied to the character variable Char long and the BEST.format is applied to the numeric variable Num long. These formats prevent thedisplay of the variable values in scientific notation.The 8. format ( w.d) to preserves the trailing zero for the variable Char string. The6.3 format (w.d) also preserves the trailing zero for the numeric variableNum string.The w.d format is applied to the variable Char sci. This format forces the value forChar sci to be a text value rather than numeric format.OutputOutput 2. Table before Formatting Is AppliedOutput 3. Table after SAS Formatting Is AppliedCustom Excel FormattingCustom Excel formats control how numbers look in Excel, and these formats do so withoutchanging any of your data. In addition to preventing the general format from displayingnumbers incorrectly, you can also use custom Excel formatting to enhance the output. Thefollowing example uses custom Excel formatting to prevent the incorrect display ofnumbers. Custom formats can only work with value passed to ODS Excel, therefore, thereare times when a SAS format is required in addition to the custom format.Example 3data one;leading 0001;number 22.900;long value 123456789012;char sci '1e9';run;(code continued)5
ods excel file "c:\temp\custom.xlsx";proc print data one;var leading /style(data) {tagattr "format:0000"};var number / style(data) {tagattr "format:##.000"};var long value / style(data) {tagattr "format:####"};var char sci / style(data) {tagattr "type:string"};run;ods excel close;In This Example The 0000 format displays leading zeroes in the value.The ##.000 format displays the trailing zero for the number variable.The # format prevents the variable LONG VALUE from being displayed in scientificnotation.The variable CHAR SCI uses the TYPE parameter rather than the custom format todisplay the value exactly as it is. For more information, see the section "Using theMany Functions of the TAGATTR Attribute" in "Insights from a SAS TechnicalSupport Guy: A Deep Dive into the SAS ODS Excel pdf)OutputOutput 4. Table before Formatting Is AppliedOutput 5. Table after SAS Formatting Is AppliedThe next example applies custom Excel formatting to the SASHELP.HEART data set (seedownload file) to highlight subjects that require follow-up based on their initial screening. Toidentify these subjects, the example uses custom formatting to color code higher-leveldiastolic and systolic numbers. The formatting also uses color coding and text substitutionto highlight high cholesterol numbers.Example 4ods excel file "c:\temp\test.xlsx" options(embedded titles "yes");proc report data sashelp.heart ;title "Heart Health Report";column sex height weight diastolic systolic cholesterol bmi;define height / style(column) {tagattr 'format:##.# "in"'};define weight / style(column) {tagattr 'format:### "lbs"'};(code continued)6
define diastolic /style(column) {tagattr 'format:[cyan][ 90];[red][ 90];###'};define systolic /style(column) {tagattr 'format:[blue][ 120];[red][ 140]"High";### '};define cholesterol /style(column) {tagattr 'format:[red][ 200];### '};define BMI /style(column) {tagattr 'formula:RC[-4]/RC[-5]/RC[-5]*703format:[red][ 29] ##;##'};run;ods excel close;In This Example A custom format, used as part of the TAGATTR attribute, is applied to the HEIGHTand WEIGHT variables. The formats append the text "in" and "lbs," respectively, forthose variables.Color coding is added to the variable Diastolic. For borderline readings of 90, thecolor cyan is applied. For readings greater than 90, the color red applied.Color coding and text substitution is added to the variable Systolic variable. Readingsgreater than 200 are shown in red, and the values are replaced with the text "High."Readings less than 120 are shown in blue.The color red is applied for CHOLESTEROL values that are greater than 240.The TAGATTR attribute and the Formula parameter are used to calculate body massindex (BMI). (See the next section for information about formulas.)OutputOutput 6. Output Custom Excel Formats and FormulasENHANCING WORKSHEETS BY USING THE SAS REPORT WRITINGINTERFACE WITH FORMATS AND FORMULASThe Report Writing Interface is an amazing tool when it comes to generating customizedreports. This reporting tool gives you control of tasks (for example, merging cells) that youcannot easily accomplish with the traditional ODS destinations. SAS 9.4M5 includes supportfor formats and formulas that use custom Excel formatting with the TAGATTR attribute.For releases earlier than SAS 9.4M5, SAS formatting is not supported with the ReportWriting Interface when you use it with Excel destination.7
The following table shows the most common methods that are used in creating output withthe Report Writing Interface.Common MethodsTABLE START()ROW START()FORMAT CELL()ROW END()TABLE END()TITLE()IMAGE()DefinitionBegins or opens a table.Starts a row within thetable.Adds a cell within the row.Ends a row within thetable.Ends a table that is open.Adds a title to a report.Ads an image to theworksheet.When you use the Report Writing Interface, you first need to create an object that will beused with the various methods that are part of the Report Writing Interface. To create theobject, use the DECLARE statement, as shown in the next example. The DECLAREstatement is executed typically on the first iteration of the DATA step.The following example uses the BUDGET data set that is created in Example 1.Example 5data null ;set budget end last;if n 1 then do;declare odsout obj();end;After you declare an object, you can then apply methods such as the popularTABLE START() method and others that create tables, rows, and cells.The next example uses the Report Writing Interface to generate a balance-sheet report .The report is built by creating a table of assets and liabilities. The Report Writing Interfaceenables you to use formulas that both calculate totals over the group and that format thosetotals. You implement formatting and formulas by using the TAGATTR attribute. Thisexample uses the data set from Example 1. This file contains the complete code for thisexample. .zip)Example 6ods excel file "c:\temp\rwi sample.xlsx" ;data null ;set budget end last;if n 1 then do;declare odsout obj();obj.image(href ’c:\image\xyx.png’);obj.table start();obj.row start();obj.format cell(data:' ');obj.format cell(data:'Report for December 31.',column span:3);obj.row end();(code continued)8
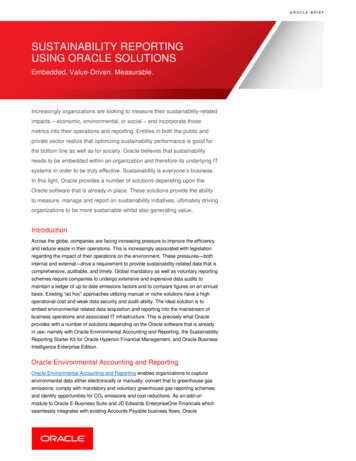
obj.row start();obj.format cell(data:'(In Millions)',style attr:"just l");obj.format cell(data:'2014');obj.format cell(data:'2013');obj.format cell(data:'2012');obj.row end();obj.row start();obj.format cell(data:'Assets',column span:4,style attr:"just left");obj.row end();end;obj.row start();if category 'total assets' then do;obj.format cell(data:category,style attr:"just l fontweight bold");obj.format cell(data: 2014,style attr:"tagattr 'formula: SUM(R[-4]C:R[1]C)format:currency'");obj.format cell(data: 2013,style attr:"tagattr 'formula: SUM(R[-4]C:R[-1]C)format:currency'");obj.format cell(data: 2012,style attr:"tagattr 'formula: SUM(R[-4]C:R[1]C)format:currency'");obj.row end();obj.row start();obj.format cell(data:" ");obj.row end();obj.row start();obj.format cell(data:"Liabiliies",column span:3,style attr:"just left");obj.row end();end;. . .more statements. . .if last then do;obj.table end();end;run;ods excel close;In This Example The object OBJ() is added using the DECLARE statement.The IMAGE() method adds a logo at the beginning of the report.The TABLE START() method is used to start a table.The ROW START() method creates a new row, and the FORMAT CELL() methodadds column headings within the cell. The COLUMN SPAN option merges the stringthat spans three columns.The IF conditions test whether the program is on the summary row. (The summaryrows are named TOTAL ASSETS, TOTAL LIABILITIES, and TOTAL NET POSITION).Then, the STYLE ATTR option adds the TAGATTR attribute, which adds the Excelformat and formula.9
The ELSE condition uses the PRETEXT option and ASIS attribute to write cells sothat the cells retain the leading space. (This condition is added in the code that is inthe download AS3388.zip)OutputOutput 7. Balance-Sheet Report That Is Added with the Report Writing Interface(Including Formats and Formulas)POWERING UP YOUR WEB OUTPUTThe previous sections discuss creating output with the ODS Excel destination. This sectionexplains how you can also enhance web output with the ODS HTML destination. HTML is themost accessible output format because every device or application (for example, email anddesktop or mobile browsers) can access to HTML output. This section illustrates ways topower up (amplify) your HTML output within the body of email as well as in desktop andmobile browsers.SENDING HTML OUTPUT TO THE BODY OF AN EMAILEmail has become one of the most efficient and effective methods for disseminatinginformation in our world. With the HTML destination, it is even easier to generate HTMLcontent to enhance your email communications.An easy and powerful way to send content to the body of email and to generate HTMLoutput is to use the EMAIL access method (in the FILENAME statement) in combination withthe ODS HTML destination. The EMAIL access method in the FILENAME statement enablesyou to programmatically send email from SAS by using the Simple Mail Transfer Protocol(SMTP).Example 7 illustrates the combination of email access method and destination.Example 7options emailsys smtp emailhost your-mail-host;filename temp email to "your-email-address"content type "text/html";ods html file temp rs none;ods text "Internal Only.";10
proc print data sashelp.class(obs 3);title link "http://www.sas.com" "Link to Detail";run;ods html close;In This Example The OPTIONS statement contains two options (EMAILSYS SMTP andEMAILHOST mail-host) that must be in effect when you send HTML content. In the FILENAME statement, you must also set the CONTENT TYPE option in orderto send HTML to the body of the email. The HTML destination passes output as HTML from PROC PRINT to the email server,where the content is added to the body of your email.Emailing HTML Content: Style IssuesMost web email clients handle styles (and, specifically, cascading styles sheets) well.However, Microsoft Outlook for the desktop does not handle styles that contain CSSbecause it uses a Word viewer to display the HTML (since Outlook 2007). The use of theWord viewer can cause many issues with the style. The Word viewer can handle HTML 3.2,which is generated with the ODS HTML3 destination. The Word viewer handles this wellbecause it uses HTML tagging (rather than a CSS) to display the style. Some other tagsetsalso display style information in the body of email (for example, the MSOffice2K tagset,which is HTML that is designed for Excel, and the PHTML tagset).The HTML destination, on the other hand, does not display the style correctly becausemultiple class entries in the CLASS attribute in Outlook for the desktop is not supported(as shown below in Output 8). The destination also adds borders incorrectly in locationssuch as the title area.Output 8. Comparison of the Output from Various HTML Destinations and Tagsetswithin OutlookNote: The downloadable Tagsets.Email tagset uses minimal CSS and parents from thePHTML tagset. .zip)Generating HTML Output: Efficiency of SizeThe method that you choose to send HTML to the body of the email must also take intoaccount the size of the output because there are defined size limitations with the emailserver. The size of the output also determines how long the file can take to load on mobile11
devices. So, for example, using the ODS HTML3 destination is not equivalent to using thePHTML destination, not only with regard to what is displayed, but also in the amount of timeit takes to load. The HTML3 destination takes almost six times as many characters to displaythe style and value in a cell. Consider the examples below that create a single cell within atable of the SASHELP.CLASS data set. You can see that the HTML destination takes 30characters to display the same cell for which the HTML3 destination requires 118 characters.If you have a lot of data, the larger number of characters can cause the email server toreject the mail because of the size limitation. In addition, it might take an excessive amountof time for the content to load on a mobile device.ODS HTML td class "l data" Alfred /td (30 characters)ODS HTML3 td align left bgcolor "#D3D3D3" font face "Arial, Helvetica, sans-serif"size "3" color "#000000" Alfred /font /TD (118 characters)Therefore, if you have large output, you need to consider which destination is best to use inorder not to exceed the limit of the email server or to avoid the extended time that it cantake to load.Emailing ImagesYou can add images to output easily with HTML destinations or tagsets. To do that, you usean identifier on the attachment, which you then refer to in the HTML tag. But you need todecide whether it makes more sense to store the graphic on a web server to reference it orto attach the image directly to the email. The answer to this question depends on the sizeof the image and how long it will take to load the file.You should also consider the following caveats when you want to send images: Use a compressed-graphic file format (such as JPG, PNG, and GIF) for emails. Add descriptive, alternative text in case the email server blocks the images frombeing viewed.Example 8options emailsys smtp emailhost your-email-host-name;filename output email to "your-email-address"attach ('C:\images\SAS.jpg' inlined "logo"'C:\images\sgplot.png' inlined "logo1"'C:\images\sgplot1.png' inlined "logo2")content type "text/html" ;ods phtml file output rs none style htmlblue options(pagebreak "no");title j l ' img src cid:logo height "100" width "100" /img ' ;proc print data sashelp.class(obs 5);run;proc odstext;p " span style 'white-space:pre' img src 'cid:logo1' width 200 height 100/ img src 'cid:logo2' width 200 height 150/ /span " / style {just center};run;ods phtml close;12
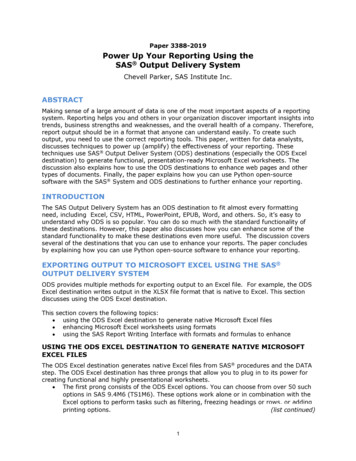
In This Example The images are defined with the INLINED suboption in the ATTACH option. Theimages are added by placing a content identifier (cid:) in the title, by using theSRC option in the ODS PHTML statement, by using the P statement in the ODSTEXTprocedure. PROC PRINT displays the generated table.OutputOutput 9. Adding Images and a Table to the Body of Email WhileMaintaining the Style InformationGENERATING DATA TABLES USING THE TABLEEDITOR TAGSETWhen you view a web page, you might want to perform tasks such as sorting content,filtering a web page, freezing headings so that they remain even when you scroll a webpage, and so on. The ability to accomplish these tasks have been available with theTableEditor tagset for some time.Consider the following example, which adds a drop-down box to query the output, limits thenumber of rows that are to be displayed, or enables you to select which page of the outputto display. The following example points to a hosted jQuery library when you add theJQ DataTable option. But you first have to download and compile the TableEditor tagset.Example 9ods tagsets.tableeditor path "c:\temp\test" body "test.html"options(JQ DataTabe "yes");proc print data sashelp.cars noobs label;run;ods tagsets.tableeditor close;In This ExampleThe TableEditor tagset is so powerful because it accomplished many tasks: The tagset enables you to modify how many rows to displayto display on the webpage.The tagset also selects records to search for within the table.It shows which records are displayed.It selects more data to view.(list continued)13
OutputNumber of rowsto displayQuery valueShow nextoutputOutput 10. Output That Is Added by Using the TableEditor TagsetTEST DRIVING THE ODS WORD DESTINATIONThe new ODS WORD destination is pre-production beginning with SAS 9.4M6. Thisdestination enables you to generate native Word files (DOCX).The ODS WORD destination goes beyond all of the ODS RTF features and adds additionalfunctionality. For example, ODS WORD uses smaller file sizes, uses native Word format, andhas the ability to add color schemes. The WORD destination alleviates the file-size issue thatis inherent in ODS RTF and the Tagsets.RTF destinations. It does so by using a muchsmaller file size. The WORD destination is the one that SAS plans to enhance going forwardbecause Microsoft no longer supports the RTF format. Also, notice that ODS WORD uses thenew Word style. You can also use the ODS Word destination with mobile devices.The following example creates a native Word file (.DOCX) by using PROC PRINT. The filesize is much smaller than that you can create with the ODS WORD destination. The imageon the right displays the directory information on the two files.Directory listingExample 10.ods word file "c:\word.docx";ods rtf file "c:\rtf file.rtf";proc print data sashelp.prdsale;run;ods all close;In This Example The ODS WORD destination applies style (using the Styles.Word style, which is thedestination's default style).PROC PRINT prints the output.14
OutputOutput 11. Output from the ODS WORD DestinationENHANCING YOUR REPORTS USING PYTHON OPEN-SOURCELANGUAGESo far, you have learned about how you can use SAS ODS destinations to generateenhanced reports. But you can also use Python open-source language for reporting or toenhance existing reports. Python is integrated totally with the SAS System in the followingways. You can use SASPy package, which enables you to execute SAS from Python. ThePython API to SAS Viya enables execution of SAS in the cloud from Python. In addition, youcan call Python functions with the FCMP procedure in SAS 9.4M6.This section demonstrates how to use the SASPy package to enhance reporting from Python.It also demonstrates the openpyxl package to update existing Excel files. If you do nothave Python installed, you can install it from the Anaconda Distribution page:www.anaconda.com/distribution.USINGSASPY TO GENERATE REPORTSThe SASPy module provides APIs to SAS. Then, you can connect and run your analyticsdirectly from Python by using the object-oriented methods to which Python customers areaccustomed. To use this module, you need a minimum of SAS 9.4 and Python 3.After you complete the setup (instructions are available in the "SASPY Installation andconfiguration" document that is listed in the References section), you can connect to a SASsession and begin your analysis. After you connect to SAS, you can use methods or APIsthat accepts Python commands and converts them to SAS code and returns the result toPython. You can use the methods in the SASPy API reference(sassoftware.github.io/saspy/api.html) to generate your analytics. BecausePython is an open-source language, you can also create your own methods.The next example takes advantage of the power of Python by using the Python WordCloudpackage. Word clouds are a good way to visualize or mine text that is based on feedback,tweets, posts, and so on, all in a single glance. The word cloud is created in Python. Thenthe FREQ procedure is used in SAS to further analyze the data while including the wordcloud created in Python. A fully customized Excel spreadsheet is generated from this.This example uses New York City open-source data to supply the most popular baby namesbetween 2011-2016, by gender and race. The CSV file (available 8.zip) is mined for thatdata.15
Example 11import pandas as pdimport matplotlib.pyplot as pltfrom wordcloud import WordClouddf pd.read ujf/rows.csv?accessType DOWNLOAD')text ' '.join(df["Child's First Name"].tolist())wordcloud WordCloud(relative scaling 1.0,background color oud.png')import saspysas saspy.SASsession(cfgname'winlocal')sasds sas.df2sd(df)sas.submit("""ods all close;ods excel file "c:\temp\test.xlsx"options(embedded titles "yes" sheet interval "none");goptions iback "c:\temp\wordcloud.png" imagestyle fit hsize 3.5invsize 3.5in;proc gslide;run;title "Most popular baby names in NYC from 2011-2016";proc freq data df order freq;table C
format and the use of custom Excel formats that are implemented with the TAGATTR style attribute. You can use formatting to facilitate the correct display of data in Excel as well as to enhance your presentation. If you do not apply a format, the default format used for all cells is the General format.