Transcription
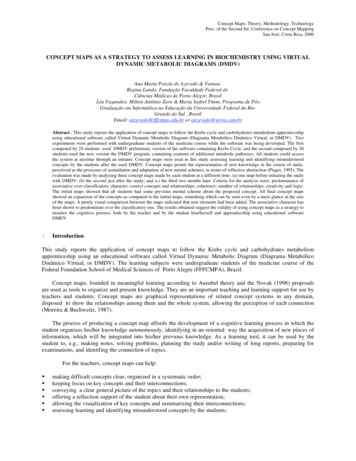
DEBORAH ROEDDER JOHN, BARBARA LOKEN, KYEONGHEUI KIM, andALOKPARNA BASU MONGA*Understanding brand equity involves identifying the network of strong,favorable, and unique brand associations in memory. This articleintroduces a methodology, Brand Concept Maps, for eliciting brandassociation networks (maps) from consumers and aggregating individualmaps into a consensus map of the brand. Consensus brand mapsinclude the core brand associations that define the brand’s image andshow which brand associations are linked directly to the brand, whichassociations are linked indirectly to the brand, and which associationsare grouped together. Two studies illustrate the Brand Concept Mapsmethodology and provide evidence of its reliability and validity.Brand Concept Maps: A Methodology forIdentifying Brand Association NetworksUnderstanding brand equity involves identifying the network of strong, favorable, and unique brand associations inconsumer memory (Keller 1993). Consumers might associate a brand with a particular attribute or feature, usage situation, product spokesperson, or logo. These associationsare typically viewed as being organized in a network in amanner consistent with associative network models ofmemory (see Anderson 1983). This association networkconstitutes a brand’s image, identifies the brand’s uniqueness and value to consumers, and suggests ways that thebrand’s equity can be leveraged in the marketplace (Aaker1996).Ideally, firms should be able to measure this network ofbrand associations to obtain a brand map, such as the onefor McDonald’s in Figure 1. This map not only identifiesimportant brand associations but also conveys how theseassociations are connected to the brand and to one another.First, the map pinpoints several associations that are connected directly to the McDonald’s brand, such as “service”and “value,” and therefore are more closely tied to thebrand’s meaning. Second, the map shows how other associ-ations are connected to these close brand associations. Forexample, “hassle-free,” “convenient,” and “fast” are connected to the “service” association. Third, the map showsadditional linkages between associations. For example, several core associations—“meals,” “value,” and “service”—are connected to one another but are not connected to othercore associations, such as “social involvement.”However, methodologies for producing brand maps havebeen slow to emerge. Many methods are available for eliciting brand associations from consumers, ranging from qualitative techniques, such as collages and focus groups, toquantitative methods, such as attribute rating scales andbrand personality inventories. Techniques such as multidimensional scaling are helpful in understanding howbrands are viewed and what dimensions underlie these perceptions, but these techniques do not identify brand association networks—that is, which associations are linkeddirectly to the brand, which associations are indirectlylinked to the brand through other associations, and whichassociations are grouped together.Two categories of techniques that differ in the way theyderive brand maps are promising in this regard. The first,which we refer to as “consumer mapping,” elicits brandmaps directly from consumers. Brand associations areelicited from consumers, who are then asked to constructnetworks of these associations as links to the brand and toone another. Illustrative of this approach is Zaltman’sMetaphor Elicitation Technique (ZMET), which uses qualitative research techniques to identify key brand associationsand then uses in-depth interviews with respondents touncover the links between these brand associations (Zaltman and Coulter 1995). The second category of techniques,which we refer to as “analytical mapping,” produces brandmaps using analytical methods. Brand associations are*Deborah Roedder John is Professor and Curtis L. Carlson Chair inMarketing (e-mail: djohn@csom.umn.edu), and Barbara Loken is Professor of Marketing (e-mail: bloken@csom.umn.edu), Carlson School ofManagement, University of Minnesota. Kyeongheui Kim is Assistant Professor of Marketing, University of Toronto (e-mail: kkim@Rotman.Utoronto.Ca). Alokparna (Sonia) Basu Monga is Assistant Professor ofMarketing, University of Texas at San Antonio (e-mail: alokparna.monga@utsa.edu). Contributions of the first and second author were equal.The authors thank Kent Seltman and Lindsay Dingle from the MayoClinic–Rochester for their participation and support. They also thank LanNguyen Chaplin for help with stimuli development and data coding. Thisresearch was sponsored by McKnight grants from the Carlson School ofManagement and funding from the Mayo Foundation. 2006, American Marketing AssociationISSN: 0022-2437 (print), 1547-7193 (electronic)549Journal of Marketing ResearchVol. XLIII (November 2006), 549–563
550JOURNAL OF MARKETING RESEARCH, NOVEMBER 2006Figure 1BRAND MAP FOR MCDONALD’SSource: Reprinted with permission of The Free Press, a division of Simon & Schuster Adult Publishing Group, from Building Strong Brands, by David A.Aaker (1996). Copyright by David A. Aaker. All rights reserved.elicited from consumers, but analytical methods are used touncover the network of brand associations. Illustrative ofthis approach is network analysis, which uses consumerperceptions about brands and derives the structure of brandassociations through network algorithms (see Henderson,Iacobucci, and Calder 1998).Despite these developments, barriers remain in makingbrand-mapping techniques more accessible to marketingpractitioners. In consumer mapping approaches, the processof eliciting brand maps from individual consumers andaggregating these individual maps into a consensus brandmap can be labor intensive and require specialized expertise. For example, ZMET requires the use of lengthy personal interviews conducted by interviewers trained in several base disciplines, such as cognitive neuroscience andpsycholinguistics. Analytical mapping techniques offer aless labor-intensive process for generating maps through theuse of quantitative analyses, but such techniques requireknowledge of statistical techniques that are unfamiliar tomost marketing researchers. For example, network analysisis a well-known technique in sociology, but it is unfamiliarto most marketing research firms.In this article, we offer a new consumer mappingapproach, called Brand Concept Maps (BCM), to answerthe need for a more accessible and standardized method forproducing brand maps. Our approach is easier to administerthan existing consumer mapping techniques, such asZMET, and does not require specially trained interviewersand large time commitments from respondents. In addition,the BCM offers a flexible approach that is capable of beingused in many research settings, even with large sample sizesthat cover diverse market segments. Compared with existing analytical mapping techniques, such as network analysis, our approach offers a standardized approach for aggregating individual brand maps using a relativelystraightforward set of rules that do not require knowledge ofspecialized statistical techniques.The remainder of the article proceeds as follows: Webegin by providing more background on consumer mappingmethods and describe ZMET and BCM in detail. Next, wediscuss the first study; we describe the BCM methodology,illustrate its application, and provide evidence of its reliability (split-half reliability) and validity (nomologicalvalidity). We then present a second study that provides evidence of convergent validity, comparing results from theBCM technique with more conventional ways of measuringbrand perceptions. In the final section, we evaluate thestrengths and weaknesses of the BCM approach as well asits usefulness for brand management.CONSUMER MAPPING TECHNIQUESConsumer mapping techniques can be described in termsof three stages. The first is the elicitation stage, in whichimportant brand associations are elicited from consumers.In the second stage, consumers map these elicited associations to show how they are connected to one another and to
Brand Concept Mapsthe brand. In the third stage, researchers aggregate theseindividual brand maps and associated data to produce a consensus brand map.In this section, we describe how these stages are accomplished in the most well-known consumer mapping technique, ZMET, and in our technique, BCM. We also evaluateeach technique in terms of criteria that are important acrossmany branding applications: ease of administration, flexibility across research settings, and quality of the obtaineddata in terms of reliability and validity.ZMETDescription. Zaltman’s Metaphor Elicitation Techniqueis designed to “surface the mental models that drive consumer thinking and behavior” (Zaltman and Coulter 1995,p. 36). It can be used for understanding consumers’thoughts about brands and product categories (Zaltman andCoulter 1995).In the elicitation stage, a small number of participants,typically 20–25, are recruited and introduced to the topic ofthe study (brand). Participants are then given instructions totake photographs and/or collect a minimum of 12 picturesof images that will convey their thoughts and feelings aboutthe topic. Seven to ten days later, participants return withthe requested materials and engage in a two-hour personalinterview to elicit constructs. The personal interview usesqualitative techniques that tap verbal constructs, such asKelly’s repertory grid (respondents identify how any two ofthree randomly selected pictures are similar but differentfrom a third stimulus) and laddering exercises (respondentsspecify a means–end chain that consists of attributes, consequences, and values). The interviews also include severalactivities aimed at eliciting visual images that represent thetopic of interest. Interviewers are specially trained in theseelicitation techniques and are familiar with base disciplines(e.g., cognitive neuroscience, psycholinguistics, semiotics)underlying ZMET.This is followed by the mapping stage, in which participants create a map or visual montage using the constructsthat have been elicited. The interviewer reviews all the constructs that have been elicited with the respondent and thenasks him or her to create a map that illustrates the importantconnections among important constructs.In the aggregation stage, researchers construct a consensus map that shows the most important constructs and theirrelationships across respondents. Interview transcripts,audiotapes, images, and interviewers’ notes are examinedfor the presence of constructs and construct pairs (two constructs that are related in some manner). After coding thesedata, the researchers make decisions about which constructsand construct relationships to include in the consensus mapbased on how frequently they are mentioned across respondents. The final map contains the chosen elements witharrows to represent links between constructs.Evaluation. The primary advantage of ZMET is the thoroughness of the procedures for eliciting brand associations;it uses multiple qualitative research techniques to tap verbaland nonverbal aspects of consumer thinking. Eliciting brandassociations in this manner is well suited to situations inwhich prior branding research is limited or in which deeperand unconscious aspects of a brand need to be better under-551stood (Christensen and Olson 2002). Reliability and validityalso seem promising. On the basis of validations with survey data, Zaltman (1997) reports that constructs elicitedusing ZMET generalize to larger populations, though thevalidity of relationships between constructs (associations)in consensus maps is still at issue (Zaltman 1997).The most significant drawbacks of ZMET are related toaccessibility and ease of administration. Accessibility topractitioners is limited because the procedures for producing brand maps are not standardized and involve expertjudgment. The technique is also difficult to administer, andthe process is labor intensive (Zaltman 1997). Respondentsmust be willing to undergo two interview sessions anddevote additional time to prepare pictures and images forthose interviews. Interviewers with specialized trainingdetermine the composition of the consensus maps throughtime-consuming reviews of interview materials. Theserequirements limit the flexibility of using ZMET acrossresearch settings, such as focus groups and mall-interceptstudies. In addition, because the elicitation, mapping, andaggregation stages are so intertwined, ZMET offers littleflexibility for firms with extensive prior brand research thatalready know the associations consumers connect to theirbrand but want to understand how these associations arestructured in the form of a brand map.BCMBackground. The BCM methodology is based on a familyof measurement techniques called concept maps. Conceptmaps have been used for more than 20 years in the physicalsciences to elicit knowledge people possess about scientificconcepts and how they are interrelated to one another(Novak and Gowin 1984). Procedures for obtaining conceptmaps are flexible, ranging from unstructured methods, inwhich respondents generate their own concepts and developconcept maps with few instructions, to structured methods,in which lists of concepts are provided and concept mapping proceeds with the aid of explicit instructions and concept map examples (for a review, see Ruiz-Primo andShavelson 1996). Recently, Joiner (1998) used an unstructured form of concept mapping to obtain brand maps fromindividual consumers. Participants were given a brief set ofinstructions, including an example concept map, and wereasked to generate a concept map for a brand by thinkingabout the things they associated with the brand and drawinglines between these associations to show how they wereconnected.However, existing work on concept maps does not offerprocedures for aggregating individual maps into consensusmaps. Individual concept maps obtained using unstructuredmethods present many of the same difficulties as those thatZMET poses. Therefore, procedures for obtaining individual maps need to be designed with aggregation in mind. Todo so, the BCM incorporates structure into the elicitation,mapping, and aggregation stages of concept mapping, as wedescribe subsequently.Description. The BCM method provides a map showingthe network of salient brand associations that underlie consumer perceptions of brands. In the elicitation stage,researchers identify salient associations for the brand.Existing consumer research can be used for this purpose, or
552JOURNAL OF MARKETING RESEARCH, NOVEMBER 2006a brief survey can provide the necessary information. Theprocess for identifying salient associations should conformto four criteria, guided by procedures for obtaining salientbeliefs in attitude research (e.g., Fishbein and Ajzen 1975).1First, data used to identify salient associations should begathered from the same consumer population as the onebeing used in the mapping stage. Second, data used to identify salient associations should be based on consumerresponses to open-ended questions (e.g., “When you thinkof [brand], what comes to mind?”). Open-ended questionsallow consumers to voice whatever brand associations aremost accessible and important to them in their own words.Third, the most frequently mentioned brand associationsshould be selected to form the final set. For our procedure,we include brand associations that at least 50% of respondents mentioned. Fourth, in selecting the exact phrasing forsalient brand associations, it is important to retain wordingthat the consumers use rather than wording that researchersor managers more commonly use.To begin the mapping stage, respondents are asked tothink about what they associate with the brand. Salientbrand associations (selected from the first stage) mountedonto cards are shown to respondents to aid in this process.Respondents are asked to select any of the premade cardsthat reflect their feelings about the brand. As a check toensure that all salient brand associations have been includedon the cards, blank cards are made available for respondentswho want to add additional associations to the set. Then,respondents are shown an example of a BCM and are giveninstructions on building their own brand map. Respondentsuse the brand associations they have selected and connectthem to one another and to the brand, using another set ofcards with different types of lines (single, double, or triple)to signify the strength of the connection betweenassociations.In the aggregation stage, individual brand maps are combined on the basis of a set of rules to obtain a consensusmap for the brand. As we describe subsequently, these rulesrequire no specialized knowledge of quantitative or qualitative research methods. Frequencies are used to construct aconsensus map, showing the most salient brand associationsand their interconnections.Evaluation. The BCM method incorporates structure intothe elicitation, mapping, and aggregation stages to provide atechnique that is easier to administer and analyze. Interviewers need minimal training, and respondents can complete the mapping procedure in a relatively short time (15–20 minutes). The BCM method also provides flexibility.Prior consumer research can often be used in the elicitationstage, enabling researchers to proceed with the mappingand aggregation stages without further time and expense.Respondents can complete brand maps relatively quickly,making the technique suitable for many data collection settings and affording the opportunity to collect larger samplesthan ZMET. This, along with more standardized aggrega1The BCM elicitation procedure differs from standard elicitation procedures in attitude research in at least two respects. First, the open-endedelicitation questions may differ somewhat from standardized elicitationquestions about favorable and unfavorable attributes (or consequences)used in some attitude research (Fishbein and Ajzen 1975). Second, thenumber of associations used for the BCM procedure is typically larger thanthe 7 rule used in some attitude research (Fishbein and Ajzen 1975).tion procedures, enables firms to collect brand maps for different market segments or geographic areas.However, the BCM has drawbacks as well. In most cases,the BCM reveals accessible brand associations and connections. However, associations that require more in-depthprobing are unlikely to surface with this technique. Most ofthe representations are verbal in nature as well. Furthermore, the reliability and validity of consensus brand mapsusing BCM requires examination. Although individual concept maps may be valid, consensus maps pose additionalchallenges, particularly with regard to aggregation bias thatcan adversely affect reliability and validity.We address these issues in Study 1. We illustrate the useof the BCM in a real branding context and provide additional details about the elicitation, mapping, and aggregation procedures. We also evaluate reliability and validity forthe BCM methodology.STUDY 1In this study, we illustrate the use of the BCM in the context of a premier health care brand, the Mayo Clinic. Thisafforded us several opportunities to test the capabilities ofthe BCM technique. First, the Mayo Clinic is a complexbrand with many salient brand associations, such as “leaderin medical research,” “best doctors in the world,” and“known worldwide.” This complexity provided a strong testof the BCM because large numbers of brand associationscan be combined in almost infinite ways in a network structure, making it difficult to obtain a consensus brand map.Second, the Mayo Clinic brand elicits a wide variety ofassociations, including attributes (e.g., “best doctors in theworld”), personality traits (e.g., “caring and compassionate”), and emotions (e.g., “it comforts me knowing thatMayo Clinic exists”). This provided an opportunity to testwhether the BCM would be able to incorporate differenttypes of associations into consensus brand maps. Finally,the Mayo Clinic is a brand with distinct user segments(patients versus nonpatients), which enabled us to testwhether BCM would work equally well for users (whoshare experiences and similar brand associations) andnonusers (who are more heterogeneous and likely to havefewer brand associations in common).Elicitation StageTo begin, we selected a set of salient brand associationsfor the Mayo Clinic. First, we examined prior consumerresearch conducted by the Mayo Clinic, focusing our attention on responses to open-ended questions about the brand.We developed frequency counts of how often certain brandassociations were mentioned, and we selected those that atleast 50% of the respondents mentioned. We submittedthese selections for review to the Mayo Clinic brand team,who added a few more associations of particular interest tothem. We also consulted with members of the brand team tofinalize the exact wording of the brand associations. Theresult was a set of 25 brand associations to be used in themapping stage.Mapping StageSample. A total of 165 consumers from two midwesterncities participated in the study. Ninety participants werecurrent or former patients at the Mayo Clinic. Patients wererandomly selected from the Mayo Clinic database, sent a
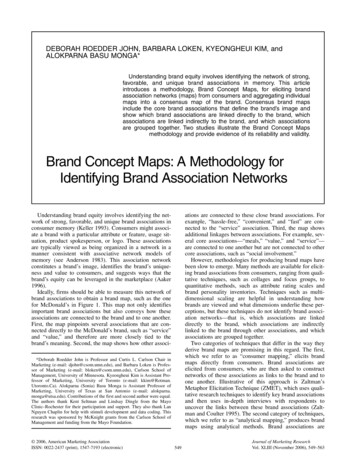
Brand Concept Maps553prenotification letter from the Mayo Clinic asking for theirparticipation, and then recruited by telephone by marketingresearch firms in both cities. Seventy-five participants werenonpatients who were recruited and screened by marketingresearch firms. Age and gender quotas were used for bothsamples to obtain a broader set of respondents. All participants received monetary compensation for theirparticipation.Procedure. Marketing research firms in both cities conducted one-on-one interviews. Respondents were told thatthey were participating in a consumer study of health careorganizations and had been chosen to answer questionsabout the Mayo Clinic. Respondents were encouraged toexpress their own opinions, whether positive or negative,and were told that the researchers were not employees ofthe Mayo Clinic.Participants were guided in building their brand maps infour steps. First, participants were asked to think about thefollowing question: “What comes to mind when you thinkabout the Mayo Clinic?” To help them with this task,respondents were shown a poster board that contained 25laminated cards, with a different brand association for theMayo Clinic printed on each card. Respondents were toldthat they could use any of the cards on the poster board andcould add additional thoughts or feelings by writing themdown on blank laminated cards provided. All the chosencards were put onto a second poster board to complete thisstep.The second step involved explaining the nature and purpose of the BCM. Respondents were shown a BCM of theVolkswagen Beetle (see Figure 2). This example was usedto describe the types of associations that might be includedon the map, how associations might be linked to the brand(directly linked, such as “inexpensive to drive,” or indirectlylinked, such as “good mpg [miles per gallon]”), and howassociations might be linked to one another (e.g., “goodmpg” causes a Volkswagen to be “inexpensive to drive”).The Volkswagen Beetle map also included different types oflines that connected associations—specifically, single, douFigure 2BCM EXAMPLEble, or triple lines. Participants were told that these linesindicated how strongly an association was connected to thebrand or to another association, with more lines indicating astronger connection.Third, respondents developed their brand map for theMayo Clinic. Participants were given a blank poster board,with the brand (Mayo Clinic) in the center. They wereinstructed to use the laminated cards they had previouslyselected and were given different types of lines (single, double, or triple) for connecting the laminated cards on theirposter board. Respondents had as much time as they neededand were allowed to look at the Volkswagen Beetle examplefor reference.In the fourth step, participants were asked to indicatetheir feelings about the brand using a number between 1(“extremely negative”) and 10 (“extremely positive”),which was then marked on the brand map next to the MayoClinic name. Participants completed several questions aboutprior experience and familiarity with the Mayo Clinic aswell as basic demographics. Respondents were thenthanked, debriefed about the study, and dismissed. On average, respondents completed the entire brand concept mapping procedure in 15–25 minutes.Aggregation StageMeasures. We first coded information from each respondent’s map in terms of (1) the presence of each of the 25brand associations, (2) the type of line (single, double, ortriple) connecting each association to the brand or toanother association, (3) the level at which each associationwas placed on the map (e.g., Level 1 connected to brand,Level 2 connected under a Level 1 association), and (4)which brand associations were linked above and below eachassociation on the map. At this point, we also analyzedbrand associations that the respondents added during themapping procedure to determine whether any occurred frequently enough to be added to the original set. None werementioned by more than 4% of respondents, so we excludedthem from further analysis. However, we maintained a listof added associations in case they represented emergingperceptions of the brand that deserve further managementattention.We aggregated the coded data to obtain several measuresfor constructing the consensus brand map. Measures for thepatient sample appear in Table 1. “Frequency of mention” isthe number of times that a brand association occurs acrossmaps. In Table 1, “expert in treating serious illnesses” wasthe most frequently mentioned association. “Number ofinterconnections” represents the number of times that abrand association is connected to other brand associations.The belief and attitude structure literature often views interconnectivity as indicative of how “central” an element iswithin an overall belief system (Eagly and Chaiken 1993;Rokeach 1968). In Table 1, “expert in treating serious illnesses” had the most interconnections to other brand associations. Frequently mentioned associations with manyinterconnections are the strongest candidates for being chosen as “core” brand associations on the consensus brandmap.The next three measures in Table 1 indicate where corebrand associations should be placed on the consensus brandmap, linked directly or indirectly to the brand. “Frequency
554JOURNAL OF MARKETING RESEARCH, NOVEMBER 2006Table 1STUDY 1: BCM MEASURES FOR PATIENTSCore AssociationsBrand AssociationsExpert in treating serious illnessesLatest medical equipment and technologyLeader in medical researchKnown worldwideTop-notch surgery and treatmentBest doctors in the worldWorld leader in new medical treatmentsCan be trusted to do what’s right for patientsDoctors work as a teamBest patient care availableTreats patients with rare and complex illnessesCan figure out what’s wrong when other doctors can’tPublishes health information to help you stay wellApproachable, friendly doctorsCaring and compassionateTreats famous people from around the worldIt comforts me knowing Mayo exists if I ever need itPeople I know recommend MayoLeader in cancer research and treatmentCares more about people than moneyCourt of last resortHard to get into unless very sick or famousVery big and intimidatingExpensiveUses its reputation to make moneyFirst-Order AssociationsFrequencyof MentionNumberof InterconnectionsFrequency ofFirst-OrderMentionRatio ofFirst-OrderMention 1822921901545711411Notes: N 90 respondents. Core brand associations are in bold, and first-order brand associations are in bold italics.of first-order mentions” is a count of the number of timesthat a brand association is directly linked to the brandacross maps. In Table 1, “leader in medical research” wasthe association most frequently connected in a direct way tothe Mayo Clinic brand. “Ratio of first-order mentions” isthe percentage of times that a brand association is linkeddirectly to the brand when it is included on a brand map.According to Table 1, 75.9% of patients who included“leader in medical research” on their brand maps placedthis association as a direct link to the Mayo Clinic brand.“Type of interconnections” indicates how frequently abrand association is placed above other associations (superordinate) or below other associations (subordinate) acrossmaps. As Table 1 shows, patients frequently mentioned “latest medical equipment and technology” but placed it morein a subordinate position (38 maps) than in a superordinateposition (24 maps). Associations linked directly to thebrand on a frequent basis with more superordinate than subordinate connections are strong candidates for beingdirectly connected to the brand in the consensus brand map.Procedure. We used a five-step process to develop a consensus brand map for Mayo Clinic patients and nonpatients(see Table 2). In the first step, we identified the core brandassociations that would be placed on the map. We used twomeasures for this purpose: frequency of mention and number of interconnections. We identified associations that wereincluded on at least 50% of the maps as core brand associations, consistent with cutoff levels in content analyses ofbrand/product attributes, beliefs, and values (Reynolds andGutman 1988; Sirsi, Ward, and Reingen 1996; Zaltman andCoulter 1995). We also included associations wit
tative research techniques to identify key brand associations and then uses in-depth interviews with respondents to uncover the links between these brand associations (Zalt-man and Coulter 1995). The second category of techniques, which we refer to as "analytical mapping," produces brand maps using analytical methods. Brand associations are