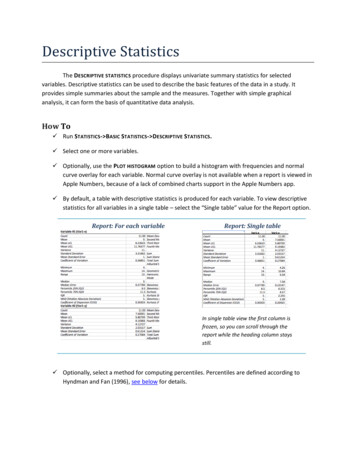
Transcription
CURRICULUM GUIDECIA World FactbookSTATISTICSAfrican Pen PalsDEFINITIONS & TERMSSTATISTICS ECONOMIC GEOGRAPHY POPULATIONEgyptKenyaNigeriaSouth AfricaTanzaniaSTATISTICSAFRICAN PEN PALS19
CIA World FactbookDEFINITIONS AND ctbook/index.htmlECONOMICSTerm:Definition and Explanation:Purchasing Power Parity:(PPP)PPPs are the rates of currency conversion that equalise the purchasing powerof different currencies by eliminating the differences in price levels betweencountries. In their simplest form, PPPs are simply price relatives which show theratio of the prices in national currencies of the same good or service in differentcountries. For example, if the price of a hamburger in France is 2.84 euros and inthe United States it is 2.2 dollars, then the PPP for hamburger between France andthe United States is 2.84 euros to 2.2 dollars or 1.29 euros to the dollar. This meansthat for every dollar spent on hamburger in the United States, 1.29 euros wouldhave to be spent in France to obtain the same quantity and quality or, in otherwords, the same volume of hamburger.(From Organization for Economic Co-operation and Development–OECD–web site: http://www.oecd.org/home/)GDP:This entry gives the gross domestic product (GDP) or value of all final goods andservices produced within a nation in a given year. GDP dollar estimates in the FactBook are derived from purchasing power parity (PPP) calculations.See the note on GDP methodology for more actbook/docs/notesanddefs.html#2001)GDP—real growth rate:GDP—per capita:GDP—composition by sector:Population belowpoverty line:Labor force:Labor force by occupation:Unemployment rate:This entry gives GDP growth on an annual basis adjusted for inflation andexpressed as a percent.This entry shows GDP on a purchasing power parity basis divided by populationas of 1 July for the same year.This entry gives the percentage contribution of agriculture, industry, andservices to total GDP.National estimates of the percentage of the population lying below the poverty lineare based on surveys of sub-groups, with the results weighted by the number ofpeople in each group. Definitions of poverty vary considerably among nations. Forexample, rich nations generally employ more generous standards of poverty thanpoor nations.This entry contains the total labor force figure.This entry contains a rank ordering of component parts ofthe labor force by occupation.This entry contains the percent of the labor force that is without jobs.Substantial underemployment might be noted.STATISTICSAFRICAN PEN PALS20
ECONOMICSTerm:Budget:Industries:Agricultural rtners:Debt—external:Economic aid—recipient:Currency:Exchange rates:Definition and Explanation:This entry includes revenues, total expenditures, and capital expenditures.These figures are calculated on an exchange rate basis, i.e., not in purchasingpower parity (PPP) termsThis entry provides a rank ordering of industries starting with the largestby value of annual output.This entry is a rank ordering of major crops and products startingwith the most important.This entry provides the total US dollar amount of exports on an f.o.b.(free on board) basis.This entry provides a rank ordering of exported products starting with themost important; it sometimes includes the percent of total dollar value.This entry provides a rank ordering of trading partners starting with the mostimportant; it sometimes includes the percent of total dollar value.This entry provides the total U.S. dollar amount of imports on a c.i.f.(cost, insurance, and freight) or f.o.b. (free on board) basis.This entry provides a rank ordering of imported products starting with themost important; it sometimes includes the percent of total dollar value.This entry provides a rank ordering of trading partners starting with themost important; it sometimes includes the percent of total dollar value.This entry gives the total public and private debt owed to nonresidentsrepayable in foreign currency, goods, or services.This entry refers to net official development assistance (ODA) from Organizationfor Economic Cooperation and Development (OECD) nations to developingcountries and multilateral organizations. ODA is defined as financial assistancethat is concessional in character, has the main objective to promote economicdevelopment and welfare of the less developed countries (LDCs), and containsa grant element of at least 25%. The entry does not cover other official flows(OOF) or private flows.This entry identifies the national medium of exchange and its basic subunit.This entry provides the official value of a countryʼs monetary unit at a givendate or over a given period of time, as expressed in units of local currency perUS dollar and as determined by international market forces or official fiat.STATISTICSAFRICAN PEN PALS21
GEOGRAPHYTerm:Location:Definition and Explanation:This entry identifies the countryʼs regional location, neighboring countries, andadjacent bodies of water.Geographic coordinates:This entry includes rounded latitude and longitude figures for the purpose of finding the approximate geographic center of an entity and is based on the Gazetteerof Conventional Names, Third Edition, August 1988, U.S. Board on GeographicNames and on other sources.Area:This entry includes three subfields. Total area is the sum of all land and water areasdelimited by international boundaries and/or coastlines. Land area is the aggregateof all surfaces delimited by international boundaries and/or coastlines, excludinginland water bodies (lakes, reservoirs, rivers). Water area is the sum of all watersurfaces delimited by international boundaries and/or coastlines, including inlandwater bodies (lakes, reservoirs, rivers).Area comparative:This entry provides an area comparison based on total area equivalents. Most entities are compared with the entire U.S. or one of the 50 states based on area measurements (1990 revised) provided by the U.S. Bureau of the Census. The smallerentities are compared with Washington, DC (178 sq km, 69 sq mi) or The Mall inWashington, DC (0.59 sq km, 0.23 sq mi, 146 acres).Land boundaries:Coastline:This entry contains the total length of all land boundaries and theindividual lengths for each of the contiguous border countries.This entry gives the total length of the boundary between the land area (includingislands) and the sea.Climate:This entry includes a brief description of typical weather regimesthroughout the year.Terrain:This entry contains a brief description of the topography.Elevation extremes:This entry includes both the highest point and the lowest point.Natural resources:This entry lists a countryʼs mineral, petroleum, hydropower, andother resources of commercial importance.Land use:This entry contains the percentage shares of total land area for three different typesof land use: arable land: land cultivated for crops that are replanted after eachharvest like wheat, maize, and rice; permanent crops: land cultivated for crops thatare not replanted after each harvest like citrus, coffee, and rubber; includes landunder flowering shrubs, fruit trees, nut trees, and vines, but excludes land undertrees grown for wood or timber; other: any land not arable or under permanentcrops; includes permanent meadows and pastures, forests and woodlands, built-onareas, roads, barren land, etc.STATISTICSAFRICAN PEN PALS22
GEOGRAPHYTerms:Irrigated land:Natural hazards:Environment:current issuesEnvironment:international agreementsGeography note:Definitions and Explanations:This entry gives the number of square kilometers of land area that isartificially supplied with water.This entry lists potential natural disasters.This entry lists the most pressing and important environmental ook/docs/notesanddefs.html#2032For a list of terms and abbreviations are used throughout the entryThis entry separates country participation in international environmentalagreements into two levels: party to and signed but not ratified.Agreements are listed in alphabetical order by theabbreviated form of the full name.This entry includes miscellaneous geographic information ofsignificance not included elsewhere.STATISTICSAFRICAN PEN PALS23
POPULATIONTerms:Definitions and Explanations:Total population:This entry gives an estimate from the U.S. Bureau of the Census based on statisticsfrom population censuses, vital statistics registration systems, or sample surveyspertaining to the recent past and on assumptions about future trends. The totalpopulation presents one overall measure of the potential impact of the countryon the world and within its region. Note: starting with the 1993 Factbook, demographic estimates for some countries (mostly African) have explicitly takeninto account the effects of the growing impact of the HIV/AIDS epidemic. Thesecountries are currently: The Bahamas, Benin, Botswana, Brazil, Burkina Faso,Burma, Burundi, Cambodia, Cameroon, Central African Republic, DemocraticRepublic of the Congo, Republic of the Congo, Cote dʼIvoire, Ethiopia, Gabon, Ghana, Guyana, Haiti, Honduras, Kenya, Lesotho, Malawi, Mozambique,Namibia, Nigeria, Rwanda, South Africa, Swaziland, Tanzania, Thailand, Togo,Uganda, Zambia, and Zimbabwe.Age structure:This entry provides the distribution of the population according to age. Information is included by sex and age group (0-14 years, 15-64 years, 65 years andover). The age structure of a population affects a nationʼs key socioeconomicissues. Countries with young populations (high percentage under age 15) need toinvest more in schools, while countries with older populations (high percentage ages 65 and over) need to invest more in the health sector. The age structurecan also be used to help predict potential political issues. For example, therapid growth of a young adult population unable to find employment can leadto unrest.Median age:This entry is the age that divides a population into two numerically equal groups;that is, half the people are younger than this age and half are older. It is a singleindex that summarizes the age distribution of a population. Currently, the median age ranges from a low of about 15 in Uganda and Gaza Strip to 40 or morein several European countries and Japan. See the entry for “Age structure” forthe importance of a younger versus an older age structure and, by implication, alower versus a higher median age.Population growth rate:The average annual percent change in the population, resulting from a surplus(or deficit) of births over deaths and the balance of migrants entering and leavinga country. The rate may be positive or negative. The growth rate is a factor indetermining how great a burden would be imposed on a country by the changingneeds of its people for infrastructure (e.g., schools, hospitals, housing, roads),resources (e.g., food, water, electricity), and jobs. Rapid population growth canbe seen as threatening by neighboring countries.Birth rate:This entry gives the average annual number of births during a year per 1,000persons in the population at midyear; also known as crude birth rate. The birthrate is usually the dominant factor in determining the rate of population growth.It depends on both the level of fertility and the age structure of the population.STATISTICSAFRICAN PEN PALS24
POPULATIONTerms:Definitions and Explanation:Death rate:This entry gives the average annual number of deaths during a year per 1,000population at midyear; also known as crude death rate. The death rate, while only arough indicator of the mortality situation in a country, accurately indicates the current mortality impact on population growth. This indicator is significantly affectedby age distribution, and most countries will eventually show a rise in the overalldeath rate, in spite of continued decline in mortality at all ages, as declining fertility results in an aging population.Net migration rate:This entry includes the figure for the difference between the number of persons entering and leaving a country during the year per 1,000 persons (based on midyearpopulation). An excess of persons entering the country is referred to as net immigration (e.g., 3.56 migrants/1,000 population); an excess of persons leaving thecountry as net emigration (e.g., -9.26 migrants/1,000 population). The net migration rate indicates the contribution of migration to the overall level of populationchange. High levels of migration can cause problems such as increasing unemployment and potential ethnic strife (if people are coming in) or a reduction in thelabor force, perhaps in certain key sectors (if people are leaving).Sex ratio:This entry includes the number of males for each female in five age groups: atbirth, under 15 years, 15-64 years, 65 years and over, and for the total population. Sex ratio at birth has recently emerged as an indicator of certain kinds of sexdiscrimination in some countries. For instance, high sex ratios at birth in someAsian countries are now attributed to sex-selective abortion and infanticide due toa strong preference for sons. This will affect future marriage patterns and fertilitypatterns. Eventually it could cause unrest among young adult males who are unable to find partners.Infant mortality rate:This entry gives the number of deaths of infants under one year old in a given yearper 1,000 live births in the same year. This rate is often used as an indicator of thelevel of health in a country.Life expectancy rate:This entry contains the average number of years to be lived by a group of peopleborn in the same year, if mortality at each age remains constant in the future. Theentry includes total population as well as the male and female components. Lifeexpectancy at birth is also a measure of overall quality of life in a country andsummarizes the mortality at all ages. It can also be thought of as indicating thepotential return on investment in human capital and is necessary for the calculationof various actuarial measures.Total fertility rate:This entry gives a figure for the average number of children that would be born perwoman if all women lived to the end of their childbearing years and bore childrenaccording to a given fertility rate at each age. The total fertility rate is a more directmeasure of the level of fertility than the crude birth rate, since it refers to births perwoman. This indicator shows the potential for population growth in the country.STATISTICSAFRICAN PEN PALS25
POPULATIONTerms:Definitions and Explanation:Total fertility rate:High rates will also place some limits on the labor force participation rates forwomen. Large numbers of children born to women indicate large family sizes thatmight limit the ability of the families to feed and educate their children.HIV/AIDS–adultprevalence rate:This entry gives an estimate of the percentage of adults (aged 15-49) living withHIV/AIDS. The adult prevalence rate is calculated by dividing the estimated number of adults living with HIV/AIDS at yearend by the total adult population atyearend.HIV/AIDS–people livingwith HIV/AIDS:HIV/AIDS–deaths:Nationality:Ethnic groups:Religions:Languages:Literacy:People note:This entry gives an estimate of all people (adults and children) aliveat yearend with HIV infection, whether or not they have developedsymptoms of AIDS.This entry gives an estimate of the number of adults and childrenwho died of AIDS during a given calendar year.This entry provides the identifying terms for citizens: noun and adjective.This entry provides a rank ordering of ethnic groups starting withthe largest and normally includes the percent of total population.This entry includes a rank ordering of religions by adherents starting with thelargest group and sometimes includes the percent of total population.This entry provides a rank ordering of languages starting with thelargest and sometimes includes the percent of total populationspeaking that language.This entry includes a definition of literacy and Census Bureau percentages forthe total population, males, and females. There are no universal definitions andstandards of literacy. Unless otherwise specified, all rates are based on the mostcommon definition - the ability to read and write at a specified age. Detailing thestandards that individual countries use to assess the ability to read and write isbeyond the scope of the Factbook. Information on literacy, while not a perfectmeasure of educational results, is probably the most easily available and valid forinternational comparisons. Low levels of literacy, and education in general, canimpede the economic development of a country in the current rapidly changing,technology-driven world.This entry includes miscellaneous demographic information ofsignificance not included elsewhere.STATISTICSAFRICAN PEN PALS26
EGYPT AND THE UNITED STATESECONOMIC STATISTICSGDP:GDP—real growthrate:GDP—per capita:GDP—compositionby sector:Population belowpoverty line:Labor force:Labor forceby occupation:Unemployment NITED STATESpurchasing power parity – 289.8 billion (2002 est.)purchasing power parity – 10.4 trillion (2002 est.)3.2% (2002 est.)2.45% (2002 est.)purchasing power parity - 4,000(2002 est.)purchasing power parity - 37,600(2002 est.)agriculture: 17%industry: 34%services: 49% (2001)agriculture: 2%industry: 18%services: 80% (2002)22.9% (FY 95/96 est.)12.7% (2001 est.)20.6 million (2001 est.)141.8 million (includes unemployed) (2001)agriculture: 29%industry: 22%services: 49%(2000 est.)managerial and professional 31%,technical, sales and administrativesupport: 28.9% services: 13.6%manufacturing, mining, transportation,and crafts: 24.1% farming, forestry,and fishing: 2.4%note: figures exclude the unemployed (2001)12% (2001 est.)5.8% (2002)revenues: 21.5 billionexpenditures: 26.2 billion,including capital expendituresof 5.9 billion (2001)revenues: 1.946 trillionexpenditures: 2.052 trillion, includingcapital expenditures of NA(2002 est.)textiles, food processing,tourism, chemicals, hydrocarbons,construction, cement, metalsleading industrial power in the world,highly diversified and technologicallyadvanced; petroleum, steel, motor vehicles,aerospace, telecommunications, chemicals,electronics, food processing, consumer goods,lumber, miningcotton, rice, corn, wheat, beans,fruits, vegetables; cattle, waterbuffalo, sheep, goatswheat, corn, other grains, fruits, vegetables,cotton; beef, pork, poultry, dairy products;forest products; fishSTATISTICSAFRICAN PEN PALS27
EGYPTUNITED STATES 7 billion f.o.b. (2002 est.) 687 billion f.o.b. (2002 est.)crude oil and petroleum products, cotton, textiles, metal products, chemicalscapital goods, automobiles, industrialsupplies and raw materials, consumer goods,agricultural productsU.S. 18.3%, Italy 13.7%, UK 8.4%(2002)Canada 22.4%, Mexico 13.9%, Japan 7.9%,UK 5.6%, Germany 4.1%, France,Netherlands (2001) 15.2 billion f.o.b. (2002 est.) 1.165 trillion f.o.b. (2002 est.)machinery and equipment,foodstuffs, chemicals, woodproducts, fuelscrude oil and refined petroleum products,machinery, automobiles, consumer goods,industrial raw materials, food and beveragesU.S. 16.9%, Germany 7.9%,Italy 6.7%, France 6.5%, China 5%,UK 4.1% (2002)Canada 19%, Mexico 11.5%, Japan 11.1%,China 8.9%, Germany 5.2%, UK, Taiwan(2001)Debt—external: 30.5 billion (2002 est.) 862 billion (1995 est.)Economic aid—recipient:ODA, 2.25 billion (1999)ODA, 6.9 billion (1997)Egyptian pound (EGP)U.S. dollar (USD)Egyptian pounds per U.S. dollar 4.5 (2002), 3.97 (2001), 3.47 (2000),3.4 (1999), 3.39 (1998British pounds per U.S. dollar 0.6661 (2002), 0.6944 (2001), 0.6596 (2000),0.6180 (1999), 0.6037 (1998),Canadian dollars per U.S. dollar 1.5693 (2002), 1.5488 (2001), 1.4851 (2000),1.4857 (1999), 1.4835 (1998),Japanese yen per U.S. dollar 125.39 (2002), 121.53 (2001), 107.77 (2000),113.91 (1999), 130.91 (1998),euros per US dollar 1.0626 (2002), 1.1175 (2001), 1.08540 (2000),0.93863 ers:Currency:Exchange rates:influencenote: financial institutions in France, Italy,and Germany and eight other European countries started using the euro on 1 January 1999with the euro replacing the local currency inconsenting countries for all transactionsin 2002STATISTICSAFRICAN PEN PALS28
EGYPT AND THE UNITED STATESGEOGRAPHY STATISTICSEGYPTUNITED STATESNorthern Africa, bordering theMediterranean Sea, between Libyaand the Gaza Strip, and the Red Seanorth of Sudan, and includes theAsian Sinai PeninsulaNorth America, bordering both the North Atlantic Ocean and the North Pacific Ocean, betweenCanada and Mexico27 00 N, 30 00 E38 00 N, 97 00 Wtotal: 1,001,450 sq kmland: 995,450 sq kmwater: 6,000 sq kmtotal: 9,629,091 sq kmland: 9,158,960 sq kmwater: 470,131 sq kmnote: includes only the 50 states andDistrict of Columbiaslightly more than three timesthe size of New Mexicoabout half the size of Russia; aboutthree-tenths the size of Africa; abouthalf the size of South America (or slightlylarger than Brazil); slightly larger thanChina; about two and a half times thesize of Western Europetotal: 2,665 kmborder countries: Gaza Strip 11 km,Israel 266 km, Libya 1,115 km,Sudan 1,273 kmtotal: 12,034 kmborder countries: Canada 8,893 km(including 2,477 km with Alaska),Mexico 3,141 kmnote: US Naval Base at Guantanamo Bay,Cuba is leased by the U.S. and thus remainspart of Cuba; the base boundary is 29 km2,450 km19,924 kmClimate:desert; hot, dry summerswith moderate wintersmostly temperate, but tropical in Hawaii andFlorida, arctic in Alaska, semiarid in the greatplains west of the Mississippi River, and aridin the Great Basin of the southwest; low wintertemperatures in the northwest are amelioratedoccasionally in January and February by warmchinook winds from the eastern slopes of theRocky MountainsTerrain:vast desert plateau interrupted byNile valley and deltavast central plain, mountains in west, hills andlow mountains in east; rugged mountains andbroad river valleys in Alaska; rugged, volcanictopography in HawaiiLocation:Geographiccoordinates:Area:Area comparative:Land boundaries:Coastline:STATISTICSAFRICAN PEN PALS29
Elevation extremes:Natural resources:Land use:Irrigated land:Natural hazards:Environment:current issuesEGYPTUNITED STATESlowest point:Qattara Depression -133 mhighest point:Mount Catherine 2,629 mlowest point:Death Valley -86 mhighest point:Mount McKinley 6,194 mpetroleum, natural gas, iron ore, phosphates, manganese, limestone, gypsum,talc, asbestos, lead, zinccoal, copper, lead, molybdenum,phosphates, uranium, bauxite, gold, iron,mercury, nickel, potash, silver, tungsten,zinc, petroleum, natural gas, timberarable land: 2.85%permanent crops: 0.47%other: 96.68% (1998 est.)arable land: 19.32%other: 80.46% (1998 est.)permanent crops: 0.22%33,000 sq km (1998 est.)214,000 sq km (1998 est.)periodic droughts; frequentearthquakes, flash floods, landslides;hot, driving windstorm calledkhamsin occurs in spring;dust storms, sandstormsair pollution resulting in acid rain inboth the U.S. and Canada; the U.S. is thelargest single emitter of carbon dioxidefrom the burning of fossil fuels; waterpollution from runoff of pesticides andfertilizers; very limited natural freshwater resources in much of the westernpart of the country require carefulmanagement; desertificationagricultural land being lost tourbanization and windblown sands;increasing soil salination belowAswan High Dam; desertification;oil pollution threatening coral reefs,beaches, and marine habitats; otherwater pollution from agriculturalpesticides, raw sewage, and industrialeffluents; very limited natural freshwater resources away from the Nilewhich is the only perennial watersource; rapid growth in populationoverstraining the Nile and naturalresourcesparty to: Air Pollution, Air PollutionNitrogen Oxides, Antarctic-EnvironmentalProtocol, Antarctic-Marine LivingResources, Antarctic Seals, AntarcticTreaty, Climate Change, Desertification,Endangered Species, EnvironmentalModification, Marine Dumping, MarineLife Conservation, Nuclear Test Ban,Ozone Layer Protection, Ship Pollution,Tropical Timber 83, Tropical Timber 94,Wetlands, Whalingsigned, but not ratified:Air Pollution-Persistent OrganicPollutants, Air Pollution-Volatile OrganicCompounds, Biodiversity, Climate ChangeKyoto Protocol, Hazardous WastesSTATISTICSAFRICAN PEN PALS30
EGYPTUNITED STATESEnvironment:internationalagreementsparty to: Biodiversity, Climate Change,Desertification, Endangered Species,Environmental Modification, HazardousWastes, Law of the Sea, Marine Dumping, Nuclear Test Ban, Ozone Layer Protection, Ship Pollution, Tropical Timber83, Tropical Timber 94, Wetlandssigned, but not ratified: ClimateChange-Kyoto Protocolparty to: Air Pollution, Air Pollution-NitrogenOxides, Antarctic-EnvironmentalProtocol, Antarctic-Marine Living Resources,Antarctic Seals, Antarctic Treaty, ClimateChange, Desertification, EndangeredSpecies, Environmental Modification,Marine Dumping, Marine Life Conservation,Nuclear Test Ban, Ozone Layer Protection, ShipPollution, Tropical Timber 83,Tropical Timber 94, Wetlands, WhalingGeography note:controls Sinai Peninsula, only landbridge between Africa and remainderof Eastern Hemisphere; controls SuezCanal, a sea link between Indian Oceanand Mediterranean Sea; size, andjuxtaposition to Israel, establish itsmajor role in Middle Eastern geopolitics; dependence on upstream neighbors;dominance of Nile basin issues; proneto influxes of refugeessigned, but not ratified: Air Pollution-Persistent Organic Pollutants, Air Pollution-VolatileOrganic Compounds, Biodiversity, ClimateChange-Kyoto Protocol, Hazardous Wastesworldʼs third-largest country by size (afterRussia and Canada) and by population (afterChina and India); Mt. McKinley is highest pointin North America and Death Valley the lowestpoint on the continentSTATISTICSAFRICAN PEN PALS31
EGYPT AND THE UNITED STATESPOPULATION STATISTICSEGYPTUNITED STATES74,718,797 (July 2003 est.)290,342,554 (July 2003 est.)0-14 years: 33.9% (male 12,964,852;female 12,346,808)15-64 years: 61.9% (male 23,375,037;female 22,865,190)65 years and over: 4.2% (male1,359,685; female 1,807,225)(2003 est.)0-14 years: 20.9% (male 31,098,473; female 29,675,712)15-64 years: 66.7% (male 96,628,469;female 97,061,559)65 years and over: 12.4% (male14,888,185; female 20,990,156)(2003 est.)total: 23.1 yearsmale: 22.8 yearsfemale: 23.5 years (2002)total: 35.8 yearsmale: 34.5 yearsfemale: 37.1 years (2002)1.88% (2003 est.)0.92% (2003 est.)Birth rate:24.36 births/1,000 population(2003 est.)14.14 births/1,000 population(2003 est.)Death rate:5.35 deaths/1,000 population(2003 est.)8.44 deaths/1,000 population(2003 est.)-0.23 migrant(s)/1,000 population(2003 est.)3.52 migrant(s)/1,000 population(2003 est.)Sex ratio:at birth: 1.05 male(s)/femaleunder 15 years: 1.05 male(s)/female15-64 years: 1.02 male(s)/female65 years and over:0.75 male(s)/femaletotal population:1.02 male(s)/female (2003 est.)at birth: 1.05 male(s)/femaleunder 15 years: 1.05 male(s)/female15-64 years: 1 male(s)/female65 years and over: 0.71 male(s)/femaletotal population:0.97 male(s)/female (2003 est.)Infant mortality rate:total: 35.26 deaths/1,000 live birthsfemale: 34.46 deaths/1,000live births (2003 est.)male: 36.02 deaths/1,000 live birthstotal: 6.75 deaths/1,000 live birthsmale: 7.46 deaths/1,000 live birthsfemale: 6.02 deaths/1,000 live births(2003 est.)Life expectancy rate:total population: 70.41 yearsmale: 67.94 yearsfemale: 73 years (2003 est.)total population: 77.14 yearsfemale: 80.05 years (2003 est.)male: 74.37 years3.02 children born/woman(2003 est.)2.07 children born/womanTotal population:Age structure:Median age:Population growth rate:Net migration rate:Total fertility rate:STATISTICSAFRICAN PEN PALS32
EGYPTUNITED STATESless than 0.1% (2001 est.)(2003 est.)0.6% (2001 est.)8,000 (2001 est.)900,000 (2001 est.)NA15,000 (2001 est.)noun: Egyptian(s)adjective: Egyptiannoun: American(s)adjective: AmericanEthnic groups:Eastern Hamitic stock (Egyptians,Bedouins, and Berbers) 99%, Greek,Nubian, Armenian, other European(primarily Italian and French) 1%white 77.1%, black 12.9%, Asian 4.2%,Amerindian and Alaska native 1.5%,native Hawaiian and other Pacificislander 0.3%, other 4% (2000)note: a separate listing for Hispanic is notincluded because the U.S. Census Bureauconsiders Hispanic to mean a person of LatinAmerican descent (including persons of Cuban,Mexican, or Puerto Rican origin) living in theU.S. who may be of any race or ethnic group(white, black, Asian, etc.)Religions:Muslim (mostly Sunni) 94%, CopticChristian and other 6%Protestant 56%, Roman Catholic 28%,Jewish 2%, other 4%, none 10% (1989)Arabic (official), English andFrench widely understood byeducated classesEnglish, Spanish (spoken by asizable minority)definition: age 15 and overcan read and writetotal population: 57.7%male: 68.3%female: 46.9% (2003 est.)definition: age 15 and overcan read and writetotal population: 97%male: 97%female: 97% (1979 est.)HIV/AID–adultprevalence rate:HIV/AIDS–people livingwith iteracy:People note:note: data for the U.S. are based on projectionsthat do not take into consideration the resultsof the 2000 censusSTATISTICSAFRICAN PEN PALS33
KENYA AND THE UNITED STATESECONOMICS STATISTICSKENYAUNITED STATESpurchasing power parity – 32 billion (2002 est.)purchasing power parity – 10.4 trillion (2002 est.)0.8% (2002 est.)2.45% (2002 est.)purchasing power parity - 1,020(2002 est.)purchasing power parity - 37,600(2002 est.)agriculture: 24%industry: 13%services: 63% (2001 est.)agriculture: 2%industry: 18%services: 80% (2002)50% (2000 est.)12.7% (2001 est.)Labor force:10 million (2001 est.)141.8 million (includes unemployed) (2001)Labor forc
CURRICULUM GUIDE CIA World Factbook STATISTICS. STATISTICS AFRICAN PEN PALS20 . in several European countries and
