Transcription
Fall 2020 Data Report
ABOUT THE HEALTHY MINDS STUDY (HMS)STUDY TEAMPrincipal Investigators: Daniel Eisenberg, PhD & Sarah Ketchen Lipson, EdM, PhD & Justin Heinze, PhDCo-investigator: Sasha Zhou, PhD, MPH, MHSAProject Managers: Amber Talaski, MPH & Akilah Patterson, MPHREPORT TEAMGraphic Designer: Sarah Fogel, University of Michigan School of Art and Design, Class of 2014Report Automation: Paul Schulz & Lingxi Li
TABLE OF CONTENTSSTUDY PURPOSE1STUDY DESIGN1ABOUT THIS REPORT2KEY FINDINGS3SAMPLE CHARACTERISTICS4PREVALENCE OF MENTAL HEALTH PROBLEMS5HEALTH BEHAVIORS AND LIFESTYLE7ATTITUDES AND BELIEFS ABOUT MENTAL HEALTH SERVICES8USE OF SERVICES9REFERENCES11APPENDIX: DESCRIPTIVE STATISTICS FOR SURVEY ITEMS12
STUDY PURPOSEThe Healthy Minds Study provides a detailed picture of mental health and related issues in college student populations.Schools typically use their data for some combination of the following purposes: to identify needs and priorities;benchmark against peer institutions; evaluate programs and policies; plan for services and programs; and advocate forresources.STUDY DESIGNThe Healthy Minds Study is designed to protect the privacy and confidentiality of participants. HMS is approved by theHealth Sciences and Behavioral Sciences Institutional Review Board at University of Michigan. To further protectrespondent privacy, the study is covered by a Certificate of Confidentiality from the National Institutes of Health.SAMPLINGEach participating school provides the HMS team with a randomly selected sample of currently enrolled students over theage of 18. Large schools typically provide a random sample of 4,000 students, while smaller schools typically provide asample of all students. Schools with graduate students typically include both undergraduates and graduate students in thesample.DATA COLLECTIONHMS is a web-based survey. Students are invited and reminded to participate in the survey via emails, which are timed toavoid, if at all possible, the first two weeks of the term, the last week of the term, and any major holidays. The datacollection protocol begins with an email invitation, and non-responders are contacted up to three times by email remindersspaced by 2-4 days each. Reminders are only sent to those who have not yet completed the survey. Each communicationcontains a URL that students use to gain access to the survey.NON-RESPONSE ANALYSISA potential concern in any survey study is that those who respond to the survey will not be fully representative of thepopulation from which they are drawn. In the HMS, we can be confident that those who are invited to fill out the surveyare representative of the full student population because these students are randomly selected from the full list ofcurrently enrolled students. However it is still possible that those who actually complete the survey are different inimportant ways from those who do not complete the survey. The overall participation rate for the fall 2020 study was 14%.It is important to raise the question of whether the 14% who participated are different in important ways from the 86%who did not participate. We address this issue by constructing non-response weights using administrative data on fullstudent populations. Most of the 36 schools in the fall 2020 HMS were able to provide administrative data about allrandomly selected students. The analysis of these administrative data, separated from any identifying information, wasapproved in the IRB application at Advarra and at each participating school. We used the following variables, whenavailable, to estimate which types of students were more or less likely to respond: sex, race/ethnicity, academic level, andgrade point average. We used these variables to estimate the response propensity of each type of student (based onmultivariate logistic regressions), and then assigned response propensity weights to each student who completed thesurvey. The less likely a type of student was to complete the survey, the larger the weight they received in the analysis,such that the weighted estimates are representative of the full student population in terms of the administrative variablesavailable for each institution. Finally, note that these sample weights give equal aggregate weight to each school in thenational estimates. An alternative would have been to assign weights in proportion to school size, but we decided that wedid not want our overall national estimates to be dominated by schools in our sample with very large enrollments.1
ABOUT THIS REPORTThis data report provides descriptive statistics (percentages, mean values, etc.) from the sample of respondents at yourinstitution for a set of key measures. In addition to the key measures highlighted in this report, an appendix is also includedwith descriptive statistics for each survey item (see below).APPENDIXThe appendix includes values for most measures in the three standard survey modules that are administered on allparticipating campuses: Demographics, Mental Health Status, and Mental Health Services Utilization/Help-Seeking. Foreach measure, the data tables display the following information: the value table for your institution, the 95% confidenceinterval for your institution's value, the value for the national sample, and an indicator if your institution's value issignificantly higher or lower than the national value. All values in the appendix have been weighted to be representative ofthe full student populations to which they refer (see Non-response Analysis). Also note that for some measures,respondents were allowed to check more than one response category (e.g., they might have gone to more than one typeof provider for mental health services), so the percentages sometimes add up to more than 100% across responsecategories. The 95% confidence intervals give a sense of how much uncertainty there is about each estimated value. Thisuncertainty exists because our estimates are based only on a random sample of students, rather than a complete censusof the student population. However, some schools that had less than 4,000 students (the typical requested sample size),provided their entire population. For consistency sake, these schools were not treated any differently than those schoolsthat provided a 4,000 student sample of their full population. Essentially, the confidence interval tells us that there is a95% probability that the true population value is within this particular range. Because both the school-level and nationalvalues are only estimates based on random sampling, we cannot say for certain that your institution's true value is aboveor below the national value. But in cases where we can say that there is a 95% or higher statistical probability that yourinstitution's value is higher or lower than the national value, we indicate this.EXPLORING YOUR DATA FURTHERThere are two options for exploring your data beyond what is in this report. First, you can use statistical software (e.g.,SPSS, Stata, etc.) to analyze the full data set for your students, which has been provided to your school. Second, you willbe able to log on to a user-friendly website with drop-down menus, at data.healthymindsnetwork.org.2
KEY FINDINGSThis section offers a quick look at results from key survey measures.Estimated values of selected measuresPercentage of studentsMajor depression (positive PHQ-9 screen)21%Depression overall, including major and moderate (positive PHQ-9 screen)39%Anxiety disorder (positive GAD-7 screen)34%Eating disorder (positive SCOFF screen)11%Non-suicidal self-injury (past year)23%Suicidal ideation (past year)13%Lifetime diagnoses of mental disorders41%Psychiatric medication (past year)24%Mental health therapy/counseling (past year)29%Any mental health therapy/counseling and/or psychiatric medication among students with positivedepression or anxiety screens (past year)53%Personal stigma: agrees with "I would think less of someone who has received mental healthtreatment."6%Perceived public stigma: agrees with "Most people would think less of someone who has receivedmental health treatment."45%3
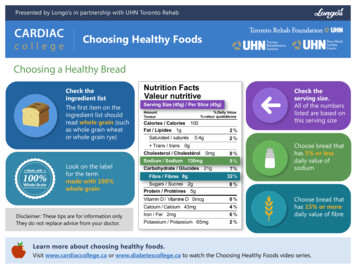
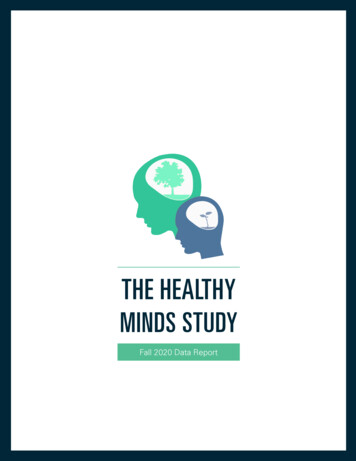
SAMPLE CHARACTERISTICS (N 32754)Age 0212223-2526-30Living /gender non-conforming41 Race/ethnicity80%WHIWhite or Caucasian70%BLAAfrican American/Black60%LATHispanic/LatinoAMINAmerican Indian/Alaskan NativeARABArab/Middle Eastern or Arab American72%50%40%ASIAN Asian/Asian American30%14%Campus residence hall2%Fraternity or sorority house5%Other university housing41%Off-campus, non-university housing34%Parent or guardian's home5%Other20%10%13%10%10%2%WHIBLALAT1%2%AMIN ARAB ASIAN PACOTHClass FormatINP51%All In-PersonHYB Hybrid50%41%Other60%50%50%ONL All Online40%OTH Other40%30%30%28%7%2%INPHYBONLOTHASSAssociate's degreeBABachelor's degreeMAMaster's degreeJDJDMDMDPHD PhD or equivalent20%20%4Pacific IslanderOTHDegree %OTHNon-degree studentOTH Other
PREVALENCE OF MENTAL HEALTH PROBLEMSDEPRESSION SCREENDepression is measured using the Patient Health Questionnaire-9 (PHQ-9), a nine-item instrument based on the symptomsprovided in the Diagnostic and Statistical Manual for Mental Disorders for a major depressive episode in the past twoweeks (Spitzer, Kroenke, & Williams, 1999). Following the standard algorithm for interpreting the PHQ-9, symptom levelsare categorized as severe (score of 15 ), moderate (score of 10-14), or mild/minimal (score 10).Severe depressionModerate depressionAny depression21%19%39%ANXIETY SCREENAnxiety is measured using the GAD-7, a seven-item screening tool for screening and severity measuring of generalizedanxiety disorder in the past two weeks (Spitzer, Kroenke, Williams, & Lowe, 2006). Following the standard algorithm forinterpreting the GAD-7, symptom levels are categorized as severe anxiety, moderate anxiety, or neither.Severe anxietyModerate anxietyAny anxiety16%18%34%EATING DISORDER SCREENLONELINESSEating disorders are measured usingthe written U.S. version of the SCOFF,a five-item screening tool designed toidentify subjects likely to have an eatingdisorder (Morgan, Reid, & Lacey, 1999).Loneliness is measured using the UCLA three-item Loneliness Scale (Hughes,Waite, Hawkley, & Cacioppo, 2004).Eating disorders11%How often do you feel.that you lackcompanionshipisolated fromothersleft out38%34%34% Hardly ever41%44%40% Some of the time21%22%26% Often5
SUICIDALITY AND SELF-INJURIOUS BEHAVIORSuicidal ideation (past year)Suicide plan (past year)Suicide attempt (past year)Non-suicidal self-injury (past year)13%6%1%23%LIFETIME DIAGNOSES OF MENTAL DISORDERSHave you ever been diagnosed with any of the following conditions by a health professional (e.g. primary care doctor, psychiatrist,psychologist, etc.)? (Select all that apply)28%Depression or other mood disorders (e.g., major depressive disorder, persistent depressive disorder)3%Bipolar (e.g., bipolar I or II, cyclothymia)31%Anxiety (e.g., generalized anxiety disorder, phobias)3%Obsessive-compulsive or related disorders (e.g., obsessive-compulsive disorder, body dysmorphia)8%Trauma and Stressor Related Disorders (e.g., posttraumatic stress disorder)7%Neurodevelopmental disorder or intellectual disability (e.g., attention deficit disorder, attention deficit hyperactivity disorder, intellectualdisability, autism spectrum disorder)3%Eating disorder (e.g., anorexia nervosa, bulimia nervosa)0%Psychosis (e.g., schizophrenia, schizo-affective disorder)1%Personality disorder (e.g., antisocial personality disorder, paranoid personality disorder, schizoid personality disorder)2%Substance use disorder (e.g., alcohol abuse, abuse of other drugs)59%No, none of theseACADEMIC IMPAIRMENTIn the past 4 weeks, how many days haveyou felt that emotional or mental difficultieshave hurt your academic performance?17% None29% 1 - 2 days26% 3 - 5 days28% 6 or more days6POSITIVE MENTAL HEALTHPositive mentalhealth38%Positive mental health (psychologicalwell-being) is measured using The FlourishingScale, an eight-item summary measure of therespondent's self-perceived success inimportant areas such as relationships,self-esteem, purpose, and optimism (Diener,Wirtz, Tov, Kim-Prieto, Choi, Oishi, &Biswas-Diener , 2009). The score ranges from8-56, and we are using 48 as the thresholdfor positive mental health.
HEALTH BEHAVIORS AND LIFESTYLEDrug useOver the past 30 days, have you used any of the following drugs? (Select all that apply)20%Marijuana1%Cocaine (any form, including crack, powder, or freebase)0%Heroin0%Opioid pain relievers (such as Vicodin, OxyContin, Percocet, Demerol, Dilaudid, codeine, hydrocodone, methadone, morphine) without aprescription or more than prescribed0%Benzodiazepenes0%Methamphetamines (also known as speed, crystal meth, or ice)1%Other stimulants (such as Ritalin, Adderall) without a prescription or more than prescribed0%MDMA (also known as Ecstasy or Molly)0%Ketamine (also known as K, Special K)1%LSD (also known as acid)2%Psilocybin (also known as magic mushrooms, boomers, shrooms)0%Kratom0%Athletic performance enhancers (anything that violates policies set by school or any athletic governing body)1%Other drugs without a prescription79%No, none of theseBinge drinkingExerciseThe following questions ask about how much you drink.A "drink" means any of the following:In the past 30 days, about how many hours per week on averagedid you spend exercising? (include any exercise of moderate orhigher intensity, where "moderate intensity" would be roughlyequivalent to brisk walking or bicycling)A 12-ounce can or bottle of beerA 4-ounce glass of wineA shot of liquor straight or in a mixed drinkDuring the last two weeks, how many times have youhad 4 (female), 5 (male), 4 or 5 (transgender/gendernon-conforming) or more drinks in a row? (among thosewith any alcohol use)40%None24%Once17%Twice13%3 to 5 times3%6 to 9 times2%10 or more times35%Less than 126%1-215%3-424%5 or more7
ATTITUDES AND BELIEFS ABOUT MENTAL HEALTH SERVICESKNOWLEDGEKnowledge of campus mental health resourcesPerceived need (past year)If I needed to seek professional help for my mental oremotional health, I would know where to go to accessresources from my school.In the past 12 months, I needed help for emotional ormental health problems such as feeling sad, blue,anxious or nervous.21%Strongly agree25%Strongly agree27%Agree18%Agree21%Somewhat agree17%Somewhat agree8%Somewhat disagree6%Somewhat disagree13%Disagree15%Disagree9%Strongly disagree19%Strongly disagreePerceived need (current)I currently need help for emotional or mental healthproblems such as feeling sad, blue, anxious or nervous.25%Strongly agree24%Agree28%Somewhat agree10%Somewhat disagree9%Disagree3%Strongly disagreeSCHOOL CLIMATEAnti-racismI believe my school actively works towards combatingracism within the campus community.84%8Agree
USE OF SERVICESPsychotropic medication use, all students (past year)In the past 12 months have you taken any of the following types of medications? Please count only those you took, or are taking, severaltimes per week. (Select all that apply)6%Psychostimulants (e.g., methylphenidate (Ritalin, or Concerta), amphetamine salts (Adderall), dextroamphetamine (Dexedrine), etc.)17%Anti-depressants (e.g., fluoxetine (Prozac), sertraline (Zoloft), paroxetine (Paxil), escitalopram (Lexapro), venlafaxine (Effexor), buproprion(Wellbutrin), etc.)1%Anti-psychotics (e.g., haloperidol (Haldol), clozapine (Clozaril), risperidone (Risperdal), olanzapine (Zyprexa), etc.)7%Anti-anxiety medications (e.g., lorazepam (Ativan), clonazepam (Klonopin), alprazolam (Xanax), buspirone (BuSpar), etc.)3%Mood stabilizers (e.g., lithium, valproate (Depakote), lamotrigine (Lamictal), carbamazapine (Tegretol), etc.)4%Sleep medications (e.g., zolpidem (Ambien), zaleplon (Sonata), etc.)2%Other medication for mental or emotional health76%NonePsychotropic medication use among students with positive depression or anxiety screens (past year)In the past 12 months have you taken any of the following types of medications? Please count only those you took, or are taking, severaltimes per week. (Select all that apply)9%Psychostimulants (e.g., methylphenidate (Ritalin, or Concerta), amphetamine salts (Adderall), dextroamphetamine (Dexedrine), etc.)26%Antidepressants (e.g., fluoxetine (Prozac), sertraline (Zoloft), paroxetine (Paxil), escitalopram (Lexapro), venlafaxine (Effexor), buproprion(Wellbutrin), etc.)2%Anti-psychotics (e.g., haloperidol (Haldol), clozapine (Clozaril), risperidone (Risperdal), olanzapine (Zyprexa), etc.)12%Anti-anxiety medications (e.g., lorazepam (Ativan), clonazepam (Klonopin), alprazolam (Xanax), buspirone (BuSpar), etc.)4%Mood stabilizers (e.g., lithium, valproate (Depakote), lamotrigine (Lamictal), carbamazapine (Tegretol), etc.)6%Sleep medications (e.g., zolpidem (Ambien), zaleplon (Sonata), etc.)4%Other medication for mental or emotional health65%NoneMental health care accessHow has your access to mental health care been affected by the COVID-19 pandemic?11%Much more difficult or limited access18%Somewhat more difficult or limited access27%No significant change in access1%Somewhat less difficult or limited access1%Much less difficult or limited access41%Don't know or not applicable (have not tried to access care)9
Mental health counseling/therapy, all students(past year)In the past 12 months have you received counselingor therapy for your mental or emotional health from ahealth professional (such as psychiatrist, psychologist,social worker, or primary care doctor)?Informal help-seekingIn the past 12 months have you received counseling or support foryour mental or emotional health from any of the following sources?(Select all that apply)14%Roommate40%Friend (who is not a roommate)30%Significant other37%Family member4%Religious counselor or other religious contactMental health counseling/therapy amongstudents with positive depression or anxietyscreens (past year)2%Support group1%Other non-clinical sourceIn the past 12 months have you received counseling ortherapy for your mental or emotional health from ahealth professional (such as psychiatrist, psychologist,social worker, or primary care doctor)?35%None of the above4%Faculty member/professor2%Staff member29%Barriers to help-seeking40%In the past 12 months, which of the following factors have causedyou to receive fewer services (counseling, therapy, or medications)for your mental or emotional health than you would have otherwisereceived? (Select all that apply)Mental health counseling/therapy, all students(lifetime)4%I haven't had the chance to go but I plan to40%No need for services17%Financial reasons (too expensive, not covered by insurance)18%Not enough time13%Not sure where to go7%Difficulty finding an available appointment21%Prefer to deal with issues on my own or with support fromfamily/friendsMental health counseling/therapy amongstudents with positive depression or anxietyscreens (lifetime)2%Privacy concerns4%People providing services don't understand meHave you ever received counseling or therapy for mentalhealth concerns?7%Other15%No barriersHave you ever received counseling or therapy for mentalhealth concerns?48%62%10
REFERENCESMENTAL HEALTH SCREENSCenter for Collegiate Mental Health (2015). CCAPS User Manual. University Park, PA.Diener, E., Wirtz, D., Tov, W., Kim-Prieto, C., Choi, D., Oishi, S., & Biswas-Diener, R. (2009). New measures of well-being:Flourishing and positive and negative feelings. Social Indicators Research, 39, 247-266.Morgan, J. F., Reid, F., & Lacey, J. H. (1999). The SCOFF questionnaire: assessment of a new screening tool for eatingdisorders BMJ, 319(7223), 1467-1468.Spitzer, R. L., Kroenke, K., Williams, J. B., & Patient Health Questionnaire Primary Care Study Group. (1999). Validation andutility of a self-report version of PRIME-MD: the PHQ primary care study. JAMA, 282(18), 1737-1744.Spitzer, R. L., Kroenke, K., Williams, J. B., & Löwe, B. (2006). A brief measure for assessing generalized anxiety disorder:the GAD-7. Archives of Internal Medicine, 166(10), 1092-1097.Hughes, M.E., Waite, L.J., Hawkley, L.C., & Cacioppo, J.T. (2004). A short scale for measuring loneliness in large surveys:Results from two population-based studies. Research on Aging, 26(6), 655-672.SELECTED ARTICLES PUBLISHED WITH HMS DATAEisenberg, D., Golberstein, E., Hunt, J. (2009). Mental Health and Academic Success in College. B.E. Journal of EconomicAnalysis & Policy 9(1) (Contributions): Article 40.Eisenberg, D., Hunt, J.B., Speer, N., Zivin, K. (2011). Mental Health Service Utilization among College Students in theUnited States. Journal of Nervous and Mental Disease 199(5): 301-308.Eisenberg, D., Chung, H. (2012). Adequacy of Depression Treatment in College Student Populations. General HospitalPsychiatry 34(3):213-220.Eisenberg, D., Speer, N., Hunt, J.B. (2012). Attitudes and Beliefs about Treatment among College Students with UntreatedMental Health Problems. Psychiatric Services 63(7): 711-713.Eisenberg, D., Hunt, J.B., Speer, N. (2013). Mental Health in American Colleges and Universities: Variation across StudentSubgroups and across Campuses. Journal of Nervous and Mental Disease 201(1): 60-67.Lipson, S., Gaddis, S.M., Heinze, J., Beck, K., Eisenberg, D. (2015). Variations in Student Mental Health and TreatmentUtilization Across US Colleges and Universities. Journal of American College Health, 63(6): 388-396.Lipson, S., Zhou, S., Wagner, B., Beck, K., Eisenberg, D. (2016). Major differences: Variations in student mental health andservice utilization across academic disciplines. Journal of College Student Psychotherapy, 30(1), 23-41.Lipson, S, Lattie, E, & Eisenberg, D (2018). Increased rates of mental health service utilization by U.S. college students:10-year population-level trends (2007-2017). Psychiatric Services, 70(1), 60-63.Goodwill, J., & Zhou, S. (2019). Association between perceived public stigma and suicidal behaviors among collegestudents of color in the U.S. Journal of Affective Disorders, 262, 1-7.Email: healthyminds@umich.eduWebsite: www.healthymindsnetwork.org11
APPENDIX: DESCRIPTIVE STATISTICS FOR SURVEY ITEMSMEASUREAll Students95% CONFIDENCE INTERVALRespondent CharacteristicsSampleNResponse Rate3275414%GenderFemaleMaleTransgender/gender non-conforming55%42%0%(54%, 56%)(42%, 43%)(0%, 1%)Race/EthnicityWhite / CaucasianBlack / African AmericanHispanic / LatinoAmerican IndianArab / Middle EasternAsian / Asian AmericanPacific IslanderOther72%10%13%2%1%10%1%2%(71%, 73%)(10%, 11%)(13%, 14%)(2%, 2%)(1%, 2%)(9%, 10%)(1%, 1%)(1%, 2%)CountryUS Resident / CitizenInternational96%4%(96%, 96%)(4%, 4%)ResidenceCampus residence hallFraternity / sorority houseOther campus housingOff-campus / non-university housingParent or guardian's homeOther14%2%5%41%34%5%(14%, 15%)(2%, 2%)(4%, 5%)(40%, 42%)(33%, 34%)(4%, 5%)Academic levelAssociatesBachelorsMastersJDMDPhD or equivalentOtherNon-degree28%50%9%1%1%6%5%3%(27%, 29%)(50%, 51%)(8%, 9%)(1%, 1%)(1%, 1%)(6%, 6%)(5%, 6%)(2%, 3%)3%(2%, 3%)Age18-2223-2526-3031 63%13%11%14%(62%, 63%)(12%, 13%)(10%, 11%)(14%, 15%)Highest educational attainment of eitherparentLess than high school degreeHigh school degreeCollege degreeGraduate degree5%25%41%29%(4%, 5%)(25%, 26%)(40%, 41%)(28%, 30%)Ever trained for or served in the military(Armed Forces, Reserves, or NationalGuard)12
MEASUREAll Students95% CONFIDENCE INTERVALRespondent CharacteristicsReligiosityVery importantImportantNeutralUnimportantVery unimportant23%22%25%14%16%(22%, 24%)(22%, 23%)(24%, 26%)(13%, 15%)(15%, 16%)Current financial situationAlways stressfulOften stressfulStressfulRarely StressfulNever Stressful16%24%35%18%6%(16%, 17%)(23%, 25%)(35%, 36%)(18%, 19%)(6%, 7%)Financial situation growing upAlways stressfulOften stressfulStressfulRarely StressfulNever Stressful12%18%29%27%14%(12%, 13%)(17%, 18%)(28%, 30%)(27%, 28%)(13%, 14%)Relationship statusSingleIn a relationshipMarried or domestic partnershipDivorced50%33%15%1%(49%, 51%)(32%, 34%)(14%, 15%)(1%, 2%)Sexual orientationHeterosexualBisexualGay / lesbianQueerQuestioningOther81%10%3%3%3%3%(80%, 81%)(10%, 11%)(2%, 3%)(2%, 3%)(3%, 3%)(3%, 4%)2%4%15%3%(1%, 2%)(3%, 4%)(14%, 15%)(3%, 4%)2%(2%, 2%)2%0%1%1%2%0%2%5%(2%, 2%)(0%, 0%)(1%, 1%)(1%, 1%)(2%, 3%)(0%, 0%)(2%, 3%)(4%, 5%)Chronic diseaseDiabetesHigh blood pressureAsthmaThyroid disease (e.g., hypothyroid orhyperthyroid)Gastrointestinal disease (e.g., Crohn'sDisease, Ulcerative Colitis)ArthritisSickle cell anemiaSeizure disorders (e.g., epilepsy)CancersHigh cholesterolHIV/AIDSOther autoimmune disorder (please specify)Other chronic disease (please specify)Race/Ethnicity SubcategoriesBlackAfricanAfrican AmericanAfrican CarribeanAfro-Latina/o/xOther17%73%11%5%6%(15%, 19%)(70%, 75%)(9%, 12%)(4%, 6%)(4%, 7%)13
MEASUREAll Students95% CONFIDENCE INTERVALRace/Ethnicity SubcategoriesAsianEast Asian (eg Chinese, Japanese, Korean,Taiwanese)Southeast Asian (eg Cambodian,Vietnamese, Hmong)South Asian (eg Indian, Pakistani, Nepalese,Sri Lankan)Filipina/o/xOtherHispanicMexican/Mexican AmericanCentral AmericanSouth AmericanCarribeanOther46%(44%, 49%)19%(16%, 22%)22%(20%, 25%)15%2%(13%, 17%)(2%, 3%)49%12%18%14%11%(46%, 51%)(10%, 14%)(16%, 20%)(13%, 16%)(10%, 12%)Mental Health MeasuresPositive Mental HealthFlourishing Scale (8-56)43.2(43.0, 43.4)Depression (PHQ-9)Overall score (0-27)In moderate range (10-14)In moderately severe range (15-19)In severe range (20-27)Major depression (positive screen)Other depression (positive screen)Depression overall8.917%10%8%21%19%39%(8.8, 9.0)(16%, 17%)(10%, 11%)(8%, 9%)(20%, 21%)(18%, 19%)(38%, 40%)Impairment from depression (1)Not difficult at allSomewhat difficultVery difficultExtremely difficult23%51%17%8%(22%, 24%)(50%, 52%)(17%, 18%)(8%, 9%)Generalized anxiety (GAD-7)Overall score (0-21)In moderate range (10-14)In severe range (15-21)Probable anxiety disorder (positive screen)7.718%16%34%(7.5, 7.8)(17%, 19%)(15%, 17%)(33%, 35%)Depression/AnxietyDepression or anxiety disorder47%(46%, 48%)Disordered eating and body imageProbable eating disorder (3 on SCOFF)Need to be very thin to feel good about selfThink you are very underweight11%25%2%(10%, 11%)(24%, 26%)(1%, 2%)Academic impairment from mentalhealth, past 4 weeks (2)None1-2 days3-5 days6 or more days17%29%26%28%(16%, 18%)(28%, 30%)(26%, 27%)(27%, 28%)(1) How difficult have these problems made it for you to do your work, take care of things at home, or get along with other people?(2) How many days have you felt that emotional or mental difficulties have hurt your academic performance?14
MEASUREAll Students95% CONFIDENCE INTERVALSelf-Injury and SuicideNon-suicidal self-injury, past yearAnyCutting selfBurning selfPunching or banging selfScratching selfPulling one's hairBiting selfInterfering with wound healingCarving words or symbols in skinRubbing sharp objects on skinPunching or banging wall or objectOther23%5%2%10%8%8%4%8%1%3%7%1%(22%, 24%)(5%, 6%)(1%, 2%)(9%, 10%)(8%, 9%)(8%, 8%)(4%, 5%)(8%, 9%)(1%, 1%)(2%, 3%)(7%, 8%)(1%, 2%)Frequency of self-injury, past year(among those with any)Once or twiceOnce a month or less2 or 3 times a monthOnce or twice a week3 to 5 days a weekNearly everyday, or everyday52%25%13%6%3%1%(50%, 54%)(24%, 27%)(12%, 14%)(5%, 7%)(2%, 3%)(1%, 2%)13%(13%, 14%)6%(5%, 6%)1%(1%, 2%)SuicidalitySeriously thought about attempting suicide,past yearMade a plan for attempting suicide, pastyearAttempted suicide, past year15
MEASUREAll Students95% CONFIDENCE INTERVALPrevious Diagnoses of Mental Disorders16Mental disordersAny41%(40%, 42%)Depression or mood disorderAnyMajor depressionDysthymiaPremenstrual dysphoric disorder28%14%2%1%(27%, 29%)(14%, 15%)(2%, 3%)(1%, 1%)Bipolar and related disordersAnyBipolar I disorderBipolar II disorderCyclothymic disorder3%1%1%0%(3%, 3%)(1%, 1%)(1%, 2%)(0%, 0%)Anxiety disorderAnyGeneralized anxiety disorderPanic disorderAgorophobiaSpecific phobiaSocial anxiety disorder or social phobia31%25%5%0%1%7%(30%, 32%)(24%, 25%)(4%, 5%)(0%, 1%)(0%, 1%)(6%, 7%)Obsessive-compulsive or relateddisordersAnyObsessive-compulsive disorder5%4%(4%, 5%)(3%, 4%)Trauma and stressor related disordersAnyPosttraumatic stress disorderAcute stress disorder8%7%1%(7%, 8%)(6%, 7%)(0%, 1%)Psychotic disorderAnySchizophrenia0%0%(0%, 1%)(0%, 0%)Neurodevelopmental disorder orintellectual disabilityAnyADHDOther intellectual disabilityAutism spectrum disorder7%6%0%1%(7%, 8%)(6%, 7%)(0%, 0%)(1%, 2%)Eating disorderAnyAnorexia nervosaBulimia nervosaBinge eating disorder3%2%1%1%(3%, 4%)(1%, 2%)(1%, 1%)(1%, 1%)Personality disorderAny1%(1%, 2%)Substance abuse disorderAnyAlcohol abuse disorder2%1%(1%, 2%)(1%, 1%)
MEASUREAll Students95% CONFIDENCE INTERVALHealth Behaviors and LifestyleSubstance use, past 30 daysCigarettesVape pen or E-CigaretteMarijuanaCocaineHeroinOpioid pain relievers without a prescriptionor more than prescribedBenzodiazepenesMethamphetaminesOther stimulants without a prescription ormore than prescribedMDMA (also known as Ecstasy or Molly)Ketamine (also known as K, Special K)LSD (also known as acid)Psilocybin (also known as magicmushrooms, boomers, shrooms)KratomAthletic performance enhancers (anythingthat violates policies set by school or anyathletic governing body)Other drugs without a prescription7%15%20%1%0%0%(6%, 7%)(14%, 15%)(19%, 21%)(1%, 1%)(0%, 0%)(0%, 1%)0%0%1%(0%, 1%)(0%, 0%)(1%, 2%)0%0%1%2%(0%, 0%)(0%, 0%)(1%, 1%)(1%, 2%)0%0%(0%, 1%)(0%, 0%)1%(1%, 1%)In the past 2 weeks, about how manytimes did you have 4 [female]/5 [male]/4or 5 [transgender/gendernon-conforming] or more alcoholicdrinks in a row? (1 drink is a can of beer,a glass of wine, a wine cooler, a shot ofliquor, or a mixed drink.)More than one timeMore than 3 times28%9%(28%, 29%)(8%, 9%)Time studying/doing homeworkLess than 1 hour/week1-2 hours/week3-5 hours/week6-10 hours/week11-15 hours/week16-20 hours/weekMore than 20 hours
ARAB Arab/Middle Eastern or Arab American AMIN American Indian/Alaskan Native LAT Hispanic/Latino BLA African American/Black WHI White or Caucasian 5% Other 34% Parent or guardian's home 41% Off-campus, non-university housing 5% Other university housing 2% Fraternity or sorority house 14% Campus residence hall Living arrangement ASS BA MA JD MD .