Transcription
Route 3Arterial Management PlanJuly 21, 2015
Study Work Group Members Spotsylvania CountyVirginia Department of TransportationNational Park ServiceMichael Baker InternationalYOU!Route 3 Arterial Management Plan2
Meeting Agenda Purpose of StudyExisting Conditions and IssuesEstimate of Future ConditionsProviding Your InputNext StepsRoute 3 Arterial Management Plan3
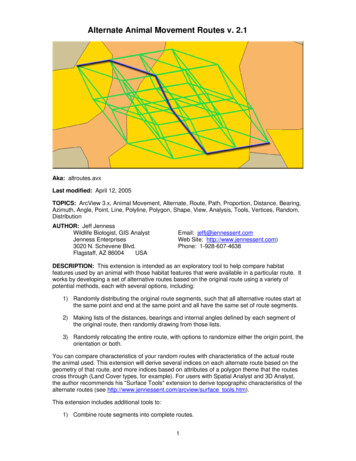
Study CorridorRoute 3 between Route 20 (at Orange County Line) and Gordon RoadRoute 3 Arterial Management Plan4
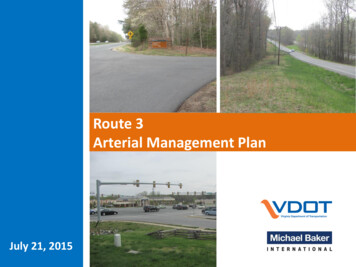
Arterial Management PlansROUTE 17 – STAFFORD COUNTY – JUSTWEST OF I-95 IN 1994Route 3 Arterial Management Plan5
Arterial Management PlansROUTE 17 – STAFFORD COUNTY – JUSTWEST OF I-95 IN 2002Route 3 Arterial Management Plan6
Arterial Management PlansROUTE 17 – STAFFORD COUNTY – JUSTWEST OF I-95 IN 2006Route 3 Arterial Management Plan7
Arterial Management PlansROUTE 17 – STAFFORD COUNTY – JUSTWEST OF I-95 IN 2011Route 3 Arterial Management Plan8
Arterial Management PlansROUTE 17 – STAFFORD COUNTY – JUSTWEST OF I-95 IN 2013Route 3 Arterial Management Plan9
Arterial Management PlansROUTE 3/SALEM CHURCH ROAD AREARoute 3 Arterial Management Plan10
Arterial Management PlansROUTE 3/HARRISON ROAD AREARoute 3 Arterial Management Plan11
Purpose of Arterial Management PlanPilot StudyPurpose:To ensure the safety and preserve the capacity of theCommonwealth’s arterial highway network without wide scaleroad widenings while accommodating economic development.Project VisionDevelop a joint state and local strategy to guide development andtransportation decisions along Route 3 between Gordon Road andthe Orange County line.Project Goals– Develop a streamlined and repeatable Arterial ManagementPlan (AMP) process– Develop an AMP methodologyRoute 3 Arterial Management Plan12
Arterial Management Plan BenefitsLocal Governments (Towns, Cities, and Counties): Safer arterial street system Allow localities to maximize densities allowed in Comprehensive/Master Plans Maintain corridors’ economic development potential by having a cohesive plan Aid in the land development process by providing local government/VDOTexpectations before a developer’s plans are created Assist with projects being programmed since they are identified in an approved plan Save dollars by reducing the need to retrofit improvements in the futureVDOT Result in a safer arterial street system Preserve corridor capacity and efficiency Maintain Commonwealth’s mobility and thus economic competitiveness Lower long-term infrastructure capital and maintenance costsRoute 3 Arterial Management Plan13
Arterial Management Plan BenefitsLand Owners Blueprint for developers, adherence to plan quicker approval from VDOT/LocalGovernment Maintain size of market area (based on travel time to businesses) Better allow land owners to maximize densities allowed in Comprehensive/MasterPlans Maintain a corridors’ economic development potential by having a cohesive planRegional and Local Travelers Safer trips Quicker trips Easy access to destinationsRoute 3 Arterial Management Plan14
Arterial Management ExamplesInterparcel ConnectionsUS 360 in Chesterfield, VASuperstreet ConceptNorth CarolinaStaggered EntrancesUS 301 in MarylandRoute 3 Arterial Management Plan15
Summary of Existing Conditions Field ObservationsTraffic Data (Collected April 2014)– Turning Movement Counts– Average Daily Traffic (ADT)– Speed DataCrash and Data AnalysisInventory of Existing Access PointsOperational AnalysisPlanned Area ImprovementsRoute 3 Arterial Management Plan16
Existing Conditions – Site ReviewSight DistanceWide- Medians at SignalsRoute 3 Arterial Management PlanRolling TerrainGrade Differential atCrossovers17
Existing Conditions – Site ReviewHistoric ResourcesRoute 3 Arterial Management Plan18
Existing Conditions – Traffic Data Adjacent land uses generateapprox. 100,000 trips per day Average Daily Traffic – 23,000 to41,000 vehicles per day Truck % varies from 2% to 8% AM peak hour 7:00-8:00 AMPM peak hour 4:45-5:45 PM Average speeds generally exceedspeed limit slightly throughout thecorridor except between HarrisonRoad and Gordon RoadRoute 3 Arterial Management Plan19
Traffic Data CollectionTurning MovementCount LocationsINTERSECTIONRoute 3 Arterial Management PlanNumberName1Constitution Hwy / Route 32Fox Gate Drive / Route 33Brock Road / Route 34Black Meadow Rd / Route 35Orange Plank Rd / Route 36Wilderness Road / Route 37Stuart Rd / Bullock Rd / Route 38Elys Ford Rd / Route 39River Road / Route 310Nine Mile Run Dr / Route 311McLaws Dr / Route 312Andora / Corter Avenue/ Route 313Big Ben /Spotswood Furnace / Route 314Harrison Rd / Route 315Gordon Rd / Route 320
Existing Conditions- Traffic OperationsLOSINTERSECTIONExisting Peak HourLOSNumberNameAMPM1Constitution Hwy / Route 3CC2Fox Gate Drive / Route 3AA3Brock Road / Route 3BB4Black Meadow Rd / Route 3AA5Orange Plank Rd / Route 3FC6Wilderness Road / Route 3AA7Stuart Rd / Bullock Rd / Route 3AA8Elys Ford Rd / Route 3CC9River Road / Route 3AA10Nine Mile Run Dr / Route 3AA11McLaws Dr / Route 3AA12Andora / Corter Avenue/ Route 3DC13Big Ben /Spotswood Furnace / Route 3EE14Harrison Rd / Route 3BC15Gordon Rd / Route 3ACRoute 3 Arterial Management PlanAFree flowBStable flowCAverage FlowDRestricted FlowECongestedFSeverely Congested21
Inventory of Existing Access PointsAs number ofdriveways increase,crashes increaseAdequately SpacedFull Median CrossoversAs number ofdriveways increase,capacity decreasesClosely SpacedFull Median CrossoversClosely SpacedAccess PointsRoute 3 Arterial Management Plan22
Inventory of Existing Access PointsMinimum Centerline to Centerline Spacing al Arterial (35-45 mph) - xxx’Principal Arterial ( 50 mph) – xxx’2640’RoadwayNumber ofAccess PointsAccess PointsPer MileRoute 322225Route 3 Arterial Management PlanPer VDOT Spacing GuidelinesCompliantNonCompliant11111123
Existing Conditions - CrashesCrash Analysis Crash Severity- Identifies the fatalitiesand injury types Crash Location ScatterPlots- Identifies hot spots andcrash patternsRoute 3 Arterial Management Plan24
Corridor Crash Summary 1% 1%Crash TypeCrash SeverityRear End 1%Angle3%1% 1%Head OnSideswipe - Same Direction7%Sideswipe – Opposite Direction39%22%35%Fixed Object - In RoadNon-Collision64%Fixed Object - Off Road2%2%Pedestrian FatalityVehicle Occupant FatalityDeerPedestrian Injury6%Pedestrian18% 1%1%Vehicle Occupant InjuryBacked IntoNo Injury/FatalityMiscellaneous or OtherCrash Rate for RURAL Route 3(west of Andora Dr.)NationalAverage8577Crash Rate for URBAN Route 3(east of Andora Dr.)NationalAverage183120Crash Rates are per 100 million vehicle miles traveledRoute 3 Arterial Management Plan25
Corridor Crash SummaryRear EndCrash Type- IntersectionsAngle2% 2%Head on1%11%Sideswipe - Same direction of travel1%5%Fixed object in road (from ditch to ditch)2%50%26%Non-Collision, overturned, jacknifed or ranoff road (no object)Fixed object off road (from outside of ditch)DeerMiscellaneous or otherThe number of crashes is higher at signalized intersections in thecorridor:– Intersections: 4 crashes per year per unsignalized intersection– Signalized intersections: 6 crashes per year per intersectionRoute 3 Arterial Management Plan26
Stakeholder Input Summary5 Stakeholder Interviews – 2 Private Citizens, 3 County RepresentativesHighlighted Input Pro-developmentNational Park Service influence concernsWant a regional approach–– Route 3 by-passI-95 capacity and access improvementsAdditional Input Concerned about congestion––––at intersections leading to schoolsfrom new developmentfrom Orange County thru trafficPortions of eastern Route 3 that are denselydeveloped impacting eastern end of this studyarea (east of Harrison Crossing)Route 3 Arterial Management Plan Varying thoughts on preferred type ofdevelopmentVarying thoughts on where roadwayimprovements are neededConcerns about the effectiveness of theproposed road from Central Park toGordon Road to relieve congestion onRoute 3Varying thoughts on importance of needfor:–––––––Operational ImprovementsGeometric ImprovementsAccess ImprovementsSafety ImprovementsCapacity ImprovementsMultimodal ImprovementsPolicy Changes27
Future Conditions – Land UseFuture Land Use- Coordination with County Staff- Spotsylvania County Comprehensive Plan- Planned and Approved Developments- Zoning Maps- OrdinancesRoute 3 Arterial Management Plan28
Future Conditions – Land UseRoute 3 Arterial Management Plan29
Future Conditions – Future TripsTotal Assumed New Development for theRoute 3 Corridor:–––––Commercial: 376,000 sq. ft. 29,664 TripsIndustrial: 20,000 sq. ft. 139 TripsOffice: 709,000 sq. ft. 8,067 TripsNew Dwelling Units: 2,078 19,790 TripsOther: 265,000 sq. ft. 2,474 TripsTotal Additional Trips 60,134Route 3 Arterial Management Plan30
How Can YOU Help?Ask US questions and provide YOUR input. 2014 Existing Conditions (Board 1) Confirm existing conditions data.What traffic and safety related issues concern you? 2040 Future Development Assumptions (Board 2) Provide input on assumed future development?What types of developments do you envision and where? Priority of Improvement Types Indicate which type of improvements are a priority for you?Route 3 Arterial Management Plan31
Study Update & Next StepsNext Steps– Finish Future Conditions (Unmanaged Condition)– Develop Recommendations (Managed Condition)– Another Public Meeting– Seek Adoption of Plan by Board of SupervisorsRoute 3 Arterial Management Plan32
ScheduleYOU AREHERE2014Study Work Group & Public MeetingsData Collection2014 Existing Conditions2040 Future Land UseToolbox of Alternatives2040 Traffic Volume Forecasting2040 Traffic Volume AnalysisTransportation Plan RecommendationsReport & MethodologyIndicates Public MeetingIndicates Working MeetingRoute 3 Arterial Management berSeptemberAugustJulyJuneMayAprilTask2015
Questions?Contacts for additional questionsor to provide comments:Zach HarrisMichael Baker ob WilliamsVDOT Central ovRoute 3 Arterial Management Plan34
ROUTE 17 -STAFFORD COUNTY -JUST WEST OF I-95 IN 1994. Route 3 Arterial Management Plan . Study Work Group & Public Meetings Data Collection 2014 Existing Conditions 2040 Future Land Use . VDOT Central Office 804-371-4868 robertj.williams@vdot.virginia.gov. Title: VDOT_Arterial Management_ppt template