Transcription
Proceedings of the International Conference on Industrial Engineering and Operations ManagementIstanbul, Turkey, March 7-10, 2022Distribution Route Optimization of Newspaper PublishingCompany with Saving Matrix Method and Milk-Run SystemAdindha Karunia Ciptaning Pragowoaji, Iksan Widiantoro Restuaji,and Yusuf Fardhan NurdiantoIndustrial Engineering Department, Faculty of Engineering, Universitas Sebelas MaretJl. Ir. Sutami, 36A, Surakarta, Indonesiaadindha.karunia.c.p@student.uns.ac.id, student.uns.ac.idArinda Soraya PutriIndustrial Engineering Department, Faculty of Engineering,Universitas Muhammadiyah SurakartaJl. Ahmad Yani Tromol Pos 1, Pabelan, Kartasura, Surakarta, Indonesiaasp835@ums.ac.idWahyudi SutopoUniversity Centre of Excellence for Electrical Energy Storage Technology,Universitas Sebelas MaretJl. Ir. Sutami, 36 A, Surakarta, oResearch Group Industrial Engineering and Techno-Economic, Industrial EngineeringDepartment, Faculty of Engineering, Universitas Sebelas MaretJl. Ir. Sutami, 36 A, Surakarta, Indonesiayuniaristanto@ft.uns.ac.idAbstractThe rapidly growing communication technology brings not only an opportunity but also a challenge to the printingindustry. Consumers are significantly moving from conventional media to digital. Determining the optimaldistribution route to ensure a smooth distribution flow is crucial to retaining customers by providing an optimalservice. One of the limitations in the distribution process is related to vehicle capacity (Capacitated Vehicle RoutingProblem). Previous research has succeeded in determining a combined route between three newspaper industrycompanies in Surakarta, but each company still needs optimal independent routes. Using the saving matrix methodwith the milk-run system, this study aims to determine the optimal route for distributing newspapers independently,focusing on one of the newspaper companies by considering three conditions: when demand increases, decreases, andis static. Nearest Insert and Nearest Neighbor methods are used to optimize the distribution route. The results showthat each of the three conditions has two optimal routes. When the demand is static, the total monthly cost is IDR618,750. When the demand increases, the total cost per month will be IDR 562,650, and when the demand decreases,the total cost per month will be IDR 592,350/month.KeywordsCapacitated Vehicle Routing Problem (CVRP), Supply Chain Management, Distribution, Saving Matrix, Milk-Run IEOM Society International
Proceedings of the International Conference on Industrial Engineering and Operations ManagementIstanbul, Turkey, March 7-10, 20221. IntroductionThe presence of communication technology that is snowballing has become a breath of fresh air for the manufacturingindustry in improving the quality of the company's internal and external communications. However, for the printingmedia industry, the presence of communication technology is not only an opportunity but also a challenge to survivein the digital era (Prihanto, 2018).The rapid development of communication and information technology has given birth to new digital-based media thathave changed people's mass media consumption (Aliudin & Arisanty, 2018). Consumers are significantly movingfrom conventional media to digital. Print media lost their readers drastically, especially from the young group (Aliudin& Arisanty, 2018). Quoted from Prihanto (2018), based on a survey conducted by Nielsen Consumer & Media Viewon 17 thousand respondents from a total population of 54 million people, it shows that digital media readers inIndonesia are way more in number than print media readers. In 4 years (2013-2017), newspaper buyers continued todecline due to public perception that information should be obtained for free. The rate of personal newspaperpurchases, which reached 28% in 2013, decreased to 20% in the third quarter of 2017. There was an 8% decrease indemand during those four years.One of the newspaper industries affected by changes in people's behavior is newspaper publishing company. Thenewspaper industry had relatively short cycle times, tight delivery deadlines, and no inventory system (Riskadayantiet al., 2019). Daily newspapers are now generally only published in the morning. Although evening newspapers usedto be quite common, they are now hard to find. Now, because it is published in the morning, the price of the newspaperwill tend to fall as the day goes on. Therefore, the smooth distribution of newspapers in the morning is crucial. Dueto this pressure, most of the production and distribution processes are usually carried out at night and in a short time.The results of a case study at a newspaper company in Surakarta illustrate several problems, one of which is a slowdistribution process due to the wrong route determination (Saputra et al., 2018). This problem is caused by the VehicleRouting Problem (VRP), which determines the route with the minimum cost from the depot to the customer withdifferent requests (Amri et al., 2014).In the research, Jodinesa et al. (2019) has succeeded in determining a combined route between three newspaperindustry companies in Surakarta, namely PT. Aksara Solopos, Suara Merdeka, and Jawa Pos. That study proposedroutes and plans for distributing newspapers where newspaper products from the three companies will be collected atPT. Aksara Solopos was then distributed to all agents in the Surakarta area. This distribution plan is able to save thetotal distribution cost of up to IDR 5,516,600/year. However, in an effort to implement it, distribution managers fromeach company need to conduct further discussions regarding mutual agreements. In this case, each company still needsto have a backup plan that can be implemented if the joint distribution plan has not/cannot be implemented. Based onthe description of the newspaper distribution problem at the newspaper publishing company, the Saving Matrixapproach with the Milk-Run system was chosen to achieve the ideal distribution route in order to decrease expensesthat the firm must spend.Based on the explanation above, the research aims to determine the optimal route for distributing newspapersindependently at the newspaper publishing company by considering three conditions: when demand increases,decreases, and is static.2. Literature ReviewIn a study conducted by Damayanti, T. R., et al (2020), the problem of distributing rice to depots owned by logisticscompanies was attempted to be solved using the saving matrix method, which is to determine the distribution routeby specifying the distribution route to be passed and the number of vehicles based on the capacity of the vehicle toobtain the shortest route and minimal transportation costs. The results from the data processing and analyzing showsthat the routes change from 18 to 9 new routes, and it obtained the distance saving of 752.2 km or 45.91% from theinitial distance of 1638.3 km to 886.2 km. Pamosoaji, A. K., et al (2019) in their research, also focus on distributioncompanies to evaluate distribution channels for vehicles that deliver goods to depots and outlets. The method used inthis research is Modified Clarke-Wright Saving, some constraints used in this research such as the maximum allowabletraveling time, maximum number of delivery shifts, and maximum number of vehicles. The results from this researchare obtained if the distribution channel currently used does not have a significant burden or loss. Saputra, I.W, et al.(2018) studied the best distribution route by considering the time windows. This research aims to obtain the optimal IEOM Society International
Proceedings of the International Conference on Industrial Engineering and Operations ManagementIstanbul, Turkey, March 7-10, 2022route and minimum cost of distribution. Optimal route can be determined using a Differential Evolution Algorithmto calculate the shortest route for every agency and maximize the usage of the vehicle using coordinates and demandsof the agencies. The result shows that there is an optimal route which has a shorter route and shorter travel time thanthe existing route in the distribution process. Jodinesa et al. (2019) studied the savings in distributing newspapers tocustomers with joint delivery planning. The calculation of distribution costs using the Vehicle Routing Problem withTime Windows (VRPTW) approach. The output of this paper is that delivery is carried out simultaneously to saveshipping costs, but we must consider the advantages and disadvantages. M. Ilham, (2019). Studied the problem of thedistribution process of PT. Riau Pos Intermedia is caused by the absence of an optimal route because vehicles visitdifferent regions which can cause considerable distance, travel time and distribution costs. Therefore, this study aimsto minimize distance, time and cost. Then the method used to solve the Vehicle Routing Problems (VRP) by using theClark and Wright Saving method. The result of this paper is a distribution route that is more optimal than the previousroute.3. MethodsThis study carried out data processing using the saving matrix method. According to research by Nur Anisa Fitrianiet al. (2021), the saving matrix method was discovered by Clarke and Wright in 1964, where this method is used tosave distance, time, and costs by considering existing constraints. In the calculation process, this algorithm usesdistance as the main parameter and uses the time to get the value of the most considerable savings and then arrangesit into the best route. In addition, this method also combines two or more customers/outlets into one route. Theadvantage that can be obtained by using this method is to schedule a limited number of vehicles taking into accountthe maximum capacity of the same or different vehicles. According to Saputra & Pujotomo (2018), the creation of anew distribution pattern is based on the following mathematical model:1. Objective Function2. Index3. Decision Variable4. Variable Description5. ConstraintThe existing constraint functions are as follows: Each customer will be visited only once Every vehicle route starts from the warehouse and also ends at the warehouse Limit in vehicle capacity Every customer demand will be fully fulfilled The vehicle must arrive at each customer according to the time windows which have been specifiedAccording to Saputra & Pujotomo (2018), The steps that need to be taken to determine the optimal distribution patternare as follows:1. Identifying the distance matrixThis stage requires distance data from the warehouse to each agent, which can be obtained from the coordinates of thewarehouse and each agent in kilometres (km).2. Identifying the savings matrixAt this stage, it assumed that the location would be passed by one truck exclusively. The savings will be obtained ifthere is a merger for delivery to several destinations. The formulation to get the amount of savings is as follows:S (x,y) J (G,x) J (G,y) – J (x,y)S(x,y) Distance SavingJ DistanceG Warehousex First order outlety Second order outletAfter obtaining the savings matrix, the next step is to rank the distance savings results from the largest to the smallest.3. Allocating vehicles and routes by locationThe new delivery route will be determined in this stage based on the merged route chosen in the previous step.4. A route's destination locations are ordered in a particular orderThe order of the visits is determined in this stage. There are numerous approaches for establishing the order of visits,and this study will use the Nearest Neighbor and Nearest Insert method. IEOM Society International
Proceedings of the International Conference on Industrial Engineering and Operations ManagementIstanbul, Turkey, March 7-10, 2022When determining the visit, the Nearest Neighbor approach prioritizes the nearest location to the previously visitedlocation. Meanwhile, the Nearest Insert approach will focus on consumers who provide the shortest trip, using theprinciple of choosing an agent which when inserted into an existing route, results in a minimum additional distance(Raihan & Iman, 2017).This study will also use the Milk Run delivery method. According to Fuad Gary (2011), the history of the milk runsystem dates back to the past, dairy farmers in Europe store milk in cans and put it on the side of the road in front oftheir homes. Then the milk collector collects it and sends it to the dairy factory. This is then known as the Milk Run,which has developed into a transportation and distribution system widely applied in the industrial world. Milk run isa proven and tested method of optimizing transport systems. The definition of Milk-run is one of the advanced shippingconcepts that can improve transportation management. With the Milk Run system, delivery can occur several timesfor transportation or dropping off goods at different locations on the same and regular schedule (Vicentius Venda,2019).The Milk Run delivery method involves picking up from several locations and then delivering it to a single site or acargo picked up from multiple suppliers and delivered to a single customer. The following are the benefits ofemploying this method: it may cut expenses by optimizing the delivery route, may shorten delivery time and quantity,and can be readily utilized, adapted, and applied on all delivery systems.4. Data CollectionThe data used is secondary data taken from previous research (Jodinesa et al., 2019). In the study, researchersdetermined a combined route between three newspaper industry companies in Surakarta, namely PT. Aksara Solopos,Suara Merdeka, and Jawa Pos. However, the independent distribution route of each company, especially PT. AksaraSolopos remains undetermined. The data from this research is used as the reference data for this research and has beenadjusted to the increase and decrease in demand so that it becomes the latest data that is more accurate with the currentconditions. This research focuses on the newspaper publishing company script with agents spread across the city ofSurakarta.List of the newspaper publishing company agents and the number of requests from each agent can be seen in Table 1.Referring to (Prihanto, 2018), in a period of 4 years from 2018 to 2021, it is assumed that there are two conditions,increasing and decreasing total demand by 8%. The company has two vehicles for newspaper distribution with acapacity of 2000 copies each.Table 1. List of Agents and Number of DemandDemand (copies)No. CodeAgent NameStaticDecreased Increased1C1Surya 87C7Momok 1115941368C8Asih115941369C9Margono 2Total315294336236821782557 IEOM Society International
Proceedings of the International Conference on Industrial Engineering and Operations ManagementIstanbul, Turkey, March 7-10, 2022Table 2. Coordinate Point of Each AgentAgentXYC1-7.545586 110.77916C2-7.545586 110.77916C3-7.550793 110.81788C4-7.553314 110.820476C5-7.553469 110.820597C6-7.568512 110.823682C7-7.567927 110.81713C8-7.572134 110.823997C9-7.573876 110.818691Saving Matrix is a method for determining the distance, route, time, or cost of delivering goods from the enterprise tothe customer (Damayanti et al., 2020). The objective of this method is to ensure the delivery of goods can be doneeffectively and efficiently to save cost, energy, and time. There are several steps in using the Saving Matrix method.The first step is determining the distance matrix between the warehouse and agents. The overall results of the distancematrix calculation can be seen in Table 3. In the next step, a saving matrix will be calculated by assuming that onevehicle would pass the location exclusively. The following example shows the calculation of the distance saving fromwarehouse to agent A2 to Agent A6.S (x,y) J (G,x) J (G,y) – J (x,y) 0,3 7,7 - 6,9 1,1 kmTable 3. Distance between Warehouse and Agent (km)WarehouseC1 C2 C3 C4 C5 C6 C7 C8 C9C10.20C20.30.10C35.35.15.5C45.15.75.6 0.2C55.15.75.6 0.2 0.1C67.76.96.8 2.8 2.8 2.4C76.86.56.4 2.8 2.8 2.4 0.8C87.78.88.7 4.7 4.7 4.3 0.5 2.8C97.57.77.6 3.6 3.6 3.2 1.1 0.9 0.90000000Table 4. Saving MatrixC1 C2 C3 C4 C5 C6 C7 C8 C9 Demand (copies)C10C20.4C30.4 0.5C4-0.4 -0.3 4.7C5-0.4 -0.3 4.7 4.5C6116902730329025901.1 6.1 5.9 5.9C70.5 0.6 5.6 5.4 5.4C8-0.9 -0.8 4.2C90441010856506.6 5.79400.1 5.1 4.9 4.9 7.5 6.6 7.5940 IEOM Society International294
Proceedings of the International Conference on Industrial Engineering and Operations ManagementIstanbul, Turkey, March 7-10, 2022The operational costs of the company include vehicle operating costs and fuel costs. The company uses third-partyservices, so they only need to pay a rental fee of IDR 650,000/ month for each vehicle plus the fuel costs. Thecalculation later assumes that 1 liter of fuel can cover a distance of 10 km, and 1 liter of Solar fuel costs IDR5,500.5. Results and DiscussionTable 4 presents the significant distance between agents using the saving matrix method. Then, agents that can becombined into one route to obtain the shortest distance, maximize delivery time and consider the vehicle capacity canbe seen. The calculation results show that there are two routes to optimize the distribution of newspapers. Each routewill use the nearest insert and nearest neighbor method to arrange the distribution order.5.1 Numerical ResultsHere are the results of calculating the optimal route with Microsoft Excel. Table 5 calculates the distance anddistribution route using the nearest insert and nearest neighbor approach, with three conditions: static demand, demandincreases, and demand decreases. Each of the demand conditions has two distribution routes. Table 6 summarizesvehicle fuel costs using two optimal routes from the nearest insert and nearest neighbor approaches.RouteRoute 1Static DemandRoute 2DemandIncreasesDemandDecreasesRoute 1Route 2Route 1Route 2Table 5. Recapitulation of Calculation ResultMethodDistribution OrderTotal DistanceNearest InsertW-C1-C4-C7-C6-W15.2Nearest NeighborW-C1-C4-C7-C6-W24.5Nearest InsertW-C2-C5-C3-C9-C8-W22.3Nearest NeighborW-C2-C3-C5-C9-C8-W22.3Nearest InsertW-C4-C5-C7-C6-G8-W16.4Nearest NeighborW-C4-C5-C7-C6-C8-W16.6Nearest InsertW-C1-C2-C3-C9-W17.7Nearest NeighborW-C1-C2-C3-C9-W17.7Nearest InsertW-C5-C3-C7-C6-W16.6Nearest NeighborW-C5-C3-C6-C7-W16.1Nearest InsertW-C1-C2-C4-C9-C8-W19.8Nearest NeighborW-C1-C2-C4-C9-C8-W19.8Table 6. Recapitulation of Cost CalculationTotalBBMDistribution OrderDistanceCost/day(km)(IDR)BBM Cost/ Total Route 1NearestInsertW-C1-C4-C7-C6-W15.28.360250.800Route 0Route ute te te taticDemandDemandIncreasesDemandDecreases IEOM Society International618.750562.650592.350
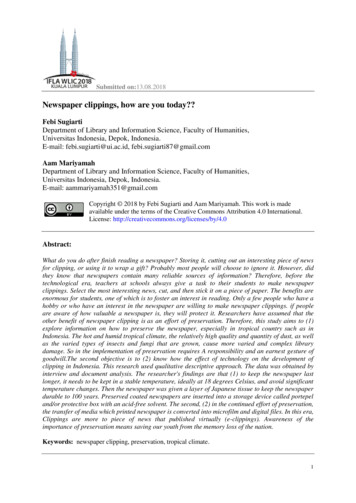
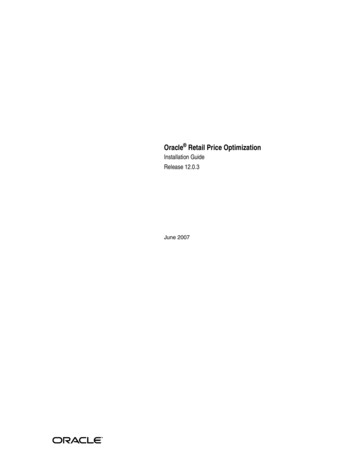
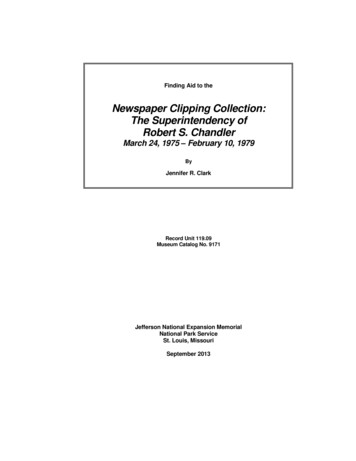
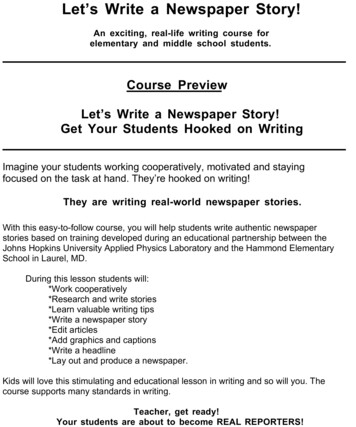
Proceedings of the International Conference on Industrial Engineering and Operations ManagementIstanbul, Turkey, March 7-10, 20225.2 Graphical ResultsFigure 1 shows that when the sales condition is static, the nearest insert approach shows the most optimal distributionroutes. The distance travelled from the warehouse to the agents and back to the warehouse is 15.2 km, with a traveltime of 41 minutes. The transportation cost required is IDR 250,800/month.Figure 1. Static Demand - Route 1Figure 2. Static Demand - Route 2Figure 2 shows that when the sales condition is static, the nearest neighbor approach shows the most optimaldistribution routes. The distance travelled from the warehouse to the agents and back to the warehouse is 22.3 km,with a travel time of 55 minutes. The transportation cost required is IDR 250,800/month. IEOM Society International
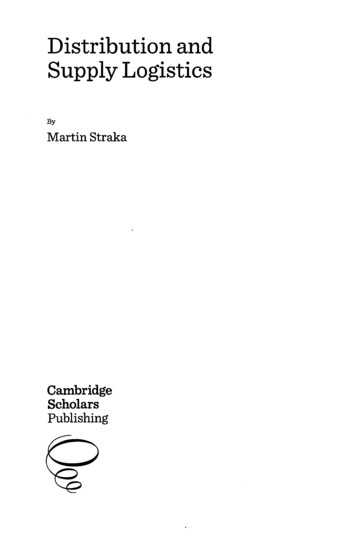
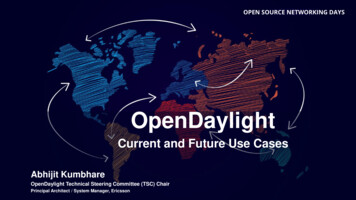
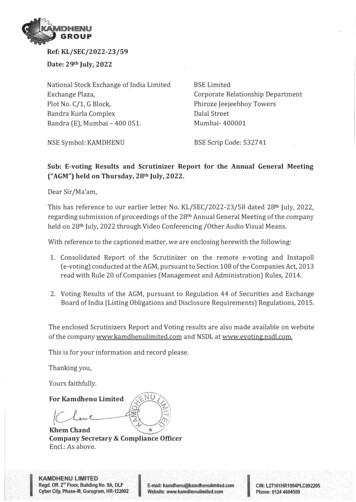
Proceedings of the International Conference on Industrial Engineering and Operations ManagementIstanbul, Turkey, March 7-10, 2022Figure 3. Increased Demand - Route 1Figure 4 shows that the nearest insert approach shows the optimal distribution route sequence when sales conditionsincrease. The distance travelled from the warehouse to the agents and back to the warehouse is 16.4 km, and the traveltime is 42 minutes. The transportation cost required is IDR 367,950 / month.Figure 4. Increased Demand- Route 2Figure 4 shows that the nearest neighbor approach shows the most optimal distribution routes when sales conditionsincrease. The distance travelled from the warehouse to the agents and back to the warehouse is 17.7 km, with a traveltime of 43 minutes. The transportation cost required is IDR 292,000/month. IEOM Society International
Proceedings of the International Conference on Industrial Engineering and Operations ManagementIstanbul, Turkey, March 7-10, 2022Figure 5. Decreased Demand - Route 1Figure 5 shows that the nearest neighbor approach offers the optimal distribution route sequence when sales conditionsare decreased. The distance travelled from the warehouse to the agents and back to the warehouse is 16.1 km, with atravel time of 40 minutes. The transportation cost required is IDR 265,250/month.Figure 6. Decreased Demand - Route 2Figure 6 shows that the nearest insert approach shows the most optimal distribution routes when sales conditions aredecreased. The distance travelled from the warehouse to the agents and back to the warehouse is 19.8 km, with a traveltime of 50 minutes. The transportation cost required is IDR 326,700/month. IEOM Society International
Proceedings of the International Conference on Industrial Engineering and Operations ManagementIstanbul, Turkey, March 7-10, 2022The difference between this research and the reference paper is that the reference paper focuses on the distancetravelled and the resulting cost. However, it does not consider the conditions of sales both when they are up and whensales are down. Meanwhile, this research focuses on optimizing the route taken based on the minimum distancetravelled using the nearest insert and nearest neighbor methods. So that indirectly can reduce transportation costs. Inaddition, it also considers when the sales condition is up or down. So the company can minimize losses because theoptimal distribution route has been obtained in each situation.6. ConclusionBased on the latest conditions, namely the savings in distributing newspapers to customers with joint deliveryplanning, but not considering static, decrease, and increased demand conditions. While the improvement results fromthis research are the calculation of the state of demand, such as when the demand state is static, decrease and increaseso that in each situation there are two optimal routes, each of which has been carried out data processing with thesaving matrix method. The result of data processing using the saving matrix method with the nearest insert and nearestneighbor approaches, two optimal routes with three conditions are obtained to distribute Solopos newspapers.When the demand is static, the optimal distance on route 1 using the nearest insert approach is 15.2 km, with thedistribution route, namely W-C1-C4-C7-C6-W, and the fuel cost is IDR 250,800/month. For route 2, using the nearestneighbor approach, the distance needed to be travelled is 22.3 km. The distribution route is W-C2-C3-C5-C9-C8-W,and the vehicle fuel cost is IDR 367,950/When the demand is static, the total cost per month is IDR 618,750/month.When demand increases, the total distance of route 1 with the nearest insert approach is 16.4 km. The distributionroute will be W-C4-C5-C7-C6-G8-W, and the vehicle fuel cost is IDR 270,600/month. Route 2, using the nearestneighbor, will have a total distance of 17.7 km with the distribution route: W-C5-C3-C7-C6-W. The entire vehiclecost will be IDR 292,050/month. When the demand increases, the monthly cost will be IDR 562,650/month.When demand decreases, the optimal distance on route 1 using the nearest neighbor approach is 16.1 km, with thedistribution route, namely W-C5-C3-C6-C7-W, and the vehicle fuel cost is IDR 265,650/month. Meanwhile, usingthe nearest insert approach, the total distance of route 2 is 19.8 km with distribution route W-C1-C2-C4-C9-C8-W,and the vehicle fuel cost is IDR 326,700/when the demand decreases, the total cost per month will be IDR592,350/month.ReferencesAliudin, E. R., & Arisanty, M. (2018). Transformasi Digital Majalah Hai dalam Upaya Mempertahankan EksistensiBrand. 5(2).Amri, M., Rahman, A., & Yuniarti, R. (2014). Penyelesaian Vehicle Routing Problem dengan Menggunakan MetodeNearest Neighbor (Studi Kasus: MTP Nganjuk Distributor PT. Coca Cola).Damayanti, T. R., Kusumaningrum, A. L., Susanty, Y. D., & Susilawati, S. (2020). Route Optimization Using SavingMatrix Method-A Case Study at Public Logistics Company in Indonesia.Fitriani, N. A., Pratama, R. A., Zahro, S., Utomo, P. H., & Martini, T. S. (2021, February). Solving Capacitated VehicleRouting Problem Using Saving Matrix, Sequential Insertion, And Nearest Neighbor of Product ‘X’ in GroboganDistrict. In AIP Conference Proceedings (Vol. 2326, No. 1, p. 020007). AIP Publishing LLC.Jodinesa, M. N. A., Yuniaristanto, Sutopo, W., & Hisjam, M. (2019). Joint delivery planning with time windows: Acase study on supply chain in newspaper industry. IOP Conference Series: Materials Science and Engineering,495(1). say, V., & Bányai, T. (2017). Toyota production system in milk run based in-plant supply. Journal of ProductionEngineering, 20(1), 141-146.Prihanto, J. J. N. (2018). Transformasi Digital Media Cetak Di Indonesia: Studi Pada Industri Media CetakTerverifikasi Administratif Dan Faktual Tahun 2017 Oleh Dewan Pers Indonesia (Vol. 10, Issue 1).Raihan, A. H. (2017). Analisis Metode Heuristik Pengolahan Data Travelling Salesman Problem Terhadap JumlahTitik (Doctoral dissertation, Fakultas Teknik).Riskadayanti, O., Yuniaristanto, Sutopo, W., & Hisjam, M. (2019). Discrete-Event Simulation of a Production Processfor Increasing the Efficiency of a Newspaper Production. IOP Conference Series: Materials Science andEngineering, 495(1). https://doi.org/10.1088/1757-899X/495/1/012026 IEOM Society International
Proceedings of the International Conference on Industrial Engineering and Operations ManagementIstanbul, Turkey, March 7-10, 2022Saputra, R., & Pujotomo, D. (2019). Penyelesaian Vehicle Routing Problem Dengan Karakteristik Time WindowsDan Multiple Trips Menggunakan Metode Saving Matrix (Studi Kasus: PT. Coca Cola Bottling IndonesiaWilayah Medan. Industrial Engineering Online Journal, 7(4).Saputra, I. W., Hisjam, M., & Sutopo, W. (2018). Optimization of Distribution Channel Vehicle Routing Problem withTime Windows using Differential Evolution Algorithm: A Case Study in Newspaper Industry.BiographiesAdindha Karunia Ciptaning Pragowoaji is an undergraduate student of the Industrial Engineering Department ofUniversitas Sebelas Maret, Surakarta, Indonesia. Her research interests are in the supply chain, logistics, business,techno economy, and distribution.Iksan Widiantoro Restuaji is an undergraduate student of the Industrial Engineering Department of UniversitasSebelas Maret, Surakarta, Indonesia. His research interests are in the supply chain, logistics, business, technoeconomy, and distribution.Yusuf Fardhan Nurdianto is an undergraduate student of the Industrial Engineering Department of UniversitasSebelas Maret, Surakarta, Indonesia. His research interests are in the supply chain, logistics, business, technoeconomy, and distribution.Arinda Soraya Putri is a lecturer at Industrial Engineering Department, Universitas Muhammadiyah Surakarta,Surakarta, Indonesia. She obtained her Masters of Industrial Engineering and a Bachelor of Engineering in IndustrialEngineering from Universitas Sebelas Maret, Surakarta, Indonesia. She is a member of the research group of Logisticsand Industrial Optimization from 2019 until now. Her research interests are Logistics & Supply Chain Management,Distribution Systems, Simulation, Market Testing Analysis, and Feasibility Study.Wahyudi Sutopo is a professor in industrial engineering and coordinator for the research group of industrialengineering and techno-economy (RG-RITE) of Faculty Engineering, Universitas Sebelas Maret (UNS), Indonesia.He earned his Ph.D. in Industrial Engineering & Management from Institut Teknologi Bandung in 2011. He is also aresearcher for the university center of excellence for electrical energy storage technology (UCE-EEST). He has doneprojects with Indonesia endowment fund for education (LPDP), sustainable higher education research alliances(SHERA), MIT-Indonesia research alliance (MIRA), PT Pertamina (Persero), PT Toyota Motor ManufacturingIndonesia, and various other companies. His research interests include logistics & supply chain management,engineering economy, cost analysis & estimation, and technology commercialization. He is a member of the boardof industrial engineering chapter - the institute of Indonesian engineers (BKTI-PII), Indonesian Supply Chain &Logistics Institute (ISLI), Society of Industrial Engineering, and Operations Management (IEOM), and Institute ofIndustrial & Systems Engineers (IISE).Yuniaristanto is a lecturer of the Department of Industrial Engineering, Universitas Sebelas Maret (UNS). Heobtained his Master of Engineering from Institut Teknologi Bandung and Bachelor of Engineering in IndustrialEngineering from Institut Teknologi Sepuluh November. He is part of the Industrial Engineering and Techno Economy (RITE) Research Group. His research interests are Logistics & Supply Chain Management, andProduction/Operations Management. IEOM Society International
and the vehicle fuel cost is IDR 367,950/When the demand is static, the total cost per month is IDR 618,750/month. When demand increases, the total distance of route 1 with the nearest insert approach is 16.4 km. The distribution route will be W-C4-C5-C7-C6-G8-W, and the vehicle fuel cost is 270,600/month. Route 2, using the nearest IDR