Transcription
Eur Radiol (2015) 25:3328–3337DOI 10.1007/s00330-015-3742-zBREASTGeographic variation in volumetric breast densitybetween screening regions in the NetherlandsDaniëlle van der Waal 1 & Marleen J. Emaus 2 & Marije F. Bakker 2 &Gerard J. den Heeten 3,4 & Nico Karssemeijer 5 & Ruud M. Pijnappel 3,6 &Wouter B. Veldhuis 6 & André L. M. Verbeek 1 & Carla H van Gils 2 &Mireille J. M. Broeders 1,3Received: 19 November 2014 / Revised: 10 March 2015 / Accepted: 25 March 2015 / Published online: 3 July 2015# The Author(s) 2015. This article is published with open access at Springerlink.comAbstractObjectives Differences in breast density between populationsmay explain part of the variation in regional breast cancerscreening performance. This study aimed to determine whether regional differences in breast density distribution are present in the Dutch screening population.Methods As part of the DENSE trial, mammographic densitywas measured using a fully-automated volumetric method.The regions in our study were based on the geographic coverage of 14 reading units representing a large part of theNetherlands. General linear models were used.Results Four hundred eighty-five thousand and twenty-onescreening participants with a median age of 60 years wereincluded (2013-2014). The proportion of women with heterogeneously or extremely dense breasts ranged from 32.5 % to* Daniëlle van der WaalDanielle.vanderWaal@radboudumc.nl1Radboud Institute for Health Sciences (Department for HealthEvidence, Mailbox 133), Radboud university medical center, POBox 9101, 6500 HB Nijmegen, The Netherlands2Julius Center for Health Sciences and Primary Care, UniversityMedical Center Utrecht, Utrecht, The Netherlands3Dutch Reference Centre for Screening, Nijmegen, The Netherlands4Department of Radiology, Academic Medical Centre, University ofAmsterdam, Amsterdam, The Netherlands5Department of Radiology, Radboud university medical center,Nijmegen, The Netherlands6Department of Radiology, University Medical Center Utrecht,Utrecht, The Netherlands45.7 % between regions. Mean percent dense volume variedbetween 6.51 % (95 % confidence interval [CI]: 6.46-6.55)and 7.68 % (95 % CI: 7.66-7.71). Age differences could notexplain the variation. Socio-economic status (SES) was positively associated with volumetric density in all analyses (lowSES: 6.95 % vs. high SES: 7.63 %; ptrend 0.0001), whereas apotential association between urbanisation and breast densityonly became apparent after SES adjustment.Conclusion There appears to be geographic variation in mammographic density in the Netherlands, emphasizing the importance of including breast density as parameter in the evaluation of screening performance.Key Points Mammographic density may affect regional breast cancerscreening performance. Volumetric breast density varies across screening areas. SES is positively associated with breast density. Implications of volumetric breast density differences need tobe studied further.Keywords Digital mammography . Breast cancer screening .Mammographic density . Socio-economic status .UrbanisationAbbreviationsSESSocio-economic statusVDGVolpara density gradeFFDM Full-field digital mammographySFMScreen-film mammographyMLOMediolateral obliqueCCCraniocaudal%DVPercent dense volumeDVDense volume
Eur Radiol (2015) 25:3328–33373329IntroductionMethodsMammographic interpretations are influenced by the distribution of fibroglandular and adipose tissue in thebreast. More fibroglandular tissue, i.e., a higher mammographic density, is associated with both an increasedbreast cancer risk and a decreased sensitivity of mammography [1–3]. Due to the radiation attenuation characteristics ofthis tissue, tumour masses could be masked on a mammogram[1]. This results in a greater risk of breast carcinomas remaining undetected.Since breast density will affect breast cancer screening performance, it is important to be aware of differences in mammographic density distribution between the coverage areas ofscreening radiology groups. Previous screening evaluationstudies revealed differences in breast cancer detection ratesacross the Netherlands [4, 5]. The extent to which variationin breast density has contributed to these differences has notyet been determined. The average radiologist reads 13,000mammograms per year, but breast density is not taken intoaccount in the evaluation of this high-volume reading.Objective density measurements are needed for a definitiveanswer on the magnitude of the geographic differences andthe resulting effect on screening performance. Furthermore,the geographic distribution of breast density may providemore insight into differential breast cancer risk.The Dutch breast cancer-screening programme started in1989. Until now, geographic comparisons of mammographicdensity were not possible due to the lack of structural breastdensity assessments. As part of the DENSE trial, the volumetric breast density distribution could be determined using unprocessed mammogram data collected from screening unitsthroughout the country [6]. Although this is, to our knowledge, the first study to address the geographic variation involumetric breast density within a national screening programme, a few studies have reported on the association ofgeographic (e.g., urbanisation level) and demographic (e.g.,socio-economic status [SES]) characteristics with breast density [7–11]. These factors may help clarify differences between screening areas, but the previous results have beensomewhat inconsistent. A positive association of breast density with SES [7, 9, 11] and urbanisation [8, 10] has beensuggested, although disagreement exists on the strength ofthe associations.With this study, we want to contribute to the discussion on measuring breast density in national screeningprogrammes. Breast density should only be included asa parameter in a screening evaluation if there is evidence ofgeographic differences in breast density. The aim of this studywas, therefore, to determine whether regional differences involumetric breast density are present in the Netherlands. Inaddition, we studied the association of breast density withSES and urbanisation.Study population and data collectionWomen aged 50-75 years are invited biennially for breastcancer screening in the Netherlands. They receive their firstinvitation in the year they turn 50 or 51 years old. This programme has a full national coverage, with relatively high attendance (79.6 % in 2012) compared to other Europeanprogrammes [5, 12]. Phased installation of density softwareon servers in screening units of the Dutch programme startedin January 2013. Examinations performed at these units between implementation and February 2014 were included inour study. In the Netherlands, screening examinations are readby different radiology groups (hereinafter referred to as reading units) across the country. Mammographic data are centrally stored in a national database and, depending on the screening unit location (ntotal 77; 57 mobile, 22 fixed), distributedto specific reading units. The 14 reading units in our study (outof 16 nationwide), therefore, all have different coverage areas,with minimal overlap. Together, they cover a substantial partof the most densely populated areas of the Netherlands, withfour out of five screening regions participating in this study.To improve readability of the results, the reading units werenumbered, but this does not match the previously used codingin the literature [4, 5]. The name of each reading unit (based onits location) is described below Table 3, with the corresponding Dutch provinces they (partly) cover in brackets.As part of the DENSE trial, breast density profiles of participants at enrolled screening units were estimated using unprocessed digital mammogram data. The DENSE trial(NCT01315015) has been described elsewhere [6]. In short,DENSE investigates the (cost-) effectiveness of screeningwith mammography and MRI, compared to mammographyalone in Dutch breast cancer screening participants with extremely dense breasts (BI-RADS density 4/d).Data on age at screening and four-digit postal codes wereobtained for all those being screened. Screening participantsare informed about the potential use of screening data in research aimed to improve the programme. Based on Dutch law,medical ethics approval was not needed because anonymizeddata were used for this study.SES and urbanisationThe Netherlands Institute for Social Research (Sociaal enCultureel Planbureau; SCP) has provided a measure of SES,which combines educational level, income, and labour marketposition [13]. The SCP collected information on SES byinterviewing one person in every six-digit postal code areabetween 2006 and 2010. This information was then combinedto give one score for every four-digit postal code area. Thescores were linked to the postal codes in our dataset.
3330Degree of urbanisation is based on the number of addressesper square kilometre. Statistics Netherlands has published afive-level categorical scale, with less than 500 addresses at thelowest and more than 2500 addresses at the highest urbanisation level [14, 15]. The urbanisation degree can be retrievedfor each neighbourhood in the Netherlands. The postal codesof these neighbourhoods were matched to the postal codes ofthe participants.Mammographic densitySince the nationwide implementation of full-field digital mammography (FFDM) was completed in 2010, all screening examinations in our study were performed digitally using Seleniasystems (Hologic, Bedford, USA). Breast density was determined using Volpara Imaging Software (version 1.5)(Mātakina, Wellington, New Zealand). This FDA-approvedsoftware calculates total breast volume (in cm3), fibroglandulartissue volume (dense volume [DV]; in cm3), fat tissue volume(non-dense volume; in cm3), and percentage fibroglandular tissue (percent dense volume [%DV]) based on the measured Xray attenuation per pixel [16, 17]. Volpara has developed acategorical scale as an approximation of the BI-RADS densityscale: the Volpara Density Grade (VDG). The %DV is dividedinto four categories on the VDG-scale (with in brackets thecorresponding BI-RADS density): VDG1 4.5 % (almost entirely fatty), VDG2 4.5-7.5 % (scattered areas of density),VDG3 7.5-15.5 % (heterogeneously dense), and VDG4 15.5 % (extremely dense) [18, 19]. The VDG is based on themean %DV of all views.The Volpara software version used in the DENSE trial onlygives an estimate when both the mediolateral oblique (MLO)and craniocaudal (CC) view are available. The resulting estimate is the average of both. Since a recent policy change(decision made in 2013, officially implemented in 2014),two-view mammography is standard and both views are available for all examinations in the current programme [20].Directly prior to the policy change, two-view mammographywas already widely applied, including in women participatingfor the first time. Both views were obtained in 99 % of theexaminations in the regions included in our study.In addition, since the difference in density between the leftand right view is known to be small, the average of theseestimates was used [21]. In this study, the Pearson correlationcoefficient for the left and the right view was 0.95, 0.91, 0.98,and 0.98 for %DV, DV, non-dense volume, and total breastvolume, respectively.Statistical analysesA natural logarithmic transformation [ln(x 1)] was applied to%DV and DV. General linear models were used to calculategeometric means and corresponding 95 % confidence intervalsEur Radiol (2015) 25:3328–3337(CI) of %DV and DV per reading unit. Furthermore, means ofthe density measures were calculated for every SES quartile andevery urbanisation level. Linear trends were studied with polynomial contrasts. Log-binomial regression was used to studythe effect of SES and urbanisation on the VDG. For this analysis, the VDG was dichotomized into VDG1 2 and VDG3 4.In addition to our main analyses, we performed secondaryanalyses with two important confounders to provide someinsight into the causal association between geographic areaand breast density. The first potential confounder included inour models was age at screening. Although the invitation agerange is the same in all regions, the age distribution may havevaried. Furthermore, dense volume was adjusted for totalbreast volume. Total breast volume can be seen as a proxyfor body-mass index (BMI).All values were transformed back to the original scale inthe tables for ease of interpretation. The statistical tests weretwo-sided, with a significance level of 0.05. All analyses wereperformed using SAS software (version 9.2, SAS Institute).ResultsA total of 485,021 screening participants were included in ouranalyses (Table 1). The median age at screening was 60 years(IQR 54-66 years). All density measures are shown in Table 2.Table 1Baseline characteristics of the study population (n 485,021)VariablesAge (in years)Median (IQR)60 (54-66)% (N)Screening regionMid-westEastSouthSouth-westSESQ1 (lowest SES)Q2Q3Q4 (highest SES)MissingUrbanisation level (addresses/km2)Very high ( 2500)High (1500-2499)Moderate (1000-1499)Low (500-999)Very low (0-499)IQR inter-quartile range, SES socio-economic status37.0 (179,261)16.9 (81,962)21.5 (104,198)24.7 (119,600)25.1 (121,590)24.7 (119,810)25.1 (121,923)24.9 (120,704)0.2 (994)23.2 (112,333)31.1 (150,813)18.3 (88,578)16.7 (81,185)10.7 (52,112)
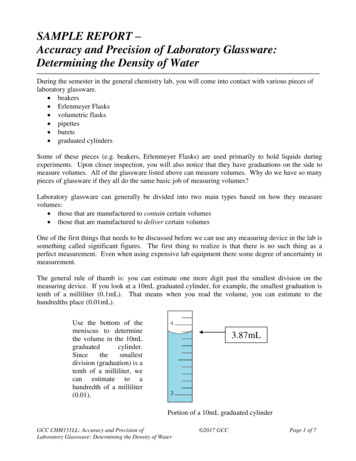
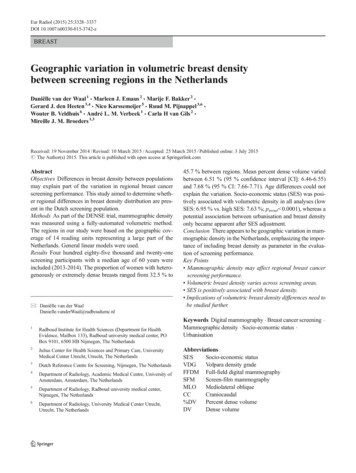
Eur Radiol (2015) 25:3328–3337Table 23331Different breast density measures according to ageNGeometric mean (95 % CI)%DV (%)Total485,0217.25 (7.25-7.25)% (N)DV (cm3)Total volume (cm3)VDG3 456.97 (56.97-56.97)860.9 (859.8-862.1)40.5 (196,312)VDG 47.9 (38,330)Age group 50 ya50-55 y55-60 y13,4469.27 (9.20-9.35)67.33 (66.81-67.86)799.3 (792.0-806.6)60.7 (8156)19.4 (2606)116,188105,3458.33 (8.31-8.35)7.23 (7.21-7.25)62.10 (61.94-62.27)56.22 (56.06-56.38)819.9 (817.4-822.4)850.6 (847.9-853.3)52.6 (61,121)41.3 (43,549)13.9 (16,119)7.5 (7875)60-65 y65-70 y96,43788,2586.83 (6.81-6.85)6.61 (6.59-6.63)55.29 (55.13-55.45)55.21 (55.05-55.38)879.4 (876.5-882.2)902.3 (899.3-905.4)36.2 (34,912)32.7 (28,830)5.6 (5407)4.4 (3922)70-75 y59,4056.47 (6.44-6.49)53.15 (52.95-53.35)883.7 (880.0-887.3)30.4 (18,047)3.7 (2200)59426.34 (6.26-6.42) 0.000152.22 (51.61-52.83) 0.0001883.2 (871.7-894.7) 0.000128.1 (1670)3.4 (201)75 y ptrend%DV percent dense volume, DV dense volume, CI confidence interval, VDG volpara density gradeaThe time of first invitation is based on location and birth year. Women receive their first invitation in the year they turn 50 or 51 years of age. As a result,a number of women were still 49-years-old at first screening (n 13,408) and even a few 48-year-olds were included (n 38)The geometric means of %DV and DV were 7.25 % and56.97 cm3, respectively. The confidence intervals were similarto the mean estimates due to the large sample size. There were196,312 women (40.5 %) who could be classified as havingheterogeneously (VDG3) or extremely (VDG4) dense breasts,with 38,330 women (7.9 %) in the latter category. Age wasinversely associated with %DV and DV (ptrend 0.0001). Theproportion of women with a VDG3/VDG4 classification decreased from 60.7 % in the youngest to 28.1 % in the oldestage group. Total breast volume increased with age (ptrend 0.0001) up until 65-70 years, after which it slightly decreased.Geographic variationTable 3 and Fig. 1 show the geographic variation in breastdensity in the Netherlands. In the first region (reading unit 1),32.5 % of the women had heterogeneously (VDG3) or extremely (VDG4) dense breasts. The proportion of women withVDG3/VDG4 in the coverage area of reading unit 14 was45.7 %. The mean %DV ranged from 6.51 % (95 % CI: 6.466.55 %) in the coverage area of reading unit 1 to 7.68 % (95 %CI: 7.66-7.71 %) in the coverage area of reading unit 14. DVranged from 53.93 cm3 (unit 3; 95 % CI: 53.47-54.40 cm3) to59.36 cm3 (unit 6; 95 % CI: 59.08-59.65 cm3). The geographicvariation in mammographic density could not be explained byage differences. Although adjustments for total breast volumedid have an effect on DV in some regions, geographic variationin DV still appeared to be present in the fully adjusted model(including age and total breast volume).Association with SESThe %DV is higher among women with higher SES (mean%DV Q1 6.95 % vs. Q4 7.63 %; ptrend 0.0001) (Table 4).Adjustments for age or urbanisation had little effect on theseassociations. The positive association between SES and DVonly became apparent after adjustment for total breast volume(Table 4). A high SES was also associated with a high VDG(age-adjusted RR Q4 vs. Q1 1.20, 95 % CI: 1.19-1.21)(Table 5).Association with urbanisationThere was minimal evidence of a linear association between urbanisation level and the various density measures(crude mean %DV rural 7.19 % vs. high urbanisation 7.27 %; ptrend 0.0052) (Table 4). The significant ptrendappeared to be mainly driven by the large numbers andthe higher density at the highest urbanisation level, especially in the analyses on DV, whereas the density valuesappeared to be similar for all other urbanisation levels.When the estimates were additionally adjusted for SES,the positive association between breast density and urbanisation became more pronounced. Similar effects were observed in the analyses with VDG (Table 5). This suggests aconfounding role of SES, which was confirmed by thepresence of an inverse association between urbanisationlevel and SES (data not shown).DiscussionOur results show that there is geographic variation in volumetric breast density in the Netherlands. Breast density, measuredas %DV or DV, varies across the coverage areas of differentreading units in the Dutch screening programme. Differencesin breast density were also observed for different SES groups,with higher SES being associated to higher breast density. A
4230,60869,92345610111213147.45 (7.41-7.49)7.68 (7.66-7.71)7.24 (7.21-7.27)7.32 (7.28-7.35)7.41 (7.38-7.44)6.87 (6.77-6.97)6.99 (6.95-7.04)7.01 (6.98-7.05)7.10 (7.07-7.13)7.10 (7.07-7.14)7.16 (7.14-7.19)7.46 (7.42-7.50)7.63 (7.61-7.66)7.25 (7.21-7.28)7.29 (7.25-7.33)7.40 (7.37-7.42)6.97 (6.87-7.07)7.01 (6.97-7.06)7.00 (6.97-7.03)7.12 (7.09-7.15)7.13 (7.09-7.16)7.18 (7.15-7.21)6.77 (6.71-6.83)6.53 (6.49-6.58)6.70 (6.64-6.76)Adjustedc57.66 (57.36-57.96)58.73 (58.53-58.93)56.54 (56.29-56.79)56.59 (56.32-56.87)57.43 (57.22-57.65)56.86 (56.08-57.66)56.27 (55.92-56.63)59.36 (59.08-59.65)56.02 (55.80-56.25)55.67 (55.42-55.92)56.85 (56.62-57.07)53.93 (53.47-54.40)55.94 (55.57-56.31)56.19 (55.70-56.68)CrudeDV (cm3)The highest and lowest value in each column are bolded57.71 (57.41-58.01)58.50 (58.30-58.70)56.57 (56.33-56.82)56.48 (56.20-56.75)57.38 (57.17-57.60)57.31 (56.52-58.10)56.37 (56.01-56.73)59.30 (59.02-59.58)56.11 (55.89-56.33)55.77 (55.53-56.02)56.92 (56.69-57.14)53.98 (53.52-54.44)56.07 (55.70-56.43)56.38 (55.90-56.87)Adjustedc58.43 (58.18-58.68)59.52 (59.35-59.69)56.80 (56.59-57.00)56.71 (56.48-56.93)57.76 (57.58-57.94)56.41 (55.77-57.06)55.99 (55.70-56.29)57.40 (57.17-57.62)56.29 (56.10-56.47)56.07 (55.86-56.28)56.87 (56.68-57.06)53.90 (53.52-54.28)53.88 (53.59-54.18)54.16 (53.78-54.55)Adjustedd42.8 (13,113)45.7 (31,985)40.9 (17,441)41.6 (14,585)42.5 (24,431)36.5 (1571)37.6 (7725)37.2 (13,737)39.3 (20,377)39.3 (16,438)39.9 (21,015)35.3 (3981)32.5 (6165)33.9 (3748)VDG3 4% (N)8.6 (2634)9.0 (6258)8.1 (3451)8.6 (3028)9.1 (5207)6.2 (268)6.7 (1378)6.8 (2509)7.7 (3969)7.5 (3144)7.8 (4119)6.0 (676)5.4 (1024)6.0 (665)VDG4dcAdjusted for age and total breast volumeAdjusted for ageAll reading units are named after their location, with in brackets the provinces they (partly) cover: 1 Rotterdam (Zuid-Holland), 2 Goes (Zuid-Holland, Zeeland), 3 Venlo (Noord-Brabant),4 Apeldoorn (Overijssel, Gelderland), 5 Breda (Noord-Brabant), 6 Dordrecht (Zuid-Holland), 7 Amsterdam (Noord-Holland), 8 Maastricht (Limburg), 9 Den Haag / Leiden (Zuid-Holland), 10 Doetinchem (Gelderland, Overijssel), 11 Nijmegen (Gelderland), 12 Amsterdam (Noord-Holland, Utrecht, Flevoland), 13 Eindhoven (Noord-Brabant), and 14 Utrecht (Utrecht, Noord-Holland,Flevoland, Gelderland)ba%DV percent dense volume, DV dense volume, VDG volpara density grade, CI confidence interval8911,29236.76 (6.70-6.82)6.51 (6.46-6.55)6.66 (6.60-6.72)18,94911,06912%DV (%)CrudeNGeometric mean (95 % CI)Percent dense volume, dense volume, and VDG distribution by breast cancer screening reading unit in the NetherlandsaReading units bTable 33332Eur Radiol (2015) 25:3328–3337
Eur Radiol (2015) 25:3328–3337Fig. 1 Age-adjusted geometricmeans of the percent densevolume across the Netherlands3333Mean volumetric breast density (%)6.5 - 6.96.9 - 7.17.1 - 7.57.5 - 8.0No datapotential positive association with urbanisation level only became apparent after SES adjustments. Differences in age didnot explain the observed associations.In the interpretation of these results, one should take intoaccount that volumetric breast density estimates tend to belower than estimates obtained with area-based methods (e.g.,Cumulus). Consequently, the differences in volumetric density will also tend to be smaller. The observed variation in density may, thus, be associated with a greater difference in breastcancer risk or screening performance than one may intuitivelyexpect based on previous studies involving Cumulus’ percentdensity.Based on studies with screen-film mammography (SFM),screening performance (e.g., sensitivity and recall rates) canbe affected by breast density [22–26]. Preliminary evidencehas suggested that FFDM performs better in dense breaststhan SFM [27, 28]. Evidence on sensitivity across densitycategories in FFDM, however, is scarce. Two studies in theUS, with annual instead of biennial screening, observed noclear pattern in their secondary analyses on sensitivity withindifferent density categories [29, 30]. However, as mentionedby Kerlikowske et al., missing measurements resulted inlimited statistical power and may have introduced bias [29].In addition, the greater proportion of BI-RADS 0 classifications with FFDM compared with SFM could be associatedwith high density. Additional imaging in this group may haveresulted in a higher screen-detected cancer rate. Finally, adjustments for facility and radiologist effects appeared to reverse thefindings. More studies are, thus, still needed on the effect ofbreast density on FFDM performance in the Netherlands.Using parameters from SFM studies, however, we can estimate the expected variation in screening performance of thereading units due to differences in breast density distribution.With the performance parameters stratified on BI-RADS density of Yankaskas et al., for example, we can calculate weighted averages (weighted on VDG distributions) to estimate performance (e.g., sensitivity) in each reading unit in our study[26]. Using these parameters, a small amount of the performance variation could be explained by breast density differences in our population, with sensitivity ranging between76.9-80.3 % across reading units (range recall rate: 53.959.7 per 1000; range cancer detection: 3.28-3.34 per 1000).Overall estimates of screening performance in the US are,however, very different from the overall Dutch estimates (in
88,57881,18552,112ModerateLowVery low7.27 (7.25-7.30)7.21 (7.18-7.23)7.19 (7.16-7.22)0.00527.27 (7.25-7.29)7.16 (7.15-7.18)6.95 (6.93-6.97)7.10 (7.08-7.12)7.22 (7.20-7.24)7.63 (7.61-7.65) 0.0001Crude7.25 (7.23-7.27)7.24 (7.21-7.26)7.19 (7.16-7.22)0.0747.27 (7.25-7.29)7.16 (7.15-7.18)6.95 (6.94-6.97)7.12 (7.10-7.14)7.22 (7.21-7.24)7.59 (7.57-7.61) 0.0001Adjusteda7.18 (7.15-7.20)7.18 (7.15-7.20)7.11 (7.08-7.14) 0.00017.35 (7.33-7.37)7.20 (7.19-7.22)6.90 (6.88-6.92)7.11 (7.09-7.13)7.24 (7.22-7.25)7.58 (7.56-7.60) 0.0001Adjustedb56.85 (56.68-57.02)56.38 (56.20-56.56)56.67 (56.44-56.90) 0.000158.06 (57.90-58.22)56.88 (56.75-57.01)57.46 (57.31-57.61)56.66 (56.51-56.81)56.73 (56.58-56.88)57.30 (57.15-57.45)0.2383CrudeDV (cm3)edcbaThe 994 women for whom SES status had not been identified were excluded from the analyses on SESAdjusted for age, total breast volume, and urbanisation level (in the SES analyses) or SES (in the urbanisation analyses)Adjusted for age and total breast volumeAdjusted for age and urbanisation level (in the SES analyses) or SES (in the urbanisation analyses)Adjusted for age%DV percent dense volume, DV dense volume, CI confidence interval, SES socio-economic statusptrend112,333150,813Very highHigh121,590119,810121,923120,704N%DV (%)Geometric mean (95 % CI)Density distribution for levels of SES or urbanisationSESeQ1 (lowest SES)Q2Q3Q4 (highest SES)ptrendUrbanisationTable 456.74 (56.57-56.92)56.53 (56.35-56.71)56.67 (56.45-56.90) 0.000158.05 (57.89-58.20)56.87 (56.74-57.01)57.49 (57.35-57.64)56.75 (56.60-56.90)56.76 (56.62-56.91)57.14 (56.99-57.28)0.0017Adjusteda57.08 (56.93-57.22)56.83 (56.68-56.98)56.64 (56.45-56.83) 0.000157.65 (57.52-57.78)56.82 (56.71-56.93)56.19 (56.07-56.31)56.51 (56.39-56.63)56.95 (56.83-57.07)58.53 (58.40-58.65) 0.0001Adjustedc56.80 (56.66-56.95)56.60 (56.45-56.75)56.32 (56.13-56.51) 0.000157.96 (57.82-58.09)56.98 (56.87-57.09)55.79 (55.66-55.93)56.43 (56.31-56.56)57.04 (56.91-57.16)58.48 (58.36-58.61) 0.0001Adjustedd3334Eur Radiol (2015) 25:3328–3337
Eur Radiol (2015) 25:3328–3337Table 53335Volpara Density Grade for levels of SES or urbanisationRRa (95 % CI)% (N)AdjustedcAdjusteddVDG3 4VDG4Crude37.0 (45,033)6.9 (8377)1.00 (Ref.)1.00 (Ref.)1.00 (Ref.)39.1 (46,864)40.5 (49,419)7.3 (8720)7.9 (9592)1.06 (1.05-1.07)1.09 (1.08-1.11)1.06 (1.05-1.07)1.09 (1.08-1.10)1.07 (1.06-1.08)1.11 (1.10-1.12)45.2 (54,563)9.6 (11,555)1.22 (1.21-1.23)1.20 (1.19-1.21)1.22 (1.21-1.23)Very high40.7 (45,703)8.4 (9469)1.00 (Ref.)1.00 (Ref.)1.00 (Ref.)HighModerately high39.9 (60,227)41.2 (36,530)7.6 (11,467)7.9 (7034)0.98 (0.97-0.99)1.01 (1.00-1.02)0.98 (0.97-0.99)1.01 (1.00-1.02)0.97 (0.96-0.98)0.96 (0.95-0.97)LowVery low40.4 (32,834)40.3 (21,018)7.8 (6367)7.7 (3993)0.99 (0.98-1.01)0.99 (0.98-1.00)1.00 (0.99-1.01)0.99 (0.98-1.01)0.96 (0.95-0.97)0.95 (0.93-0.96)SESbQ1 (lowest SES)Q2Q3Q4 (highest SES)UrbanisationSES socio-economic status, RR risk ratio, CI confidence interval, VDG volpara density grade,aThese RRs were estimated using log-binomial regression: VDG3 4 compared to VDG1 2bThe 994 women for whom SES status had not been identified were excluded from the analyses on SEScAdjusted for agedAdjusted for age and urbanisation level (in the SES analyses) or SES (in the urbanisation analyses)2011: recall 21.4 per 1000; cancer detection 6.2 per 1000)[5]. The effect of density on screening performance in theNetherlands, thus, still needs to be assessed.Breast density is also associated with breast cancer risk[1, 3, 31]. Indeed, a similar gradient in breast cancer incidenceappeared to exist across the country [32]. Since we focused onthe effect of density on screening practice, no information onother risk factors was collected. Differential screening attendance may have contributed to the variation in volumetricbreast density. Both SES and urbanisation are factors thatcould be associated with attendance. When we included thesefactors in the regional analyses, the observed variation in volumetric breast density slightly decreased (data not shown).The remaining differences would have to be attributed to unmeasured or even unknown confounders. Aetiological inferences on differences in %DV are hindered by the absence ofinformation on BMI. Because DV is expected to be less affected by BMI confounding, based on a meta-analysis involving dense area [33], the observed differences in DV do indicate that variation in dense tissue is present that may translateinto a difference in breast cancer risk. Further studies areneeded to confirm this result.A study on four widely dispersed geographic areas showedthat differences in breast density could be explained by wellknown confounders, including reproductive behaviour [34].Other studies on breast density have corrected for use of hormone replacement therapy (HRT). Only 13 % of Dutch women (49-70 years) used HRT in the 1990s [35], and the percentage is expected to be even lower since the publication of theMillion Women Study on the adverse effects of HRT [36].Based on the low HRT-use, this risk factor is not expected tohave had a significant effect here.To get more insight into the geographic differences, wefurther studied SES and urbanisation. A (weak) positive association between SES and breast density has been observedbefore [7, 9, 11]. Despite the differences in setting (e.g., country) and definitions (both SES and density), these results appear to be consistent with our observations. Potential explanatory factors include differences in BMI and reproductive behaviour. If a high BMI is associated with a low %DV and alow SES, then the differences in %DV between SES groupscould be explained by variation in BMI. In contrast, based onthe positive correlation between BMI and DV observed inprevious studies, BMI adjustment is only expected to increasevariation in DV [37, 38]. This was supported by the resultsfrom our models including total breast volume (a BMI-proxy).A linear association between urbanisation and breast density became apparent after SES adjustment. In general, theresults were somewhat suggestive of an increased density atthe highest urbanisation level. Two previous studies involvingurbanisation and BI-RADS density found a positive association [8, 10]. Both authors described a potential link with exposure to environmental factors. Aitken et al., on the otherhand, did not observe an association between a dichotomousrural/urban measure and breast density [7].One of the limitations of our study is that we used measuresat area level (i.e., postal codes) instead of individual level (likeeducational level) for both urbanisation and SES, which mayhave led to
BREAST Geographic variation in volumetric breast density between screening regions in the Netherlands Daniëlle van der Waal1 & Marleen J. Emaus2 & Marije F. Bakker2 & Gerard J. den Heeten3,4 & Nico Karssemeijer5 & Ruud M. Pijnappel3,6 & Wouter B. Veldhuis6 & André L. M. Verbeek1 & Carla H van Gils2 & Mireille J. M. Broeders1,3 Received: 19 November 2014/Revised: 10 March 2015/Accepted: 25 .