Transcription
AUGUST 2018THE COSTS OF CHRONICDISEASE IN THE U.S.BY HUGH WATERS AND MARLON GRAF
AUGUST 2018THE COSTS OF CHRONICDISEASE IN THE U.S.BY HUGH WATERS AND MARLON GRAF
ABOUT THE MILKEN INSTITUTEThe Milken Institute is a nonprofit, nonpartisan think tank determined to increase globalprosperity by advancing collaborative solutions that widen access to capital, createjobs, and improve health. We do this through independent, data-driven research, actionoriented meetings, and meaningful policy initiatives. 2018 Milken InstituteThis work is made available under the terms of the Creative Commons AttributionNonCommercial-NoDerivs3.0 Unported License, available at creativecommons.org/licenses/by-nc-nd/3.0/MILKEN INSTITUTE
TABLE OF CONTENTSEXECUTIVE SUMMARY.1INTRODUCTION. 4PREVALENCE. 5THE NATIONAL ECONOMIC IMPACT OF CHRONIC DISEASES. 8STATE-LEVEL ECONOMIC IMPACT OF CHRONIC DISEASES.11RISK FACTORS FOR CHRONIC DISEASES. 12PROJECTIONS OF THE COSTS OF CHRONIC DISEASES. 14APPENDIX. 15REFERENCES.16ABOUT US. 19MILKEN INSTITUTE
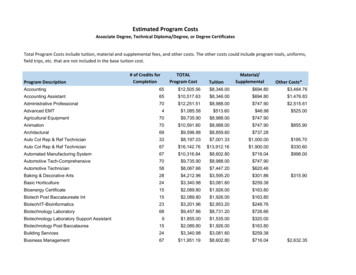
Executive SummaryThe total costs in the U.S. in 2016 for direct health care treatment for chronic health conditionstotaled 1.1 trillion—equivalent to 5.8 percent of U.S. gross domestic product (GDP) (Figure 1).The most expensive conditions in terms of direct health care costs are diabetes ( 189.6 billionin annual direct health care expenditures), Alzheimer’s disease ( 185.9 billion), and osteoarthritis( 115.5 billion). When the indirect costs of lost economic productivity are included, the total costsof chronic diseases in the U.S. increase to 3.7 trillion (Figure 2). This is equivalent to 19.6 percentof the U.S. GDP—in other words, nearly one-fifth of the U.S. economy.FIGURE 1Total Direct Costs of Chronic Diseases in the U.S., 2016 ( billions)Other Conditions 124.7Diabetes 189.6Cancers 98.6Arthritis and Back Pain 181.8Total Direct Costs 1.1 trillionCardiovascular Conditions 294.3Alzheimer's Disease 185.9Source: Milken Institute.The most common chronic health conditions in the U.S. are dyslipidemia, hypertension(high blood pressure), and osteoarthritis. In 2016, 94.7 million Americans had dyslipidemia,which is a cholesterol imbalance—that is, high levels of low-density lipoprotein (LDL) cholesterol(“bad” cholesterol) or low levels of high-density lipoprotein (HDL) cholesterol (“good” cholesterol).78.6 million individuals lived with hypertension, which is a significant risk factor for heart diseaseand stroke. Furthermore, 55.7 million U.S. residents had osteoarthritis, which leads to thebreakdown of joint cartilage. The fourth most prevalent chronic health condition in the U.S. istype 2 diabetes, which affected 26.7 million adults in 2016.MILKEN INSTITUTETHE COSTS OF CHRONIC DISEASES IN THE U.S.1
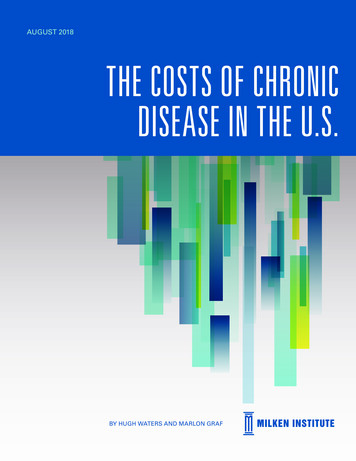
FIGURE 2Total Costs of Chronic Diseases in the U.S., 2016Other 267.5Diabetes 526.6Cancers 281.0Total Costs 3.7 trillionArthritis and Back Pain 843.4Cardiovascular Conditions 1,461.3Alzheimer's 268.3Source: Milken Institute.Obesity is by far the greatest risk factor contributing to the burden of chronic diseases in theU.S. The prevalence of obesity in the U.S. population has increased steadily since the 1960s.In 2016, diseases caused by obesity and being overweight accounted for 47.1 percent of the totalcost of chronic diseases in the U.S.—responsible for 480.7 billion in direct health care costs,plus 1.24 trillion in indirect costs related to lost economic productivity. The total cost of chronicdiseases due to obesity in 2016 was 1.72 trillion—equivalent to 9.3 percent of the U.S. GDPthat year.The increasing trends in the prevalence and costs of chronic diseases in the U.S. are projectedto continue well into the future. Moreover, these trends will be magnified by the aging of the U.S.population. By 2060, the U.S. population aged 65 years and older is projected to more thandouble—from 46 million today to more than 98 million. By 2030, an estimated 83.4 million peoplein the U.S. will have three or more chronic diseases—compared to 30.8 million in 2015.2THE COSTS OF CHRONIC DISEASES IN THE U.S.MILKEN INSTITUTE
TABLE 1Prevalence and Costs of Chronic Diseases in the U.S., 2016ConditionAlzheimer's or Vascular DementiaAsthmaBreast CancerChronic Back PainColorectal CancerCongestive Heart FailureCoronary Heart DiseaseDiabetes Type 2DyslipidemiaEnd Stage Renal DiseaseEndometrial CancerEsophageal AdenocarcinomaGallbladder CancerGallbladder DiseaseGastric Cardia AdenocarcinomaHypertensionLiver CancerLung CancerOsteoarthritisOvarian CancerPancreatic CancerProstate CancerRenal CancerStrokeDirect 185,917 40,201 23,086 66,239 18,479 28,281 72,497 189,618 74,887 5,107 3,472 1,963 52 79,415 4,038 66,257 348 14,448 115,523 6,702 537 17,659 7,770 52,338 1,074,832Costs (in Millions)Indirect 82,395 61,775 14,357 374,076 16,299 11,087 125,558 336,956††† 2,897 186 40 81,003 382 976,665 266 23,056 287,607 886 2,720 119,452 1,928 53,741 2,573,333Total 268,312 101,975 37,442 440,315 34,778 39,368 198,055 526,574 74,887 5,107 6,369 2,149 93 160,418 4,420 1,042,923 615 37,504 403,129 7,588 3,257 137,111 9,698 106,079 3,648,166† Included in heart disease, diabetes, and stroke.†† Included in diabetes and hypertension.Source: Milken Institute.MILKEN INSTITUTETHE COSTS OF CHRONIC DISEASES IN THE U.S.3
IntroductionThis study calculates the prevalence and economic effects of chronic diseases in the U.S.The study includes the direct costs of health care services to treat these diseases—costs paidby individuals, families, insurance companies, and employers—as well as the indirect costs thatrelate to work absences, lost wages, and reduced economic productivity. For each condition,the direct health care costs and the indirect costs are calculated and presented separately.The prevalence of each chronic health condition is calculated based on data from the U.S. Centersfor Disease Control and Prevention (CDC). The CDC compiles prevalence estimates from statereports and registries, as well as data reported through national surveys, including the NationalHealth and Nutrition Examination Survey (NHANES).1 The CDC prevalence data are compared withestimates from other sources, including published data in peer-reviewed academic journals.The principal source for the costs of medical treatment for different chronic conditions is theMedical Expenditure Panel Survey (MEPS).2 The MEPS is a nationally representative sample ofnon‐institutionalized Americans collected by the U.S. Agency for Healthcare Research and Quality(AHRQ). It includes a household survey component and an insurance component, which providesinformation for employer‐provided insurance plans. We also use the results of separate studiesconducted by the CDC3 and the National Cancer Institute,4 as well as published journal articles.All data are from the year 2016, which is the most recent year available. The amounts recordedare in 2016 U.S. dollars. Cost estimates for 2016 are not available for some rare health conditions,so we updated earlier estimates from peer-reviewed literature using health care inflation ratescalculated by the Bureau of Labor Statistics for the Consumer Price Index.5 The estimates ofindirect economic costs related to lost productivity are calculated and reported separately fromdirect medical costs.4THE COSTS OF CHRONIC DISEASES IN THE U.S.MILKEN INSTITUTE
PrevalenceTable 2 shows the numbers of individuals in the United States living with each of the mostprevalent chronic diseases.TABLE 2Total Prevalence of Chronic Conditions in the U.S., 2016ConditionAlzheimer's or Vascular DementiaAsthmaBreast CancerChronic Back PainColorectal CancerCongestive Heart FailureCoronary Heart DiseaseDiabetes Type 2DyslipidemiaEnd Stage Renal DiseaseEndometrial CancerEsophageal AdenocarcinomaGallbladder CancerGallbladder DiseaseGastric Cardia AdenocarcinomaHypertensionLiver CancerLung CancerOsteoarthritisOvarian CancerPancreatic CancerProstate CancerRenal 8,794,418References678910, 1112, 13, 14, 151416,171819, 2010, 1110, 11, 1210, 112210, 121410, 1210, 23242510, 1110, 1110, 1114Source: Milken Institute.The most common conditions are hypertension (high blood pressure), dyslipidemia, andosteoarthritis. In the U.S. in 2016, 94.7 million Americans had dyslipidemia, which is a cholesterolimbalance—indicating high levels of low-density lipoprotein (LDL) cholesterol (“bad” cholesterol),or low levels of high-density lipoprotein (HDL) cholesterol (“good” cholesterol). 78.6 millionindividuals lived with hypertension, which is a significant risk factor for heart disease and stroke.26MILKEN INSTITUTETHE COSTS OF CHRONIC DISEASES IN THE U.S.5
Furthermore, 55.7 million U.S. residents had osteoarthritis, which leads to the breakdown of jointcartilage. Osteoarthritis is most common among the elderly and is more prevalent in the easternU.S., particularly the southern parts of the Appalachian region (see Figure 3).FIGURE 3Prevalence of Osteoarthritis as % of Population, 2016 27NATIONAL PREVALENCE 17.1%Source: Milken Institute.6THE COSTS OF CHRONIC DISEASES IN THE U.S.MILKEN INSTITUTE
The fourth most prevalent chronic health condition in the U.S. is type 2 diabetes, which affected26.7 million people in 2016—or 10.9 percent of the adult population (Figure 4). The prevalence ofdiabetes is strongly correlated with the prevalence of obesity in the U.S.FIGURE 4Prevalence of Type 2 Diabetes as % of Adult Population, 2016 16NATIONAL PREVALENCE 10.9%Source: Milken Institute.MILKEN INSTITUTETHE COSTS OF CHRONIC DISEASES IN THE U.S.7
The National Economic Impact ofChronic DiseasesFor each chronic health condition included in this report, the costs of health care treatment arebased on a detailed review of the research literature, as indicated by the sources used in Table 3.Health care expenditures are grouped by medical condition based on the Clinical ClassificationSoftware (CCS), developed by AHRQ, which categorizes medical conditions into 260 exclusivegroups.28 The resulting estimates of the costs for each chronic condition are presented in Table 3.TABLE 3Costs per Individual for Each Health ConditionConditionAlzheimer's or Vascular DementiaAsthmaBreast CancerChronic Back PainColorectal CancerCongestive Heart FailureCoronary Heart DiseaseDiabetes Type 2DyslipidemiaEnd Stage Renal DiseaseEndometrial CancerEsophageal AdenocarcinomaGallbladder CancerGallbladder DiseaseGastric Cardia AdenocarcinomaHypertensionLiver CancerOsteoarthritisOvarian CancerPancreatic CancerProstate CancerRenal CancerStrokeCost per Case, 2016DirectIndirect 33,084 14,662 1,844 2,834 6,291 3,912 2,098 11,848 * 13,723 12,104 4,287 1,680 4,329 7,497 7,109 12,633 791† 7,285†† 4,781 3,991 42,167 3,991 5,219 3,991 3,912 3,991 42,167 3,991 843 12,423 5,219 3,991 2,074 5,165 30,181 3,991 8,308 42,061 5,724 38,718 16,080 3,991 5,951 6,111References29, 30, 31, 32333, 34, 35, 362, 374, 34, 3638, 3938, 3940, 4142, 4344, 45, 462, 32, 32, 32, 32, 338, 39, 42, 472, 348, 34, 352, 33, 4, 38362, 331, 39, 47, 33, 40*For chronic back pain, the indirect costs amount is calculated by applying the median proportion of direct vs. indirect costs from a literaturereview of the costs of back pain, resulting in a range of estimates of indirect costs in the U.S. in 2014 from 84.1 to 624.8 billion, or 5,127 to 38,091 per case. 49† Included in heart disease, diabetes, and stroke. 50†† Included in diabetes and hypertension.Source: Milken Institute.8THE COSTS OF CHRONIC DISEASES IN THE U.S.MILKEN INSTITUTE
In 2016, the total costs in the U.S. for direct health care treatment for chronic health conditionstotaled 1.1 trillion (Figure 5)—equivalent to 5.8 percent of U.S. GDP. The most expensiveconditions in terms of direct health care costs are diabetes ( 189.6 billion in annual direct healthcare expenditures), Alzheimer’s disease ( 185.9 billion), and osteoarthritis ( 115.5 billion).FIGURE 5Direct Health Care Costs of Chronic Diseases, 2016 (in millions)Prostate Cancer 17,659Pancreatic Cancer 537Renal Cancer 7,770Ovarian Cancer 6,702Stroke 52,338Alzheimer's 185,917Lung Cancer 14,448Asthma 40,201Osteoarthritis 115,523Liver Cancer 348Hypertension 66,257Gastric CardiaAdenocarcinoma 4,038Total Direct Costs 1.1 trillionBreast Cancer 23,086Chronic Back Pain 66,239Gallbladder Disease 79,415Gallbladder Cancer 52Colorectal Cancer 18,479EsophagealAdenocarcinoma 1,963Endometrial Cancer 3,472Diabetes 189,618ESRD 5,107Dyslipidemia 74,887CHF 28,281CHD 72,497Source: Milken Institute.MILKEN INSTITUTETHE COSTS OF CHRONIC DISEASES IN THE U.S.9
When the indirect costs of lost economic productivity are included, the total costs of chronicdiseases in the U.S. increase to 3.7 trillion (Figure 6). This is equivalent to 19.6 percent of theU.S. GDP in 2016—in other words, nearly one-fifth of the U.S. economy.FIGURE 6The Total Costs of Chronic Diseases in the U.S., 2016 (in Millions)Prostate Cancer 137,111Renal CancerPancreatic Cancer 3,257 9,698Stroke 106,079Ovarian Cancer 7,588Asthma 101,975Breast Cancer 37,442Alzheimer's 268,312Lung Cancer 37,504Osteoarthritis 403,129Liver Cancer 615Chronic Back Pain 440,315Colorectal Cancer 34,778Total Costs 3.7 trillionCHD 198,055CHF 39,368Hypertension 1,042,923Diabetes 526,574Dyslipidemia 74,887Gastric Cardia Adenocarcinoma 4,420Gallbladder Disease 160,418Gallbladder Cancer 93EsophagealAdenocarcinoma 2,149ESRD 5,107Endometrial Cancer 6,369Source: Milken Institute.10THE COSTS OF CHRONIC DISEASES IN THE U.S.MILKEN INSTITUTE
State-Level Economic Impact ofChronic DiseasesAcross the U.S., direct health care expenditures for chronic conditions average 3,300 per person.The average indirect costs, including lost productivity, are 7,901 per person. Table 5 in theAppendix show the levels of per-capita spending for chronic health conditions by state—for directhealth care spending and for the total economic costs of these diseases, respectively.The highest levels of per capita spending on chronic health conditions occur in West Virginia,Alabama, Florida, and Maine—all states with relatively older populations. Maine has the highestmedian age of any state in the U.S.—44.5 years. West Virginia has the fourth highest medianage (42.3 years) and Florida the fifth highest (42.1 years).51 As with the prevalence of chronicconditions, the costs are highest in the eastern U.S. The national per capita average total cost ofchronic diseases is 11,201.Combined, direct health care expenditures and the costs of lost productivity due to chronicdiseases impose a significant economic burden on individuals, families, employers, andgovernments across the U.S. This impact is particularly acute in the east and southeast partsof the country.MILKEN INSTITUTETHE COSTS OF CHRONIC DISEASES IN THE U.S.11
Risk Factors for Chronic DiseasesObesity is by far the greatest risk factor contributing to the burden of chronic diseases in theU.S. As shown in Table 4 and Figure 7, the prevalence of obesity in the U.S. population hasincreased steadily since the 1960s. In 2016, diseases caused by obesity and being overweightaccounted for 47.1 percent of the total cost of chronic diseases in the U.S.—responsible for 480.7 billion in direct health care costs, plus 1.24 trillion in indirect costs related to losteconomic productivity. The total cost of chronic diseases due to obesity in 2016 was 1.72 trillion—equivalent to 9.3 percent of the U.S. GDP that year.52TABLE 4Prevalence of Overweight, Obesity, and Severe Obesity Among Adults53, 0062007-20102011-20142015-2016Overweight, Not Severe Obesity (BMI 40)0.9%1.3%1.4%2.9%4.9%5.4%6.0%6.9%N/ANote: The surveys were conducted in rounds, corresponding to the years listed in the chart. Initially, the surveys were not continuous. No surveyyears are missing from the data presented.Source: Milken Institute.12THE COSTS OF CHRONIC DISEASES IN THE U.S.MILKEN INSTITUTE
FIGURE 7Prevalence of Obesity in the U.S. Adult Population Over Time40%35%30%25%20%15%10%5%0162015-22011201407-2 010202003-2 0062009 -21999481988061971971-741960-620%Note: The years 1960-1962 were pulled from data from the National Health Examination Survey (NHES). From 1971 onward, the data is from theNational Health and Nutrition Examination Surveys (NHANES).Source: Milken Institute.Other important behavioral risk factors for chronic diseases include smoking and exposure tosecondhand smoke. Approximately 8.7 percent of health care spending in the U.S. is attributable tocigarette smoking, and 60 percent of this amount is paid by public sources—Medicare, Medicaid,and other U.S. federal and state health programs.55 In 2015, 36.5 million U.S. adults were currentcigarette smokers—15.1 percent of all adults. This rate has decreased from 20.9 percent in 2005.56Health problems caused by excessive drinking cost 27.4 billion in the U.S. in 2010—1 percent ofthe total cost of chronic diseases and 11 percent of the total costs of alcohol abuse.57MILKEN INSTITUTETHE COSTS OF CHRONIC DISEASES IN THE U.S.13
Projections of the Costs of Chronic DiseasesThe increasing trends in the prevalence and costs of chronic diseases in the U.S. are projectedto continue well into the future. Moreover, these trends will be magnified by the aging of the U.S.population. By 2060, the U.S. population aged 65 years and older is projected to more thandouble—from 46 million today to more than 98 million.58 By 2030, an estimated 83.4 million peoplein the U.S. will have three or more chronic diseases—compared to 30.8 million in 2015.59 Spendingon prescription drugs is projected to increase more rapidly than health care spending overall.60These trends will impose upward pressure on health care spending in the United States. U.S. healthcare spending is already substantially higher than comparable high-income countries. Health spendingper person in the U.S. was 10,348 in 2016—31 percent higher than Switzerland, the next highestspender on a per capita basis.61 These trends make it very clear that the U.S. will need to identify andimplement effective policies to prevent and manage chronic diseases.14THE COSTS OF CHRONIC DISEASES IN THE U.S.MILKEN INSTITUTE
AppendixTABLE 5Costs of Chronic Diseases by State, issouriMontanaNebraskaNevadaNew HampshireNew JerseyNew MexicoNew YorkNorth CarolinaNorth DakotaOhioOklahomaOregonPennsylvaniaRhode IslandSouth CarolinaSouth est VirginiaWisconsinWyomingTotalsMILKEN INSTITUTE2017 Pop.(millions)Direct Costs( B)Indirect Costs( B)Total Cost( B)Per CapitaDirect CostsPer CapitaIndirect 0.68.57.41.85.80.6325.7 18.2 2.0 23.4 10.6 123.4 16.0 12.2 2.2 3.2 76.8 33.4 4.7 5.2 41.6 22.4 10.5 9.3 15.7 16.0 4.8 19.8 22.8 34.9 17.0 10.5 21.0 3.4 5.9 9.4 4.4 29.3 7.0 67.6 34.0 2.4 39.9 13.2 13.4 45.6 3.7 17.6 2.7 23.4 85.0 8.2 2.1 27.6 23.3 7.1 19.3 1.8 1,075 42.1 5.3 55.2 24.8 300.4 41.5 28.5 5.6 7.7 172.7 82.2 11.0 12.9 99.9 53.3 24.5 22.0 37.4 37.7 11.3 47.7 55.2 82.5 41.9 24.5 49.7 8.2 14.3 23.2 10.7 69.5 16.5 158.9 82.4 5.8 94.8 31.6 32.9 105.8 8.6 41.6 6.5 56.2 211.5 21.4 5.0 66.5 57.5 16.3 45.7 4.4 2,573 60.3 7.4 78.7 35.4 423.8 57.5 40.7 7.8 10.9 249.5 115.6 15.7 18.1 141.5 75.7 35.0 31.3 53.1 53.7 16.1 67.5 77.9 117.4 58.9 34.9 70.7 11.6 20.2 32.6 15.1 98.8 23.5 226.5 116.5 8.2 134.7 44.8 46.3 151.4 12.4 59.2 9.3 79.7 296.5 29.6 7.0 94.0 80.8 23.4 65.0 6.2 3,648 3,724 2,765 3,341 3,533 3,122 2,856 3,393 3,173 3,324 3,660 3,205 3,267 3,026 3,249 3,353 3,333 3,180 3,530 3,417 3,599 3,268 3,320 3,503 3,054 3,502 3,434 3,243 3,089 3,145 3,292 3,248 3,350 3,404 3,314 3,197 3,422 3,369 3,230 3,559 3,505 3,499 3,145 3,491 3,005 2,639 3,325 3,253 3,144 3,908 3,324 3,093 3,300 8,641 7,194 7,871 8,241 7,598 7,404 7,940 8,078 7,963 8,232 7,883 7,739 7,513 7,803 8,001 7,792 7,557 8,390 8,047 8,460 7,883 8,041 8,282 7,508 8,196 8,132 7,777 7,423 7,729 7,958 7,717 7,904 8,007 8,023 7,702 8,130 8,036 7,950 8,263 8,154 8,276 7,502 8,373 7,472 6,890 7,968 7,849 7,771 8,961 7,887 7,550 7,901Per CapitaTotal Costs 12,365 9,959 11,212 11,774 10,720 10,259 11,333 11,251 11,287 11,892 11,087 11,006 10,539 11,051 11,354 11,125 10,737 11,920 11,464 12,060 11,151 11,361 11,785 10,562 11,698 11,567 11,020 10,512 10,873 11,250 10,966 11,253 11,412 11,336 10,899 11,552 11,405 11,180 11,822 11,659 11,774 10,646 11,864 10,477 9,529 11,293 11,102 10,915 12,869 11,211 10,643 11,201THE COSTS OF CHRONIC DISEASES IN THE U.S.15
References1.“National Health and Nutrition Examination Survey (NHANES),” Centers for Disease Control and Prevention (CDC), National Centerfor Health Statistics (NCHS), accessed June 27, 2018, ical Expenditure Panel Survey,” U.S. Department of Health and Human Services, Agency for Healthcare Research and Quality(AHRQ), accessed June 27, 2018, http://meps.ahrq.gov/mepsweb/.3.Angela B. Mariotto, K. Robin Yabroff, Yongwu Shao, Eric J. Feuer, and Martin L. Brown, “Projections of the Cost of Cancer Care inthe United States: 2010–2020,” Journal of the National Cancer Institute 103, (2011): 117–128.4.“Cancer Prevalence and Cost of Care Projections,” National Institutes of Health, National Cancer Institute (NCI), accessedJune 27, 2018, http://costprojections.cancer.gov/.5.“CPI Inflation Calculator,” Department of Labor, Bureau of Labor Statistics, accessed June 27, 2018, http://www.bls.gov/data/inflation calculator.htm.6.“2017 Alzheimer’s Disease Facts and Figures: Summary of State-Specific Data,” Alzheimer’s Association, accessed June 27, 2018,https://www.alz.org/documents custom/2017-facts-and-figures.pdf.7.“2015 Adult Asthma Data: Prevalence Tables and Maps,” Centers for Disease Control and Prevention (CDC), accessedJune 27, 2018, 8.“Cancer Stat Facts: Female Breast Cancer,” National Institutes of Health, National Cancer Institute, Surveillance, Epidemiology,and End Results Program (SEER), accessed June 27, 2018, .9.Anna Shmagel, Robert Foley, and Hassan Ibrahim, “Epidemiology of Chronic Low Back Pain in US Adults: National Health andNutrition Examination Survey 2009-2010,” Arthritis Care & Research 68, no. 11 (2016): 1688–1694.10. “Cancer Stat Facts: Colorectal Cancer,” National Institutes of Health, National Cancer Institute, Surveillance, Epidemiology, and EndResults Program (SEER), accessed June 27, 2018, ml.11. “Cancer Facts & Figures 2017,” American Cancer Society, accessed June 27, 2018, -2017.html.12. “Heart Disease,” Centers for Disease Control and Prevention (CDC), National Center for Health Statistics (NCHS), accessedJune 27, 2018, 13. Saketram Komanduri, Yogesh Jadhao, Sai S Guduru, Pramil Cheriyath, and Yijin Wert, “Prevalence and Risk Factors of Heart Failurein the USA: NHANES 2013-2014 Epidemiological Follow-up Study,” Journal of Community Hospital Internal Medicine Perspectives 7,no. 1 (2017): 15–20.14. “Heart Disease and Stroke Statistics—2017 Update,” American Heart Association, 00000000000485.15. Anh L. Bui, Tamara B. Horwich, and Gregg C. Fonarow, “Epidemiology and Risk Profile of Heart Failure,” National Review ofCardiology 8, no. 1 (2011): 30-41.16. “Diabetes in the United States,” The State of Obesity, a project of the Trust for America’s Health and the Robert Wood JohnsonFoundation, accessed June 27, 2018, http://stateofobesity.org/diabetes/.17. “National Diabetes Statistics Report, 2017: Estimates of Diabetes and Its Burden in the United States,” Centers for Disease Controland Prevention (CDC), Division of Diabetes Translation, accessed June 27, 2018, national-diabetes-statistics-report.pdf.18. “Cholesterol Fact Sheet,” Centers for Disease Control and Prevention (CDC), Division for Heart Disease and Stroke Prevention,accessed June 27, 2018, http://www.cdc.gov/dhdsp/data statistics/fact sheets/fs cholesterol.htm.19. “National Chronic Kidney Disease Fact Sheet, 2017,” Centers for Disease Control and Prevention, accessed June 27, 2018, http://www.cdc.gov/diabetes/pubs/pdf/kidney Factsheet.pdf.20. “2017 USRDS Annual Data Report,” United States Renal Data System, https://www.usrds.org/2017/ref/ESRD Ref BPrevalence 2017.xlsx.21. “Cancer Stat Facts: Esophageal Cancer,” National Institutes of Health, National Cancer Institute, Surveillance, Epidemiology, andEnd Results Program (SEER), accessed June 27, 2018, 6THE COSTS OF CHRONIC DISEASES IN THE U.S.MILKEN INSTITUTE
22. James E. Everhart, Meena Khare, Michael Hill, and Kurt R. Maurer, “Prevalence and Ethnic Differences in Gallbladder Disease in theUnited States,” Gastroenterology 117, no.3 (1999): 632.23. “Key Statistics for Lung Cancer,” American Lung Association, accessed June 27, 2018, ancer/about/key-statistics.html.24. Kamil E. Barbour, Charles G. Helmick, Michael Boring, and Teresa J. Brady, “Vital Signs: Prevalence of Doctor-Diagnosed Arthritisand Arthritis-Attributable Activity Limitation — United States, 2013–2015,” Morbidity and Mortality Weekly Report (MMWR) 66,no. 9 (2017): 246–253.25. “Cancer Stat Facts: Ovarian Cancer,” National Institutes of Health, National Cancer Institute, Surveillance, Epidemiology, and EndResults Program (SEER), accessed June 27, 2018, 26. “High Blood Pressure Fact Sheet,” Centers for Disease Control and Prevention (CDC), Division for Heart Disease and StrokePrevention, accessed June 27, 2018, https://www.cdc.gov/dhdsp/data statistics/fact sheets/fs bloodpressure.htm.27. “State-Specific 2015 BRFSS Arthritis Prevalence Estimates,” Centers for Disease Control and Prevention (CDC), accessedJune 27, 2018, https://www.cdc.gov/arthritis/data statistics/state-text.htm#figure1.28. Tina Highfill, “Comparing Estimates of U.S. Health Care Expenditures by Medical Condition, 2000–2012,” Bureau of EconomicAnalysis (2016), https://www.bea.gov/scb/pdf/2016/3%20March/0316 comparing u.s. health care expenditures by medicalcondition.pdf.29. Michael D. Hurd, Paco Martorell, Adeline Delavande, Kathleen J. Mullen, and Kenneth M. Langa, “Monetary Costs of Dementia in theUnited States,” New England Journal of Medicine 368, (2013): 1326–1334.30. Richard G. Stefanacci, “The Costs of Alzheimer’s Disease and the Value of Effective Therapies,” American Journal of Managed Care17, (2011): S356–S362.31. “Alzheimer’s Statistics,” Alzheimers.net, accessed June 27, 2018, tistics/.32. "2018 Alzheimer's Facts & Figures," Alzheimer's Association, accessed July 5, 2018, 0Figures/facts-and-figures.pdf.33. Harvey Rappaport and Vijayveer Bonthapally, “The Direct Expenditures and Indirect Costs Associated with Treating Asthma in theUnited States,” Journal of Allergy & Therapy 3, no. 2 (2012).34. Anne M. Wolf and Graham A. Colditz, “Current Estimates of the Economic Cost of Obesity in the United States,” Obesity Research 6,no. 2 (1998): 97–106.35. Ron Z. Goetzel, Stacey R. Long, Ronald J. Ozminkowski, Kevin Hawkins, Shaohung Wang, and Wendy Lynch, “Health, Absence,Disability, and Presenteeism – Cost Estimates of Certain Physical and Mental Health Conditions Affecting U.S. Employers,”Journal of Occupational and Environmental Medicine 46, no. 4 (2004): 398–412.36. Zhiyuan Zheng, K. Robin Yabroff, Gery P. Guy, Xuesong Han, Chunayu Li, Matthew P. Banegas, Donatus U. Ekwueme, and AhmedinJemal, “Annual Medical Expenditure and Productivity Loss among Colorectal, Female Breast, and Prostate Cancer Survivors in theUnited States,” Journal of the National Cancer Institute 108, no. 5 (2016).37. “Back Problems: Use and Expenditures for the U.S. Adult Population, 2007,” Medical Expenditure Panel Survey Statistical Brief#289, Department of Health and Human Services, Agency for Healthcare
MILKEN INSTITUTE THE COSTS OF CHRONIC DISEASES IN THE U.S. 3 TABLE 1 Prevalence and Costs of Chronic Diseases in the U.S., 2016 Condition Costs (in Millions) Direct Indirect Total Alzheimer's or Vascular Dementia 185,917 82,395 268,312 Asthma 40,201 61,775 101,975