Transcription
1Local Market SnapshotAnn Arbor, MIPrepared by: Market Intelligence, Global MarketingDecember 2021ManpowerGroup Proprietary and Confidential
2IntroductionOverviewEvery market is unique in terms of its occupations, industries and demographics. As such, each one of these factors, aswell as myriad others, plays a role in determining overall growth of the market and its ability to foster current and futuredemand for labor. For a company, an understanding of key labor indicators in the market will guide in the comparisonsof markets. Additionally, knowledge of market specific indicators and trends will help the company in strategic decisionsrelating to pricing determination, recruiting initiatives and fostering of retention of its workforce.This Local Market Snapshot report provides a view into the top occupation groups and industry sectors within themarket. Additionally, overall market information such as historical occupation growth, unemployment information and ademographic comparison of the market to the National average are provided. The information is pure, unfilteredexternal data that provides the best available perspective on the market.Geographic Market ViewAnn Arbor, MIThe geographic view provides general employment size and growth statistics for Ann Arbor, MI.Local/State/National Geographic Components:OverallTotal Contingent/TemporaryTotal ProfTotal CommTotal Proj. Total Proj.Job GrowthJob GrowthTotal JobsGrowth Growth % Total Prof% (2022- Total Comm% (2022(2021) (2022-2024) (2022-2024) Jobs (2021)2024) Jobs (2021)2024)LocationEst. TempEst. TempJobLabor Jobs verallLocationTotal Local MarketWashtenaw County, MITotal Proj. Total Proj.Growth Growth %Total 21)CommTempLaborJobs(2021)19,67058,910606,800 1,687,710Total Contingent/TemporaryTotal Total ProfProf JobJobGrowth Growth %(2022(20222024)2022)Total Total CommComm Job GrowthJobs% (2022(2021)2024)Est. TempLaborJobs(2021)Est. 0.5%2,2001.1%7701,430ManpowerGroup Proprietary and Confidential
3Geographic Market ViewNotesManpowerGroup Proprietary and Confidential
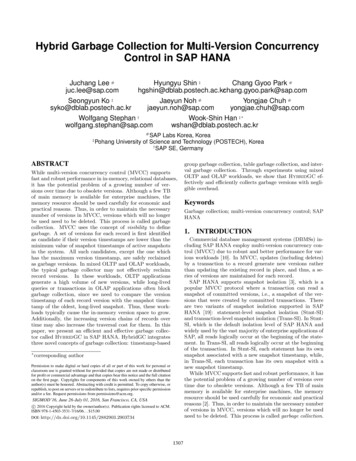
4Geographic Market View – Employment SituationAnn Arbor, MIQuarterly OverviewThe table below identifies the most current labor force, employment and unemployment figures for the market, basedon quarterly averages from the last several quarters of data provided. This data is up-to-date as of November 2021.Monthly views of local employment data are available here: https://data.bls.gov/cgi-bin/dsrv?laWorkforce StatisticsLabor ForceTotal EmployedTotal UnemployedUnemployment RateQ3 2021Q2 2021Q1 2021Q4 2020Q3 2020Q2 2020Q1 2020Q4 35195,1344,8012.5%201,699197,5744,1252.1%Source: Bureau of Labor Statistics (BLS).Job GrowthTotal employment for the U.S. is projected to edge up in 2021 (up 0.9%) due to impacts from the labor shortage but willincrease by 1.98 million jobs (1.4%) during the 2022-2024 time period. The chart below compares overall job estimatesand job growth projections for Ann Arbor, MI with National estimates based on a quicker recovery scenario.% Total Job Growth (Region vs. National)% Total Job Growth(Base Year - 2014)15%10%5%0%-5%-10%Nation - Quick recovery scenarioRegion - Quick recovery scenarioSource: EMSI, BLS 2020-2030 employment projectionsUnemploymentUnemployment statistics are a key indicator of local economic conditions and have a major influence on wages andlabor participation rates. Negative disturbances in local markets can also affect migration patterns and the availabilityof skilled workers. The chart below compares the current local/regional unemployment rate to the Nationalunemployment rate (both unadjusted and seasonally adjusted).Unemployment Rate20%Unemployment Rate (Region vs. National)15%10%5%0%RecessionNational Unemployment Rate (Unadjusted)Source: Local Area Unemployment Statistics (LAUS)ManpowerGroup Proprietary and ConfidentialNational Unemployment Rate (Seasonally Adjusted)Region Unemployment Rate (Unadjusted)
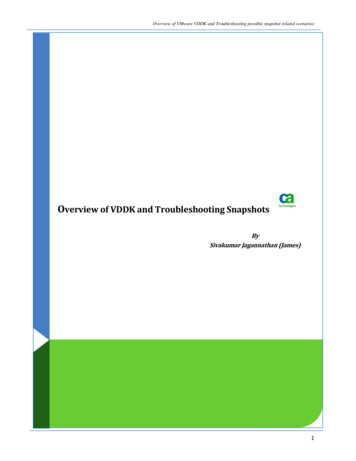
5Geographic Market View – Demographic OverviewAnn Arbor, MIIn addition to overall employment conditions, the composition of the overall population in the market should also beconsidered when planning tactics surrounding recruiting, retention and expansion activities.The first table compares the local breakdown of race/ethnicity compared to the national figures, and the second tabledepicts the population mix by age group.RegionTotal U.S.2020 Race/Ethnicity BreakdownPopulation% of TotalPopulation% of TotalWhite, Non-Hispanic256,68570.04%196,773,39059.72%Black or African American43,76211.94%41,427,34112.57%American Indian and Alaska 67,1975.88%Native Hawaiian and Other Pacific Islander1460.04%613,5070.19%Two or More Races12,4513.40%7,557,4712.29%White, Hispanic15,2734.17%53,536,33416.25%Non-White, Hispanic3,2410.88%7,776,5452.36%Total Population (2020)366,473100%329,484,123100%2020 Age BreakdownPopulation% of TotalPopulation% of TotalUnder 9296.4%20 - 3499,12027.0%67,664,40120.5%35 - 4962,46217.0%62,106,79818.8%50 - 6462,68417.1%62,799,20419.1%65 55,08715.0%55,659,36516.9%Core Working Population 20 - 64224,26661.2%192,570,40358.4%Total Population (2020)366,473100%329,484,123100%RegionTotal U.S.The chart below compares the current age composition of the local population to the National average. A completely"average" local population would have a value of “0%” across all age groups. Values above “0” represent age groupsthat are more prevalent in the local geography while values below “0” represent age groups that are less prevalent.This data is an indicator of the high degree to which national employment trends, including the impending talentshortage, could impact this market.Population Concentration by Age GroupRegion vs National : Population Estimates Vintage 2020ManpowerGroup Proprietary and Confidential
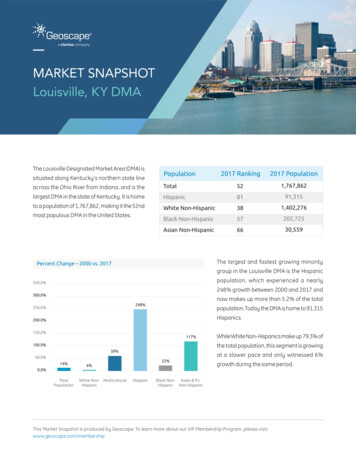
6Occupation Market OverviewHigh Level Occupation (Major Group) – Ann Arbor, MIThe Occupation section provides insight into the overall top occupation groups for the Ann Arbor, MI market to provide high-level trend insight. The occupationdata in this view is based on the Standard Occupational Classification (SOC) coding structure.Top Occupation GroupsNumber of Jobs (000s)308.0%6.0%254.0%Major Occupation Group (2-digit SOC)Education, training, and library oc 4329Office and administrative support o Healthcare practitioners and techni 1Food preparation and serving relate Sales and related .6%0.6%13Business and financial operations o 11,94812,2453.8%1901.6%31Healthcare support occupations10,76311,2146.2%900.9%1153Management occupationsTransportation and material moving duction occupationsComputer and mathematical science o 39Architecture and engineering occupationsPersonal care and service 8%-8.0%3749Building and grounds cleaning and m Installation, maintenance, and repa ity and social services occup Construction and extraction %1927Life, physical, and social science Arts, design, entertainment, sports ive service occupationsLegal rming, fishing, and forestry occu 2742908.0%31.0%2.0%0.0%-2.0%10-4.0%5Total Jobs (2021)Total Jobs (2024)ManpowerGroup Proprietary and ConfidentialInstallation, maintenance Building and grounds clea Personal care and service Architecture and engineer Computer and mathematical Production occupationsTransportation and materi Management occupationsHealthcare support occupationsBusiness and financial op Sales and related occupationsFood preparation and serv Healthcare practitioners Office and administrative Education, training, and 0Est.Temp Est. TempLaborJobJobs owth %Total Jobs Total Jobs(2022(2021)(2024)2024)25,15125,4281.4%Total Proj. Growth % (2022-2024)
7Industry Market ViewHigh Level Industry Sector – Ann Arbor, MIAnother key component to an overall understanding of the market is the identification of the growth patterns and employment distributions within the top industrysegments. The industry data in this section is provided at the 2-digit North American Industry Classification System (NAICS) level to provide a high-level trendsummary of the marketNumber of Jobs (000s)Top Industry .0%-5.0%8070605040302010Total Jobs (2021)Total Jobs 2024ManpowerGroup Proprietary and ConfidentialReal Estate and Rental an Educational ServicesFinance and InsuranceTransportation and WarehousingOther Services (except Pu ConstructionInformationWholesale TradeAdministrative and Suppor Accommodation and Food Se ManufacturingRetail TradeProfessional, Scientific, Health Care and Social As Government (Public Admini 0Total Projected Growth % (2022-2024)Industry Sector (2-Digit NAICS)Government (Public Admini Health Care and Social As Professional, Scientific, Retail TradeManufacturingAccommodation and Food Se Administrative and Suppor Wholesale TradeInformationConstructionOther Services (except Pu Transportation and WarehousingFinance and InsuranceEducational ServicesReal Estate and Rental an Arts, Entertainment, and Management of Companies a UtilitiesUnclassifiable EstablishmentsUnclassifiable 8-495261537155229999TotalJobs Total 23387478387478TotalProj.Growth% 6081521013327302415466Total CommJobs ,1973,7822,6883,3491,223422484808330257256-
8Industry Market View –EstablishmentsEstablishments by Employment Size – Ann Arbor, MIAt a high level, industry location data can add another dimension to the evaluation of economic activity in a market. By viewing the number of establishments byemployment size, this can help determine the distribution of employment (and competition) across industries. This can be used to set strategy and guide furtherinvestigation into the market. An establishment is a single physical location where business is conducted or where services or industrial operations are performed. Acompany may have one or many establishments.Establishment Size CategoryIndustry Sector (2-Digit NAICS)Agriculture, Forestry, Fishing and anufacturing31-333251145649373127730Wholesale Trade41-422981546239211110000Retail Trade44-451,0844212682021193335600Transportation and 9362927137040Finance and Insurance52443264116351943000Real Estate and Rental and Leasing5336124465331250000Professional, Scientific, and Technical Services541,2827822031331023914800Management of Companies and Enterprises5570286111153300Administrative and Support and Waste Management andRemediation Services56439243725644116430Educational Services611476830231664000Health Care and Social Assistance629734142271551093221904Arts, Entertainment, and Recreation711769824222047000Accommodation and Food Services728381731381902507017000Other Services (except Public Administration)818024521861074385000Unclassifiable 729316737104Total'500-999' '1000 or more'00NOTE: Data for 2020 County Business Patterns (CBP) were released in June 2021. These data include counts of establishments by the employment size of the establishment. The series excludes data on selfemployed individuals, employees of private households, railroad employees, agricultural production employees, and most government employees.ManpowerGroup Proprietary and Confidential
9AppendixData SourcesThe market snapshot report uses external data generated by Economic Modeling Specialists Inc. (EMSI), a dataprovider that integrates economic, labor market, demographic, and education data from 70 government andprivate sector sources. Primary Federal sources for this information include the U.S. Department of Commerce(including the Bureau of Economic Analysis (BEA) and the U.S. Census Bureau) and the U.S. Department ofLabor (including the Bureau of Labor Statistics (BLS) and the Employment and Training Administration (ETA)).EMSI’s data represents both full and part-time jobs. Unlike individual government sources, EMSI’s data includesjobs held by nearly all types of workers: payroll workers (who have unemployment insurance), railroad workers,military workers, and sole proprietors. Geographic data is organized using standard geopolitical units such as states, counties, and groups ofcounties called metropolitan or micropolitan statistical areas. Industry data is categorized using a production-oriented industry classification system called the NorthAmerican Industry Classification System (NAICS) at the 2-digit (sector) and 4-digit (industry group) levels. Occupation data is categorized using Occupational Information Network’s Standard OccupationalClassification (O*NET-SOC or “SOC”) definitions at the 2-digit (major group) and 5-digit (detailedoccupation) levels.The demographic data in this report is compiled from several sources using a specialized process. Sourcesinclude US Census Bureau annual estimates, birth and mortality rates from the US Health Department, andprojected regional job growth.The employment situation and unemployment data in this report comes from the Bureau of Labor Statistics' LocalArea Unemployment Statistics, which is updated every two months.The jobs and growth in the geography, occupation and industry sections is based on The Quarterly Census ofEmployment and Wages (QCEW). The QCEW program cooperates with the various state labor marketinformation agencies to collect data from the roughly 9 million U.S. business establishments covered byunemployment insurance (UI) on a quarterly basis (as well as federal agencies subject to the UnemploymentCompensation for Federal Employees program). The data represent about 97% of all wage and salary civilianemployment in the country and comprise a complete set of monthly employment and quarterly wage informationat the national, state, metropolitan area, and county levels. The QCEW, while not as frequently published as othersurveys from the Bureau of Labor Statistics (BLS), contains more detailed employment data (within geographies,occupations and industries) and encompasses more of the total workforce. The table below outlines the majorgovernmental sources of data.ManpowerGroup Proprietary and Confidential
This Local Market Snapshot report provides a view into the top occupation groups and industry sectors within the market. Additionally, overall market information such as historical occupation growth, unemployment information and a demographic comparison of the market to the National average are provided. The information is pure, unfiltered