Transcription
Minnesota Homicides1985 to 1997M AY 1 9 9 9
Minnesota Planning develops long-range plans for thestate, stimulates public participation in Minnesota’s futureand coordinates activities among state agencies, theMinnesota Legislature and other units of government.The Criminal Justice Center provides criminal andjuvenile justice information, conducts research andmaintains databases for policy development.Minnesota Homicides 1985 to 1997 was prepared byLaLonnie Erickson of the Criminal Justice Center atMinnesota Planning, with assistance from staff membersDebra Hagel, Ray Lewis and Susan Roth.This project was supported by the Justice Research andStatistics Association under a grant from the Bureau ofJustice Statistics’ National Criminal History ImprovementProgram. Points of view expressed in this document arethose of the authors and do not necessarily represent theofficial positions or policies of the Justice Research andStatistics Association or Bureau of Justice Statistics.Upon request, Minnesota Homicides 1985 to 1997 will bemade available in an alternate format such as Braille, largeprint or audio tape. For TTY, contact Minnesota Relay at800-627-3529 and ask for Minnesota Planning.May 1999For additional information or copies of this report, contact:M I N N E S O TA PL A N N I N G658 Cedar St.St. Paul, MN 55155651-296-3985Fax 651-296-3698www.mnplan.state.mn.usAn electronic copy of Minnesota Homicides 1985 to 1997, theproject data file and statewide maps are available on theMinnesota Planning Internet site at www.mnplan.state.mn.us.
Minnesota Homicides1985 to 1997Glossary . . . . . . . . . . . . . . . . . . . . . . . . . . . . . . . . . . . . . . . . . . . . . . . . . . . . . . . . . iiSummary . . . . . . . . . . . . . . . . . . . . . . . . . . . . . . . . . . . . . . . . . . . . . . . . . . . . . . . . 1Examining homicide in Minnesota . . . . . . . . . . . . . . . . . . . . . . . . . . . . . . . . . . . 1Trends statewide and across the nation . . . . . . . . . . . . . . . . . . . . . . . . . . . . . . . 2Rate of homicide in Minnesota low compared to other states . . . . . . . . . . . . . . . 2Activity in Hennepin County influenced the state’s homicide trend . . . . . . . . . . . 3Situational elements . . . . . . . . . . . . . . . . . . . . . . . . . . . . . . . . . . . . . . . . . . . . . . 5Murders with multiple victims and offenders were uncommon . . . . . . . . . . . . . . 5Firearms were the most prevalent type of homicide weapon every year . . . . . . . 6A majority of murders resulted from arguments . . . . . . . . . . . . . . . . . . . . . . . . . . 8Human factors: offenders and victims . . . . . . . . . . . . . . . . . . . . . . . . . . . . . . . 11Most homicide offenders were white males age 18 or older . . . . . . . . . . . . . . . 11Homicide offenders using guns differed from others . . . . . . . . . . . . . . . . . . . . . 12Murder circumstances varied across demographic categories . . . . . . . . . . . . . . 12Victims of homicide were white, male and over 18 . . . . . . . . . . . . . . . . . . . . . . 13Firearms were a major factor in most victim groups . . . . . . . . . . . . . . . . . . . . . . 13Victims and offenders were usually of the same demographic group . . . . . . . . 14More than half of homicide victims knew their offenders . . . . . . . . . . . . . . . . . 15About homicide data . . . . . . . . . . . . . . . . . . . . . . . . . . . . . . . . . . . . . . . . . . . . . 16
GlossaryNonnegligent manslaughter The willful but notpremeditated killing of another person.Below are generally accepted definitions for terms used inthis report.Northeastern states Connecticut, Maine,Massachusetts, New Hampshire, New Jersey, New York,Pennsylvania, Rhode Island and Vermont.AdultCircumstance Describes the event surrounding orleading up to the commission of a homicide.Other family member relationship Describes victimswho were related to the offender as extended familymembers such as aunts, uncles, nieces, nephews orgrandparents.Colder months October, November, December, January,February and March.Personal weapons Arms, feet, fists, hands, teeth andother body parts employed as weapons or means of force.FallSpringAn individual age 18 or older.September, October and November.Firearm A device that is designed to or may be readilyconverted to expel any type of projectile. Types of firearmsare handguns, rifles, shotguns, machine guns, homemadeguns, and air, BB or pellet guns.Homicide The killing of another person. This categoryincludes justifiable homicide, murder, negligentmanslaughter and nonnegligent manslaughter.Immediate family member relationship Describesvictims who were parents, children or siblings of theoffender.Intimate relationship Describes victims who werespouses or intimate partners of the offender.Justifiable homicide Willful killing classified asexcusable. The only justifiable homicide is the killing of acriminal by either a peace officer in the line of duty or aprivate citizen when the criminal is committing certain crimes.Juvenile An individual under age 18.Knife or cutting instrument Knife, broken bottle,razor, ice pick, screwdriver or other cutting and stabbinginstrument employed as a weapon or means of force.March, April and May.Southern states Alabama, Arkansas, Delaware, Florida,Georgia, Kentucky, Louisiana, Maryland, Mississippi,North Carolina, Oklahoma, South Carolina, Tennessee,Texas, Virginia and West Virginia; the District of Columbiais also included.SummerJune, July and August.Twin Cities metropolitan area Anoka, Carver, Dakota,Hennepin, Ramsey, Scott and Washington counties.Victim-offender relationship Describes each victim’srelationship to the offenders involved in a single incident ofhomicide.Warmer monthsSeptember.April, May, June, July, August andWeapon Describes both objects and methods used tocommit homicide including unknown firearm types,handguns, rifles, shotguns, other guns, knives or cuttinginstruments, personal weapons, blunt objects, being pushedor thrown out of a window, explosives, fire, drugs,drowning, strangulation or hanging, asphyxiation andunknown weapon types.Midwestern states Illinois, Indiana, Iowa, Kansas,Michigan, Minnesota, Missouri, Nebraska, North Dakota,Ohio, South Dakota and Wisconsin.Western states Alaska, Arizona, California, Colorado,Hawaii, Idaho, Montana, Nevada, New Mexico, Oregon,Utah, Washington and Wyoming; Puerto Rico also isincluded.Murder The willful, premeditated killing of another person.WinterNegligent manslaughter A death occurring as a resultof nonwillful, gross negligence by some person other thanthe victim. This category does not include traffic fatalities.December, January and February.
MINNESOTA HOMICIDES 1985 TO 1997SummaryMinnesota Homicides 1985 to 1997 presents findingsregarding the demographics of offenders and victimsinvolved in homicide, weapons used, the victim-offenderrelationship and the circumstance or event leading up to thecommission of the offense.Comprehensive statewide information on homicide inMinnesota has not been gathered before. State policymakers and the public receive pieces of information aboutmurder incidents through media reports. In addition, onlylimited annual aggregate counts for a few data categoriesare available. A 1998 report published by the CriminalJustice Center at Minnesota Planning, Armed with Data:Creating a Multistate Perspective, provided limitedinformation on guns used in crime across the four-stateregion of Minnesota, Montana, Nebraska and Montana.While the project looked at homicide, data for Minnesotaalone was not included.Homicide data submitted by Minnesota law enforcementagencies creates a more complete and reliable picture of thefactors involved in each incident. The Criminal JusticeCenter received a grant from the Justice Research andStatistics Association to examine Supplementary HomicideReport data for the years 1985 to 1997. Data about theoccurrence of murder in Minnesota obtained fromSupplementary Homicide Report forms filed during thatperiod revealed that:Guns were the most prevalent homicide weapon everyyear since 1985. The use of firearms in murder grew from36 percent of all weapons in 1985 to 63 percent by 1997.The percent of all firearms used in murder that werehandguns ranged between 60 and 80 percent during the 13year period.The proportion of homicide offenders who were 15 to 19years old nearly quadrupled between 1985 and 1997.Minnesota’s 1997 homicide rate was lower than mostother states at 2.6 per 100,000 people. Only 10 states had alower rate.The number of homicides climbed 117 percent between1985 and 1995, then fell 32 percent from 1995 to 1997. The1997 total, however, is still 48 percent above the 1985statewide total.Two law enforcement agencies in the state — theMinneapolis and St. Paul police departments — recordedmore than half of all homicides occurring from 1985 to1997. The overall statewide pattern of homicide wasinfluenced primarily by activity occurring in Minneapolis.Most murders over the period were the result ofarguments with family or nonfamily members, or over1money or property. Other homicides involved suchcircumstances as theft- or sex-related offenses or were dueto gang activity.The percentage of murder victims who were friends oracquaintances of the offender ranged from 33 to 52 percentbetween 1985 and 1997. Overall, 54 to 70 percent ofvictims knew their offender as either a friend, acquaintance,spouse or intimate partner, or family member.The characteristics of homicide offenders and victimsfrom 1985 to 1997 were similar, with a majority beingwhite males over the age of 18. Offenders who used gunswere more likely to be African American males 18 or older.Victims and offenders tended to be of the samedemographic group.Report analyses were limited to descriptions of the dataelements collected on Supplementary Homicide Reportforms. Conclusions about any conditions that may havecontributed to the peak of murders in 1995 and thesubsequent two-year decline could not be drawn inMinnesota Homicides 1985 to 1997. Future projects couldexamine the effect on homicide of such phenomena associal events occurring before or at the time of a homicide,statutory changes, the focusing of law enforcementresources, fluctuations in the number of officers, or theinflux of gangs or drug dealing into an area. In addition,steps could be taken to implement a better method ofcollecting data for learning more about each incident ofhomicide.Examining homicidein MinnesotaDetailed information about the occurrence of murder inMinnesota has been lacking. Basic annual statistics havesuggested an increasing rate of homicide since 1985followed by the start of a decline in 1995. The use offirearms in homicides was examined in 1997 by theMultistate Firearms Project, in which staff from StatisticalAnalysis Centers in Minnesota, Montana, Nebraska andSouth Dakota worked together using four data setsincluding Supplementary Homicide Reports. The project’sfinal report presented aggregate data for the four states butno distinct data for Minnesota.Supplementary Homicide Reporting forms are used tocollect information on each incidence of homicide for theUniform Crime Reporting program coordinated and directedby the Federal Bureau of Investigation. Data recorded foreach incident includes the number of victims and offenders
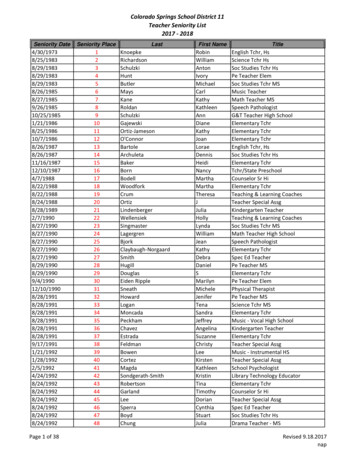
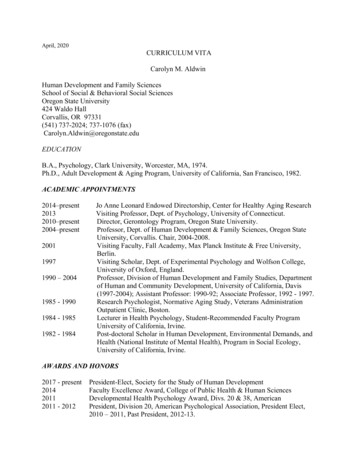
2MINNESOTA HOMICIDES 1985 TO 1997involved, county and season of occurrence, law enforcementagency jurisdiction, victim and offender demographics, theweapon used, the victim-offender relationship and the event,or circumstance, surrounding or leading up to the homicide.The Bureau of Criminal Apprehension at the Department ofPublic Safety is responsible for maintaining theSupplementary Homicide Report data submitted by lawenforcement agencies in Minnesota.To help compile Minnesota-specific homicide information,the Criminal Justice Center at Minnesota Planning receiveda grant from the Justice Research and Statistics Associationthrough the National Criminal History ImprovementProgram. Center staff obtained data from the Bureau ofCriminal Apprehension for the years 1985 to 1997. Thisreport on the analysis of the data, Minnesota Homicides1985 to 1997, offers results on state, county and local lawenforcement levels, identifies trends across the 13-yeartime frame and details offender and victim demographicsas well as weapon use, incident circumstances and thevictim-offender relationship.Deaths resulting from nonwillful, gross negligence by someperson other than the victim are considered negligentmanslaughters. Included in these are hunting accidents,gun-cleaning accidents or incidents involving childrenplaying with a gun. Five incidents were due to childrenplaying with guns. Subsequent analyses in this report do notinclude cases of justifiable homicide or negligentmanslaughter.One incident of homicide may involve multiple victims andmultiple offenders. Over the 13-year period there were atotal of 1,672 victims of murder and nonnegligentmanslaughter and 1,860 offenders. Seventeen percent ofoffenders were unknown, meaning that law enforcementofficials could not determine whether these incidentsinvolved more than one offender.Rate of homicide in Minnesota lowcompared to other statesBoth Minnesota and the United States saw the rate ofhomicide increase after 1985. Nationwide, homicidesMinnesota homicide rate per 100,000 people peakedfour years after nation’s12108RateA greater understanding of the factors surrounding andcontributing to homicide will facilitate informed decisionmaking and policy development. Data analyses confrontedsome limits, however. Supplementary Homicide Reportforms do not record alcohol or drug use by offenders andvictims, so insight into the role of these substances inhomicide situations could not be obtained. Forms also lackdata on offender and victim mental stability, socioeconomicstatus and education level. Minnesota Homicides 1985 to1997 also was not able to examine the relationship of suchinfluences as social events, law enforcement activities,legislation or shifts in population on the incidence ofmurder. Revisions to the reporting form, formulation ofadditional strategies for data collection and further researchprojects could improve information available for learningabout homicide and methods of deterrence.protecting themselves against physical attack or when thecriminal is committing certain crimes or fleeing the crimescene. Across the 13 years, two justifiable homicide casesinvolving private citizens as the offender were recorded.Trends statewide andacross the nation64201985 1986 1987 1988 1989 1990 1991 1992 1993 1994 1995 1996 1997A total of 1,588 incidents of homicide — murder,nonnegligent manslaughter, justifiable homicide andnegligent manslaughter — occurred in Minnesota from1985 to 1997. Justifiable homicides and negligentmanslaughters comprised 1 percent of all incidents.Justifiable homicide occurs when an on-duty police officer ora private citizen kills a criminal in certain situations such asUnited StatesMinnesotaFrom 1985 to 1995, Minnesota’s homicide rate doubled from 2 to 4homicides per 100,000 people. Two years later, the number of homicidesdropped 32 percent, from 182 in 1985 to 124 in 1997.Note: Rates were calculated using yearly July 1 population estimates fromthe U.S. Census Bureau.Sources: U.S. Census Bureau, Federal Bureau of Investigation andMinnesota Bureau of Criminal Apprehension
MINNESOTA HOMICIDES 1985 TO 19973peaked in 1991 at 9.8 per 100,000 people and then declinedto below 1985 levels, to 6.8, in 1997. Minnesota did notexperience a peak in the number of homicides until 1995,topping out at a rate of four homicides per 100,000 peopleand falling to 2.6 by 1997 — a figure slightly above the1985 rate.while those in the Northeast together accounted for 14percent. Southern states had the greatest share at 43percent. Within the Midwest, Illinois had the highestnumber — 1,096 — of homicides, while North Dakotaranked last with six. Minnesota reported the fifth lowestnumber of homicides among Midwestern states.Minnesota’s 1997 homicide rate was below that of mostother states. Thirty-nine states and the District of Columbiareported a higher rate of homicide than Minnesota in thatyear. New Hampshire and South Dakota recorded thelowest rate at 1.4 each, and the District of Columbia washighest at 56.9. The average state homicide rate amongthese states was 6.9 per 100,000 people.After a 117 percent growth between 1985 and 1995, thenumber of homicides in Minnesota took a downward turn.Between 1995 and 1997, the number fell by 32 percent,although it was still 48 percent above 1985 totals.Nationally, the two-year decrease was 16 percent, and 1997homicides were 4 percent below those reported in 1985.Proportionally, less than 1 percent of the 18,210 homicidescommitted in the United States occurred in Minnesota.California had 2,579 homicide deaths in 1997, giving it thelargest single-state share of the national total. Midwesternstates reported a little more than one-fifth of all homicides,Activity in Hennepin County influencedthe state’s homicide trendOnly 10 states had lower homicide rates than Minnesotain 1997Rates per 100,000 people, lowest to highestStateRateStateRateNew York . . . . . . . . . . . . . . 6.0New Hampshire . . . . . . . . . 1.4Kansas . . . . . . . . . . . . . . . . . 6.0South Dakota . . . . . . . . . . . 1.4Texas . . . . . . . . . . . . . . . . . . 6.8Vermont . . . . . . . . . . . . . . . 1.5Florida . . . . . . . . . . . . . . . . . 6.9Iowa . . . . . . . . . . . . . . . . . . 1.8Oklahoma . . . . . . . . . . . . . . 6.9Massachusetts . . . . . . . . . . 1.9Virginia . . . . . . . . . . . . . . . . 7.2Maine . . . . . . . . . . . . . . . . . 2.0Indiana . . . . . . . . . . . . . . . . 7.3North Dakota . . . . . . . . . . . 2.2Georgia . . . . . . . . . . . . . . . . 7.5Utah . . . . . . . . . . . . . . . . . . 2.4New Mexico . . . . . . . . . . . . 7.7Rhode Island . . . . . . . . . . . . 2.5Michigan . . . . . . . . . . . . . . . 7.8Delaware . . . . . . . . . . . . . . . 2.5Missouri . . . . . . . . . . . . . . . 7.9Minnesota . . . . . . . . . . . 2.6California . . . . . . . . . . . . . . 8.0Oregon . . . . . . . . . . . . . . . . 2.9Arizona . . . . . . . . . . . . . . . . 8.2Nebraska . . . . . . . . . . . . . . . 3.0North Carolina . . . . . . . . . . 8.3Idaho . . . . . . . . . . . . . . . . . . 3.2South Carolina . . . . . . . . . . 8.4Wyoming . . . . . . . . . . . . . . . 3.5Alaska . . . . . . . . . . . . . . . . . 8.9Connecticut . . . . . . . . . . . . . 3.8Illinois . . . . . . . . . . . . . . . . . 9.2Wisconsin . . . . . . . . . . . . . . 4.0Tennessee . . . . . . . . . . . . . . 9.5Colorado . . . . . . . . . . . . . . . 4.0Maryland . . . . . . . . . . . . . . . 9.9Hawaii . . . . . . . . . . . . . . . . . 4.0Alabama . . . . . . . . . . . . . . . 9.9West Virginia . . . . . . . . . . . 4.1Arkansas . . . . . . . . . . . . . . . 9.9New Jersey . . . . . . . . . . . . . 4.2Nevada . . . . . . . . . . . . . . . 11.2Washington . . . . . . . . . . . . . 4.3Mississippi . . . . . . . . . . . . 13.1Ohio . . . . . . . . . . . . . . . . . . 4.7Louisiana . . . . . . . . . . . . . . 15.7Montana . . . . . . . . . . . . . . . 4.8District of Columbia . . . . . 56.9Kentucky . . . . . . . . . . . . . . . 5.8Pennsylvania . . . . . . . . . . . . 5.9Source: Federal Bureau of Investigation, Crime in the United States, 1997Patterns of homicide within the state were primarilyinfluenced by activity occurring in one county: Hennepin.The trend line of homicides committed within Minnesotaover the 13-year period mirrored that of Hennepin County,peaking in 1995 and sharply declining thereafter. WhileRamsey County reported the second largest share ofhomicides in the state, it did not experience the samedramatic increase in 1995. Homicides in Ramsey Countyreached a high point in 1992 before beginning to fall.Hennepin and Ramsey counties together accounted formore than half of all homicides in the state every year from1985 to 1997. Hennepin County alone had from 39 up to 59Homicides in Minneapolis shaped the state pattern from1985 to 1997MinnesotaHennepin CountyMinneapolis200Ramsey County1801601401201008060402001985 1986 1987 1988 1989 1990 1991 1992 1993 1994 1995 1996 1997Ramsey County, which accounted for the second largest proportion ofall homicides statewide, did not experience the same sharp increase inthe number of homicides in 1995 as did Hennepin County. Its peakoccurred in 1992.Source: Minnesota Bureau of Criminal Apprehension
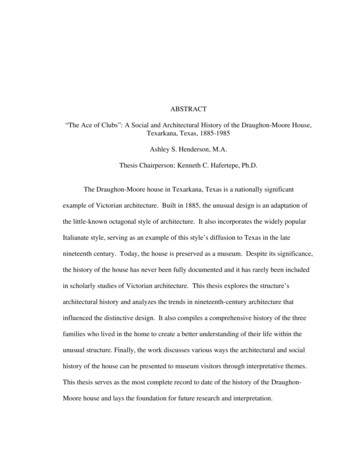
4MINNESOTA HOMICIDES 1985 TO 1997Forty-three counties had one to five homicides between 1985 and 1997KittsonRoseauLake ofthe WoodsMarshallKoochichingBeltramiPenningtonCookRed LakeWadenaWilkinOtter htHennepinMcLeod rne IsantiChippewaYellow MedicineStearnsNone1 to 5WashingtonPopeSwiftLac QuiParleNumber of homicide lleLacsToddGrantSt. manLakeClearwaterPolk6 to 15More than nwa Blue EarthtonaWMartinFaribaultWasecaBrownSteele Dodge OlmstedFreebornMowerWinonaFillmoreHoustonFifty-one percent of all homicides occurring in the state from 1985 to 1997 were in Hennepin County.Note: Data pictured represents victim totals for the combined years of 1985 to 1997.Source: Minnesota Bureau of Criminal Apprehension
MINNESOTA HOMICIDES 1985 TO 1997percent of homicides statewide, while Ramsey County hadbetween 11 and 23 percent. St. Louis, Anoka and Dakotacounties had the next largest shares of homicides, with 3, 3and 2 percent, respectively, for all years of data combined.Twelve counties had no reports of homicide during the 13year period, 15 documented only one case, and four —Anoka, Hennepin, Ramsey and St. Louis — reportedhomicides in each year. The Twin Cities area counties ofAnoka, Carver, Dakota, Hennepin, Ramsey, Scott andWashington had from 64 to 85 percent of all homicidecases from 1985 to 1997.A deeper look into homicide activity shows that two lawenforcement agencies recorded more than half of allhomicides committed between 1985 and 1997. TheMinneapolis Police Department reported from 35 to 53percent of Minnesota homicides, followed by the St. PaulPolice Department with 11 to 23 percent. From 1985 to1997, both departments accounted for 75 percent or moreof all homicide activity occurring in their respectivecounties. Only eight other police departments — Blaine,Bloomington, Brooklyn Center, Brooklyn Park, Crystal,Duluth, Rochester and St. Cloud — each reported 10 ormore total homicides in the 13-year period; their combinedtotal was 124 cases. Both the surge in homicides and recentdecline statewide since 1995 can likely be attributed toactivity reported by the Minneapolis Police Department.Situational elementsExcluding justifiable homicide and negligent manslaughter,which are not willful or premeditated, a total of 1,572incidents of murder occurred in Minnesota from 1985 to1997. As has been noted, more than one victim or offendermay be involved in a single incident of homicide.Situational factors provide additional insight into thephenomena surrounding a homicide incident, including thenumber of offenders and victims involved, the month andseason of occurrence, weapon use and the circumstances orevents leading up to the murder.Murders with multiple victims and offenderswere uncommonMost cases of homicide involved one victim and oneoffender. Homicide situations with multiple offenders were,however, more likely than those with multiple victims.Ninety-one to 98 percent of incidents occurring between51985 and 1997 had one victim, and 60 to 76 percentinvolved single offenders. In 13 to 28 percent of homicideincidents, offender information was unknown: lawenforcement officers were unable to identify any suspects.The largest number of victims recorded in any one incidentof homicide was five in both 1988 and 1994. The mostoffenders documented in any one incident were 10 in 1997.Compared to other counties, the seven Twin Citiesmetropolitan area counties more commonly had cases withmore than one victim every year except three — 1985,1994 and 1996. Most incidents with more than oneoffender occurred primarily in Hennepin and Ramseycounties; slightly less than half of all such cases, however,occurred in these counties in 1996. Each year, more than 70percent of cases with unknown offenders were recorded inHennepin and Ramsey counties as well. Overall, HennepinCounty accounted for one-third to about one-half of allmultiple-victim and multiple-offender homicides from1985 to 1997, while Ramsey County had between 15 and25 percent.Monthly and seasonal occurrences of homicide varied from1985 to 1997. No one month surfaced over the 13 yearsunder study as being a common factor in homicide incidents.In most cases, the largest percentage of homicides in eachyear tended to occur in one of the months from July toDecember. For all years of data combined, a majority ofincidents — 10 percent — happened in July. In 1995, whenhomicides in Minnesota reached a peak, August had the mostincidents, followed by March and May.Summer and fall — the months of June through November— were the most typical seasons for homicide incidents.One of these seasons recorded the largest percentage ofcases in nine of the 13 years since 1985. Overall, 28percent of homicides occurred in the summer months ofJune, July and August. Slightly more than half of allhomicides were committed in the warmer months of April,May, June, July, August and September. In contrast, both1985 and 1992 recorded 60 percent of homicides occurringin the colder months of October, November, December,January, February and March. Almost three-fourths of thecases in 1996 were recorded in warmer months.Hennepin and Ramsey counties registered some seasonaldifferences in the occurrence of murder. August had thelargest percentage of homicide incidents in HennepinCounty from 1985 to 1997, while October was theprevailing month in Ramsey County, with each monthtotaling 11 percent. In addition, Hennepin County had ahigher number of murders in warmer months compared toRamsey County, where 51 percent of homicides occurred incolder months.
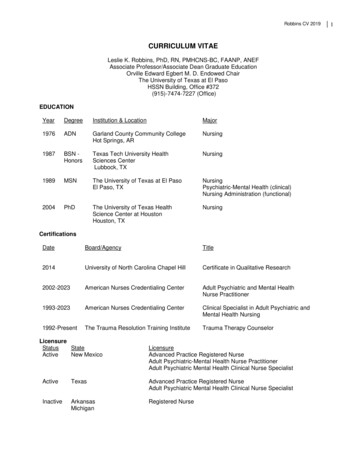
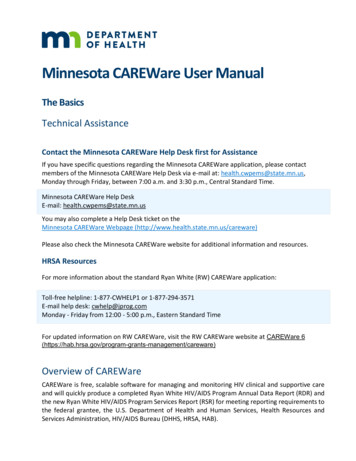
6MINNESOTA HOMICIDES 1985 TO 1997Situation types also varied with respect to season. Mostmurder incidents with single offenders and single victimsoccurred in summer months, primarily July. The greatestnumber of homicides with unidentifiable offenders was inJuly as well. Situations with more than one offender tendedto happen in October and those with multiple victims inNovember. An equal amount of multiple-victim situationsoccurred in the summer and fall, while most multipleoffender incidents were in the fall.Firearms were the most prevalent typeof homicide weapon every yearA number of different types of weapons — which forpurposes of this report include various methods as well —were employed by offenders to commit homicide inMinnesota. Weapons included such things as firearms;knives; blunt objects; explosives; fists, feet and other bodyparts; fire; drugs; drowning; pushing the victim out of awindow; strangulation; and asphyxiation. Four percent ofweapons could not be identified in homicides between1985 and 1997.Since 1985, the use of firearms — most notably, handguns— in murder has been steadily increasing. In 1985, knivesFirearms were the most common murder weapon from1985 to 19971009080Percent70All firearmsHandgunsKnivesPersonal weaponsOther weaponsand handguns were the most common weapons used inhomicide, with each accounting for 29 percent of the totalmurders; between 1986 and 1988, knives surpassedhandguns as the weapon of choice. Beginning in 1989,however, handguns rose above knives to comprise 27percent of all murder weapons and increased to 53 percentby 1997, becoming the number one weapon each year inthat period. The proportions of knives and other weaponssuch as blunt objects, fists, explosives, fire and drugs usedin homicide decreased over the 13-year period. Allfirearms combined, including handguns, rifles, shotguns,other guns and unknown firearm types, have comprisedthe largest percentage of homicide weapons every year,totaling 36 percent in 1985 and growing to 63 percentin 1997.Homicide activity in Minnesota from 1985 to 1997 closelyreflected the pattern of handgun use. The increase inhomicides since 1985, the peak in 1995 and the declinethereafter mirror the trends seen in handgun use in murder.Over the study period, 60 to 87 percent of all guns involvedin murder were handguns. In 1995, almost nine out of 10firearm-related murders were committed with a handgun –a higher proportion than in any other year. Overall,shotguns followed handguns as the second most commonfirearm used in homicide.Use of handguns in murder nearly tripledPercent change from 1985 to 1997All firearms175%Blunt objects 13%6050Handguns191%4030Knives - 27%2010Other weapons25%01985 1986 1987 1988 1989 1990 1991 1992 1993 1994 1995 1996 1997Personal weaponsWhile the use of knives, personal weapons and other weapons in homicidehas declined or remained stable since 1985, the use of firearms, primarilyhandguns, has risen steadily. Guns comprised more than half of all murderweapons in 1997.Note: “All firearms” include handguns, rifles, shotguns, other guns andunknown firearm types. “Personal weapons” include arms, feet, fists, hands,teeth and other body parts employed as weapons or means of force. “Otherweapons” include blunt objects, explosives, fire, narcotics or drugs,drowning, pushing or throwing out of a window, strangulation or hanging,and asphyxiation. This graph does not show data for unknown weapons.Source: Minnesota Bureau of Criminal Apprehension20%The use of weapons other than firearms in homicides grew by no mor
658 Cedar St. St. Paul, MN 55155 651-296-3985 Fax 651-296-3698 www.mnplan.state.mn.us An electronic copy of Minnesota Homicides 1985 to 1997, the . Minneapolis and St. Paul police departments — recorded more than half of all homicides occurring from 1985 to 1997. The overall statewide pattern of homicide was