Transcription
VIEW OF THE MARKET NEWSLETTERVolume V Issue 11A Publication of Paramount Capital Corporation11.15.13Strategy and Insight for the Commercial Real Estate IndustryAN ANALYSIS OF THE FIRST SINGLE FAMILY STRUCTURED BOND OFFERING,MOODY’S/REAL CRE INDEX, AMERICA’S FINANCES GRAPH, COMMENTARY BY MARCFABER AND REIT FOCUS ON HOME PROPERTIES, INC., AN APARTMENT REITIn this month’s issue; Real Estate Focus will review the details of Blackstone’s singlefamily structured bond offering and an updated graph of Moody’s/Real Capital AnalyticsCRE value index, Economic Focus will show a scary graph on the debt of the U.S. andcommentary from investment and economic guru, Marc Faber on the real economyversus the financial economy and REIT Focus analyzes Home Properties, Inc., anapartment REIT.REAL ESTATE FOCUSBlackstone Invitation Homes Single Family Securitized Note SaleOne sector of real estate investment that has been in the news lately has been the bulkownership of single family homes (SFH’s) and the conversion of some of thesecompanies into public REITs. There are currently a few public REITs that own andmanage SFH’s including Silver Bay Realty Trust Corp., American Homes 4 Rent andAmerican Residential Properties, Inc. and a number seeking to go public likeBlackstone’s Invitation Homes (BIH’s), Colony American Homes, Starwood PropertyTrust, Waypoint Residential and many more. We reviewed the business model ofportfolio ownership of SFH’s in the April 2012 issue of VOM and concluded that this is apoor business model with low total returns, high operating costs, high vacancy, volatileasset values and diseconomies of scale. Even though we believe its a difficult businessand should be avoided, we were intrigued that BIH’s is in the process of selling the firstsingle family rental pass through certificate bond offering for 479 million.PageFor a Subscription to this letter see right Paramount Capital Corporation 20131We received a Moody’s October 2013 pre-sale report on BIH’s offering and thought wewould show you some of the major provisions of the deal. This offering is expected toclose on November 22, 2013. Below are the class tranches of the offering.
VIEW OF THE MARKET NEWSLETTERVolume V Issue 11A Publication of Paramount Capital Corporation11.15.13Strategy and Insight for the Commercial Real Estate IndustryClassAmountRatingA 00Baa2E46,010,000N/RF41,527,000N/RTotal 479,137,000A summary of the deal structure is as follows:Amount: 479,137,000Collateral:3,207, 100% leased SFH’s and pledge of equity inthe borrowerTerm:2 years, with 3 one year extensionsState Concentrations:CA-41%, AZ-33%, FL-15%, GA-9% and IL-8%Moody’s LTV Ratio:91.5%Moody’s DSC:1.3XMoody’s Debt Yield:5.1%Interest Rate:Floating over Libor with and Interest Rate CapAgreementSponsor:Invitation Homes, L.P., an affiliate of BlackstoneProperty Manager:THR Property Management, L. P., an affiliate ofBlackstoneMaster Servicer:Midland Loan ServicesSpecial Servicer:Situs Holdings, LLCPageFor a Subscription to this letter see right Paramount Capital Corporation 20132Average Loan Amount Per Home: 149,403
VIEW OF THE MARKET NEWSLETTERVolume V Issue 11A Publication of Paramount Capital Corporation11.15.13Strategy and Insight for the Commercial Real Estate IndustryCash flow projections for the pool as prepared by Moody’s are shown below along withprojections that were prepared by VOM:(ooo’s)VOMMoody’s 50,930 50,9305,0935,093 45,837 45,837 4,125 4,125Property Taxes5,8755,875HOA Expense969969Insurance1,2451,245Repairs and Maintenance3,8485,093Turnover Costs1,5171,517Leasing and Marketing1,1221,122 0 4,583Total Expenses 18,701 24,529Net Operating Income 27,136 21,308Total RevenueVacancyEffective Gross incomeOperating Expenses:Property Management Fee (9%)General and Administrative (05, 10%)As shown above, the VOM projections show higher expenses for R&M and G&A costsand therefore a lot lower NOI of 21,308,000 or 46% of EGI. Apartments typically haveexpense ratios from 40% to 45% of gross income, however, SFH’s have higher expensesof 50%-60% of gross income due to the difficulty in operating and managing numeroussingle assets in disparate locations. This is a very risky and poorly structured debtoffering with a low yield, volatile asset value, severe interest rate risk, thin debt servicecoverage and short term financing on a pool of long term assets. As we have stated manytimes on VOM, financing short and investing long has been the root cause of many realPageFor a Subscription to this letter see right Paramount Capital Corporation 20133estate and financial disasters.
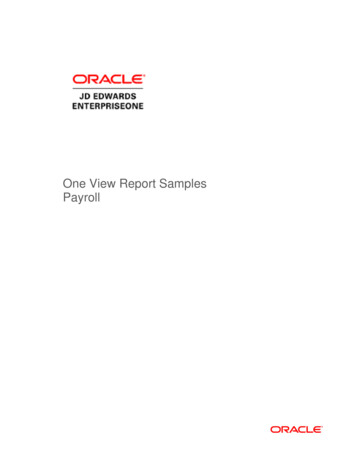
VIEW OF THE MARKET NEWSLETTERVolume V Issue 11A Publication of Paramount Capital Corporation11.15.13Strategy and Insight for the Commercial Real Estate IndustryMoody’s/Real Capital AnalyticsPageFor a Subscription to this letter see right Paramount Capital Corporation 20134More good news for the CRE industry as the current graph of the Moody’s/Real CapitalAnalytics commercial real estate price index shown below is up 40% from the low valuereached in October 2010.
VIEW OF THE MARKET NEWSLETTERVolume V Issue 11A Publication of Paramount Capital Corporation11.15.13Strategy and Insight for the Commercial Real Estate IndustryECONOMIC FOCUSThe U.S. Debt Time BombWe have commentated many times here on VOM at the excessive spending, debt andmoney printing by the Fed and how that will eventually lead to another financial crash.PageFor a Subscription to this letter see right Paramount Capital Corporation 20135The graph below, courtesy of zerohedge.com is an excellent picture of the current debtsituation.
VIEW OF THE MARKET NEWSLETTERVolume V Issue 11A Publication of Paramount Capital Corporation11.15.13PageFor a Subscription to this letter see right Paramount Capital Corporation 20136Strategy and Insight for the Commercial Real Estate Industry
VIEW OF THE MARKET NEWSLETTERVolume V Issue 11A Publication of Paramount Capital Corporation11.15.13Strategy and Insight for the Commercial Real Estate IndustryMarc Faber CommentaryOne of our favorite market prognosticators and investors is Dr. Marc Faber. Dr. Faberwas born in Zurich, Switzerland, went to school in Geneva and Zurich where he studiedEconomics at the University of Zurich and at the age of 24, obtained a PhD in Economicsmagna cum laude. Dr. Faber is publisher of the popular Gloom, Boom and Doom reporton economics, investments and investment strategy. Below is very compellingcommentary from Dr. Faber on the U.S. real versus financial economy and Fed moneyboondoggle.“I would like readers to consider carefully the fundamental difference between a “realeconomy” and a “financial economy.” In a real economy, the debt and equity markets asa percentage of GDP are small and are principally designed to channel savings intoinvestments.In a financial economy or “monetary-driven economy,” the capital market is far largerthan GDP and channels savings not only into investments, but also continuously intocolossal speculative bubbles. This isn’t to say that bubbles don’t occur in the realeconomy, but they are infrequent and are usually small compared with the size of theeconomy. So when these bubbles burst, they tend to inflict only limited damage on theeconomy.In a financial economy, however, investment manias and stock market bubbles are solarge that when they burst, considerable economic damage follows. I should like to stressthat every investment bubble brings with it some major economic benefits, because abubble leads either to a quantum jump in the rate of progress or to rising productioncapacities, which, once the bubble bursts, drive down prices and allow more consumersto benefit from the increased supplies.In the 19th century, for example, the canal and railroad booms led to far lowerPageFor a Subscription to this letter see right Paramount Capital Corporation 20137transportation costs, from which the economy greatly benefited. The 1920s’ and 1990s’innovation-driven booms led to significant capacity expansions and productivity
VIEW OF THE MARKET NEWSLETTERVolume V Issue 11A Publication of Paramount Capital Corporation11.15.13Strategy and Insight for the Commercial Real Estate Industryimprovements, which in the latter boom drove down the prices of new products such asPCs, cellular phones, servers and so on, and made them affordable to millions ofadditional consumers.With or without Paul Volcker’s tight monetary policies, disinflation in the 1980s wouldhave followed the highly inflationary 1970s.The energy boom of the late 1970s led to the application of new oil extracting anddrilling technologies and to more efficient methods of energy usage, as well as to energyconservation, which, after 1980, drove down the price of oil in real terms to around thelevel of the early 1970s. Even the silly real estate bubbles we experienced in Asia in the1990s had their benefits. Huge overbuilding led to a collapse in real estate prices, which,after 1998, led to very affordable residential and commercial property prices.So my view is that capital spending booms, which inevitably lead to minor or majorinvestment manias, are a necessary and integral part of the capitalistic system. They driveprogress and development, lower production costs and increase productivity, even if thereis inevitably some pain in the bust that follows every boom.The point is, however, that in the real economy (a small capital market), bubbles tend tobe contained by the availability of savings and credit, whereas in the financial economy(a disproportionately large capital market compared with the economy), the unlimitedavailability of credit leads to speculative bubbles, which get totally out of hand.In other words, whereas every bubble will create some “white elephant” investments(investments that don’t make any economic sense under any circumstances), in financialeconomies’ bubbles, the quantity and aggregate size of “white elephant” investments is ofsuch a colossal magnitude that the economic benefits that arise from every investmentboom, which I alluded to above, can be more than offset by the money and wealthdestruction that arises during the bust. This is so because in a financial economy, far tooPageFor a Subscription to this letter see right Paramount Capital Corporation 20138much speculative and leveraged capital becomes immobilized in totally unproductive“white elephant” investments.
VIEW OF THE MARKET NEWSLETTERVolume V Issue 11A Publication of Paramount Capital Corporation11.15.13Strategy and Insight for the Commercial Real Estate IndustryIn this respect, I should like to point out that as late as the early 1980s, the U.S.resembled far more a “real economy” than at present, which I would definitelycharacterize as a “financial economy.” In 1981, stock market capitalization as apercentage of GDP was less than 40% and total credit market debt as a percentage ofGDP was 130%. By contrast, at present, the stock market capitalization and total creditmarket debt have risen to more than 100% and 300% of GDP, respectively.As I explained above, the rate of inflation accelerated in the 1970s, partly because of easymonetary policies, which led to negative real interest rates; partly because of genuineshortages in a number of commodity markets; and partly because OPEC successfullymanaged to squeeze up oil prices. But by the late 1970s, the rise in commodity prices ledto additional supplies, and several commodities began to decline in price even beforePaul Volcker tightened monetary conditions. Similarly, soaring energy prices in the late1970s led to an investment boom in the oil- and gas-producing industry, which increasedoil production, while at the same time the world learned how to use energy moreefficiently. As a result, oil shortages gave way to an oil glut, which sent oil pricestumbling after 1985.At the same time, the U.S. consumption boom that had been engineered by RonaldReagan in the early 1980s (driven by exploding budget deficits) began to attract agrowing volume of cheap Asian imports, first from Japan, Taiwan and South Korea andthen, in the late 1980s, also from China.I would therefore argue that even if Paul Volcker hadn’t pursued an active monetarypolicy that was designed to curb inflation by pushing up interest rates dramatically in1980/81, the rate of inflation around the world would have slowed down veryconsiderably in the course of the 1980s, as commodity markets became glutted andPageFor a Subscription to this letter see right Paramount Capital Corporation 20139highly competitive imports from Asia and Mexico began to put pressure on consumerproduct prices in the U.S. So with or without Paul Volcker’s tight monetary policies,disinflation in the 1980s would have followed the highly inflationary 1970s.
VIEW OF THE MARKET NEWSLETTERVolume V Issue 11A Publication of Paramount Capital Corporation11.15.13Strategy and Insight for the Commercial Real Estate IndustryIn fact, one could argue that without any tight monetary policies (just keeping moneysupply growth at a steady rate) in the early 1980s, disinflation would have been evenmore pronounced. Why? The energy investment boom and conservation efforts wouldprobably have lasted somewhat longer and may have led to even more overcapacities andto further reduction in demand. This eventually would have driven energy prices evenlower. I may also remind our readers that the Kondratieff long price wave, which hadturned up in the 1940s, was due to turn down sometime in the late 1970s.It is certainly not my intention here to criticize Paul Volcker or to question hisachievements at the Fed, since I think that, in addition to being a man of impeccablepersonal and intellectual integrity (a rare commodity at today’s Fed), he was the best andmost courageous Fed chairman ever.However, the fact remains that the investment community to this day perceives Volcker’stight monetary policies at the time as having been responsible for choking off inflation in1981, when, in fact, the rate of inflation would have declined anyway in the 1980s for thereasons I just outlined. In other words, after the 1980 monetary experiment, many people,and especially Mr. Greenspan, began to believe that an active monetary policy could steereconomic activity on a noninflationary steady growth course and eliminate inflationarypressures through tight monetary policies and through cyclical and structural economicdownturns through easing moves! the economy — the patient — gets sick because the virus — the downwardadjustments that are necessary in the free market — develops immunity to themedicine This belief in the omnipotence of central banks was further enhanced by the easingmoves in 1990/91, which were implemented to save the banking system and the savings& loan associations; by similar policy moves in 1994 in order to bail out Mexico and inPageFor a Subscription to this letter see right Paramount Capital Corporation 2013101998 to avoid more severe repercussions from the LTCM crisis; by an easing move in1999, ahead of Y2K, which proved to be totally unnecessary but which led to another
VIEW OF THE MARKET NEWSLETTERVolume V Issue 11A Publication of Paramount Capital Corporation11.15.13Strategy and Insight for the Commercial Real Estate Industry30% rise in the Nasdaq, to its March 2000 peak; and by the most recent aggressivelowering of interest rates, which fueled the housing boom.Now I would like readers to consider, for a minute, what actually caused the 1990 S&Lmess, the 1994 tequila crisis, the Asian crisis, the LTCM problems in 1998 and thecurrent economic stagnation. In each of these cases, the problems arose from loosemonetary policies and excessive use of credit. In other words, the economy — the patient— gets sick because the virus — the downward adjustments that are necessary in the freemarket — develops an immunity to the medicine, which then prompts the good doctor,who read somewhere in The Wall Street Journal that easy monetary policies and budgetdeficits stimulate economic activity, to increase the dosage of medication.The even larger and more potent doses of medicine relieve the temporary symptoms ofthe patient’s illness, but not its fundamental causes, which, in time, inevitably lead to arelapse and a new crisis, which grows in severity since the causes of the sickness wereneither identified nor treated.So it would seem to me that Karl Marx might prove to have been right in his contentionthat crises become more and more destructive as the capitalistic system matures (and asthe “financial economy” referred to earlier grows like a cancer) and that the ultimatebreakdown will occur in a final crisis that will be so disastrous as to set fire to theframework of our capitalistic society.Not so, Bernanke and co. argue, since central banks can print an unlimited amount ofmoney and take extraordinary measures, which, by intervening directly in the markets,support asset prices such as bonds, equities and homes, and therefore avoid economicdownturns, especially deflationary ones. There is some truth in this. If a central bankprints a sufficient quantity of money and is prepared to extend an unlimited amount ofPageFor a Subscription to this letter see right Paramount Capital Corporation 201311credit, then deflation in the domestic price level can easily be avoided, but at aconsiderable cost.
VIEW OF THE MARKET NEWSLETTERVolume V Issue 11A Publication of Paramount Capital Corporation11.15.13Strategy and Insight for the Commercial Real Estate IndustryFirst, it is clear that such policies do lead to depreciation of the currency, either againstcurrencies of other countries that resist following the same policies of massivemonetization and state bailouts (policies which are based on, for me at least,incomprehensible sophism among the economic academia) or against gold, commoditiesand hard assets in general. The rise in domestic prices then leads at some point to a“scarcity of the circulating medium,” which necessitates the creation of even more creditand paper money.”Regards,PageFor a Subscription to this letter see right Paramount Capital Corporation 201312Marc Faberfor The Daily Reckoning
VIEW OF THE MARKET NEWSLETTERVolume V Issue 11A Publication of Paramount Capital Corporation11.15.13Strategy and Insight for the Commercial Real Estate IndustryREIT FOCUSSummaryThis month’s REIT Focus is on Home Properties, Inc. (“HME”), a publicly traded REITengaged in the ownership, management, acquisition, rehabilitation and development ofapartment communities. As of November 2013, HME owned and operated 117 apartmentproperties comprising 41,623 units. The average occupancy, monthly base rent and rentgrowth as of 9/30/13 was 95.5%, 1,291 and 3.8%, respectively. HME’s properties arelocated in suburban Washington D.C., Baltimore, suburban New York City, Philadelphia,Boston, Chicago and Ft. Lauderdale, FL. HME owns a 84.7% limited partnership interestand a 1% general partner interest in its UpReit general partnership, Home Properties, L.P.In July 2013, HME issued 4,427,500 shares of common stock at a price of 63 per shareand the net proceeds of 268 million were used to repay outstanding indebtedness.HME was incorporated in Maryland in 1993, is traded on the NYSE, is based inRochester, NY and its debt is rated Baa by Moody’s. HME has 56.9 million commonshares outstanding and a market capitalization of approximately 3.15 billion.ManagementHME has a very experienced and well regarded management team that includes EdwardJ. Pettinella, President and Chief Executive Officer of the Company since 2004. He isalso a Director and He joined the Company in 2001 as an Executive Vice President andPageFor a Subscription to this letter see right Paramount Capital Corporation 201313Director, David P. Gardner, Executive Vice President since 2004 and a Vice Presidentand Chief Financial Officer of the Company since its initial public offering in 1994 andJohn E. Smith, Chief Investment Officer of the Company since 2006 and as Senior VicePresident since 2001. From 1998 until 2001, he was a Vice President of the Company.
VIEW OF THE MARKET NEWSLETTERVolume V Issue 11A Publication of Paramount Capital Corporation11.15.13Strategy and Insight for the Commercial Real Estate IndustryFinancial DataSelect financial data for HME as of the 9/30/13 10Q and for the period 1/1-9/30/13 is asfollows (in millions where applicable):Real Estate Assets, GrossTotal AssetsUnsecured Notes, Credit Line and Mortgages PayableCommon Stockholders’ EquityRevenueNet IncomeNet Income Per ShareCash Flow from OperationsUnsecured Line of Credit ( 450 with 106 used)Market CapitalizationProperty Debt to:Gross Real Estate AssetsMarket CapitalizationEnterprise ValueDividend and Yield ( 2.80/sh.) 5,544 4,421 2,435 1,741 500 104 1.92 219 344 3,15044%77%44%5.1%Valuation Methodology:First Nine Months Revenue Per Above AnnualizedLess: Operating Expenses Annualized (excluding depreciation, 667270amortization & interest expense, plus G&A expenses and other income)Annualized Net Operating Income 2013Projected Inflation Rate at 3.5%Projected Forward NOI for Next YearProjected Cap RateProjected Value of Real Estate AssetsAdd: Net Operating Working CapitalTotal Projected Asset ValueLess: Total Debt Per AboveProjected Net Asset ValueShares Outstanding 64.4M (56.9M common stock shares and 7.5M 397x103.5% 4117% 5,8714 5,875(2,435) 3,440common unit/equivalent shares)For a Subscription to this letter see right Paramount Capital Corporation 201314 53PageProjected NAV Per Share
VIEW OF THE MARKET NEWSLETTERVolume V Issue 11A Publication of Paramount Capital Corporation11.15.13Strategy and Insight for the Commercial Real Estate Industry 55Closing Market Price Per Share on 11/15/13The gross real estate assets, property debt, net income, funds from operations anddividends per share for the years 2009 through Q3 2013 are shown in the table below:(millions except per2009201020112012Q3 2013share amounts)Gross Real Estate 3,916 4,377 5,042 5,455 5,544 2,301 2,618 2,663 2,777 2,369 34 20 38 135 104Funds From Operations 146 151 190 252 209Dividends Per Share 2.68 2.32 2.48 2.64 .70 (1)AssetsProperty DebtNet Income(1) Per quarterAs shown above, our net asset value per share for HME is 53 versus a market price of 55 per share. Current average cap rates for apartment properties per CBRE are in the 6%to 9% range, depending on the location and quality of the property. We have used anaverage cap rate of 7% due to HME’s portfolio being primarily Class A and B suburbanproperties in development constrained markets.HME’s strengths include; attractive dividend yield of 5.1%, experienced managementteam, low leverage of 44% of enterprise value, high occupancy of 95.5% and aggressiveasset growth of 41% since 2009. Weaknesses include; a soft rental market in thesuburban Washington D.C. market where 30% of the portfolio is located and too high ofa portfolio concentration in suburban Washington D.C. and Baltimore MD, where 30%and 24%, respectively, of the total units are owned.PageFor a Subscription to this letter see right Paramount Capital Corporation 201315We are recommending the purchase of the stock at the current price of 54 and theattractive dividend yield of 5.1% and think this is one of the best apartment REITs in the
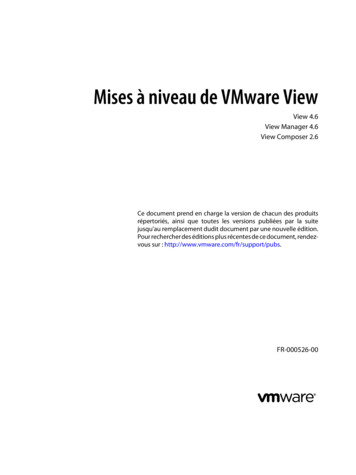
VIEW OF THE MARKET NEWSLETTERVolume V Issue 11A Publication of Paramount Capital Corporation11.15.13Strategy and Insight for the Commercial Real Estate Industrymarket. The stock is also down about 18% from its high of 67/sh. in the summer of2013. However, we would encourage management to limit ownership of units in onemarket or MSA to 20% of the total units and in conjunction therewith, reduce unit countin Washington D. C. and Baltimore, MD to 20% or less and reinvest the proceeds in otherapartment growth markets. This will diversify the portfolio, reduce negative assetconcentration and portfolio risk.A five year price chart of HME is shown below:For a Subscription to this letter see right Paramount Capital Corporation 2013Page1. BRE Properties, Inc., June 15, 20112. Boston Properties, Inc., July 15, 20113. Simon Properties Group, Inc., August 15, 20114. First Industrial Realty Trust, September 15, 20115. Public Storage, October 15, 201116REIT Focus reviews in prior issues of VOM are as follows:
VIEW OF THE MARKET NEWSLETTERVolume V Issue 11A Publication of Paramount Capital Corporation11.15.13Strategy and Insight for the Commercial Real Estate Industry6. Ashford Hospitality Trust, Inc., November 15, 20117. AvalonBay Communities, Inc., December 15, 20118. Alexandria Real Estate Equities, Inc., January 15, 20129. Federal Realty Investment Trust, Inc., February 15, 201210. Digital Realty Trust, Inc., March 15, 201211. Lasalle Hotel Properties, April 15, 201212. Apartment Investment and Management Company, May 15, 201213. Equity Residential Apartment Company, June 15, 201214. The Macerich Company, July 15, 201215. SL Green Realty Corp., August 15, 201216. Kimco Realty Corp., September 15, 201217. Cole Credit Property Trust II, Inc., October 15, 201218. Realty Income Corporation, November 15, 201219. Piedmont Office Realty Trust, Inc., December 15, 201220. Camden Property Trust, January 15, 201321. Hudson Pacific Properties, Inc., February 15, 201322. CBL & Associates Properties, Inc., March 15, 201323. Essex Property Trust, Inc., April 15, 201324. Commonwealth REIT, May 15, 201325. Douglas Emmett, Inc., June 15, 201326. UDR, Inc., July 15, 2013PageFor a Subscription to this letter see right Paramount Capital Corporation 20131727. Inland Real Estate Corporation, August 15, 201328. Highwoods Properties, Inc., September 15, 201329. Mack-Cali Realty Corporation, October 15, 2013
Blackstone Invitation Homes Single Family Securitized Note Sale . Property Manager: THR Property Management, L. P., an affiliate of Blackstone Master Servicer: Midland Loan Services . Property Management Fee (9%) 4,125 4,125 Property Taxes 5,875 5,875