Transcription
Federal Equal Opportunity RecruitmentProgram PlanFiscal Year 2012
Table of ContentsExecutive SummaryIntroductionPurpose and ScopeLegal AuthorityDefinitionsEqual Employment Opportunity PolicyDesignation of ResponsibilityUnderrepresentation AnalysisRNO in Mission Critical OccupationsRNO in Three Next Largest Occupational SeriesGrade Cluster InformationSupervisory vs. Non-supervisory WorkforceDiversity at the Executive LevelFindingsBlacksHispanicsAsian/Pacific IslandersNative AmericansWomenTrend AnalysisOverall Workforce CompositionRNO in Mission Critical OccupationsRNO in Three Next Largest Occupational SeriesGrade-cluster ComparisonsSupervisory vs. Non-Supervisory WorkforceTrend Analysis SummaryGoals and StrategiesGoal OneGoal TwoGoal ThreeAppendix A – DefinitionsAppendix B – Relevant Civilian Labor Force CrosswalkAppendix C – Strategic Goals 426272829313233382
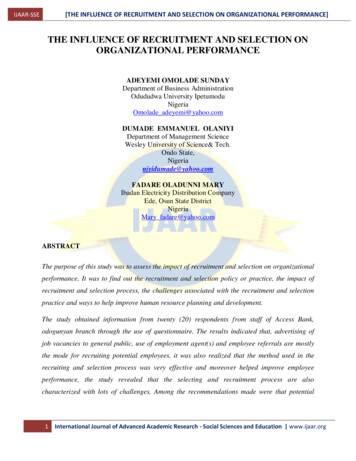
Executive SummaryThe National Archives and Records Administration (NARA) is committed to maintaining a diverseworkforce at all levels. Having a diverse workforce contributes directly to the achievement ofNARA’s mission by bringing a wide variety of perspectives and approaches to our work.Moreover, we recognize diversity as a catalyst for new ideas and innovation, helping us to solvenot only the problems of today but also the challenges of tomorrow.This Federal Equal Opportunity Recruitment Program (FEORP) Plan is our roadmap for how to recruitand retain a highly qualified diverse workforce. It outlines the basic policy, legal authority, andresponsibility for NARA’s FEORP Plan; provides data on our workforce and how it compares to both theFederal Civilian Workforce (FCW) and the Relevant Civilian Labor Force (RCLF); and identifies specificactions that NARA will undertake in the coming years to address areas where underrepresentation ofwomen and minorities exist in our workforce.As shown in Figure 1 below, representation for some groups – specifically, women and Blacks - comparefavorably to both the FCW and the RCLF. However, with the exception of these two groups, all othersare underrepresented at NARA when compared to the FCW. In particular, Hispanics are significantlyunderrepresented in NARA, comprising just 1.6 percent of the workforce as compared to the 7.7 percentof the FCW and 10.7 percent of the RCLF. Representation rates for Asian/Pacific Islanders and NativeAmericans are also below those in both the RCLF and the FCW.Figure 1NARA vs. Federal and Relevant Civilian Labor Workforce1NARA data provided by NARA’s Performance Measurement and Reporting System (PMRS); covers full-time permanent employees as ofOctober 27, 2011Federal Civilian Workforce (FCW.); covers full and part-time permanent employees, data sourced from Fedscope, June 2011, NationwideRelevant Civilian Labor Workforce (RCLF); covers full and part-time permanent employees, data sourced from Census EEO Tool, Nationwide13
Relative to NARA’s supervisory/non-supervisory and executive level workforce, minorities and womenare most underrepresented within the supervisory and executive level positions. While minoritiescomprise 32 percent of our non-supervisory workforce, they comprise only 18 percent of supervisorypositions and 6 percent of executive positions. Likewise, while women comprise 53 percent of our nonsupervisory workforce, they comprise only 45 percent of supervisory positions and 23 percent ofexecutive positions.To address these challenges, NARA has identified three multi-year strategic goals that together form thefoundation of our FEORP. These goals are:Ensure that FEORP goals are aligned with NARA’s Strategic Plan and Strategic Human CapitalPlan and integrated with workforce planning efforts;Expand the pipeline of women and minorities available for employment with NARA; andEnhance staff development opportunities that prepare staff for upper level positions.In support of these goals, we have identified 14 specific strategies that NARA will undertake in FiscalYear 2012 to enhance the representation of women and minorities at all levels. Our strategies focus onexpanding partnerships with minority-serving universities, education associations, and professionalorganizations; attending and networking at minority conferences and job fairs; encouraging the use ofdevelopmental assignments that provide on-the-job training opportunities for women and minorities; andensuring that our FEORP goals and strategies are fully aligned with NARA’s Strategic Human CapitalPlan and, by extension, NARA’s Strategic Plan.Progress against these goals and strategies will be assessed each year as part of our human capitalaccountability efforts and the U.S. Office of Personnel Management’s (OPM) annual FEORP and FederalHispanic Employment Plan (HEP) reporting requirements. In addition, this plan will be revised each yearto reflect NARA’s latest workforce demographics and updated strategies for addressingunderrepresentation at NARA.4
IntroductionThe National Archives and Records Administration is our national record keeper. An independentagency created by statute in 1934, NARA safeguards the records of all three branches of theFederal Government.Our job is to ensure continuing access to essential documentation and, in doing so, we serve a broadspectrum of American society. Genealogists and family historians; veterans and their authorizedrepresentatives; academics, scholars, historians, business and occupational researchers; publication andbroadcast journalists; Congress, the Courts, the White House, and other public officials; FederalGovernment agencies and the individuals they serve; state and local government personnel; professionalorganizations and their members; students and teachers; and the general public – all seek answers fromthe records we preserve.MissionThe National Archives and Records Administration serves American democracy by safeguardingand preserving the records of our Government, ensuring that the people can discover, use, andlearn from this documentary heritage. We ensure continuing access to the essentialdocumentation of the rights of American citizens and the actions of their government. Wesupport democracy, promote civic education, and facilitate historical understanding of ournational experience.VisionAs the nation’s record keeper, it is our vision that all Americans will understand the vital rolerecords play in a democracy, and their own personal stake in the National Archives. Ourholdings and diverse programs will be available to more people than ever before throughmodern technology and dynamic partnerships. The stories of our nation and our people are toldin the records and artifacts cared for in NARA facilities around the country. We want allAmericans to be inspired to explore the records of their country.5
We carry out our mission through a national network of archives and records services facilities stretchingfrom Washington, DC, to the West Coast, including Presidential libraries documenting administrationsback to Herbert Hoover. Additionally, we publish the Federal Register, administer the InformationSecurity Oversight Office (ISOO), and make grants for historical documentation through the NationalHistorical Publications and Records Commission (NHPRC). We preserve and make available, inresponse to hundreds of thousands of requests, the records on which the entitlements of citizens, thecredibility of Government, and the accuracy of history depend.In order to accomplish our mission and effectively represent the many customers we serve, NARArecognizes the need to recruit, retain, reward, and promote a highly qualified diverse workforce.Demographic research suggests that the future workforce talent pool will be much more diverse,including individuals of different genders, ages, races, ethnicities, and lifestyles. By effectivelyleveraging this human capital, we can increase the variety of available skills and knowledge in ourworkforce, thereby achieving greater mission success. Specifically, diversity recruitment initiatives canhelp NARA reduce turnover, improve retention and employee morale, and increase innovation.NARA’s commitment to diversity is reflected in our 2006 – 2016 Strategic Plan (“Preserving the Past toProtect the Future”). The Strategic Plan incorporates two goals, specifically 6.1 and 6.2, aimed atenhancing the competencies and diversity of our workforce:Strategic Goal 6We will equip NARA to meet the changing needs of our customers. 6.1 By 2016, 95 percent of employees possess the core competencies thatwere identified for their jobs. 6.2 By 2016, the percentage of NARA employees in underrepresentedgroups match their respective availability levels in the Civilian LaborForce (CLF).This Federal Equal Opportunity Recruitment Program Plan further emphasizes our commitment todiversity. It identifies specific objectives and strategies for eliminating underrepresentation of womenand minorities in NARA, and it provides a framework for aligning our strategic diversity recruitment andhuman capital goals with the vision and mission articulated in our Strategic Plan.6
PURPOSE AND SCOPEThe purpose of this plan is to govern the administration of NARA’s Federal Equal OpportunityRecruitment Program. . It outlines basic policy, legal authority and responsibilities. It further providesthe necessary analyses for identifying and correcting areas in which underrepresentation of minorities andwomen exist.The U.S. Office of Personnel Management (OPM) sets policy and provides guidance to Federal agencieson the development and administration of FEORP. OPM requires that agency FEORP plans cover thefollowing underrepresented groups: White females, Black males and females, Hispanic males andfemales2, Asian/Pacific Islander males and females, and Native American males and females.The FEORP applies to all positions in all pay plans, unless specifically exempt by statute.This plan is reviewed and updated on an annual basis.LEGAL AUTHORITYAs outlined in 5 U.S.C. 7201(b), “It is the policy of the United States to insure equal employmentopportunities for employees without discrimination because of race, color, religion, sex, or nationalorigin.”Further, as outlined in Executive Order 13171, “The head of each executive department and agency(agency) shall establish and maintain a program for the recruitment and career development ofHispanics/Latinos in Federal government.”OPM’s implementing regulations for these provisions are contained at 5 CFR 720, Subpart B – FederalEqual Opportunity Recruitment Program. Specifically, 5 CFR 720.205 requires each agency to “have anup-to-date equal opportunity recruitment program plan covering recruitment of positions at variousorganizational levels and geographic locations within the agency.”Pursuant to this policy, 5 U.S.C. 7201(c) requires: “That each Executive agency conduct a continuingprogram for the recruitment of members of minorities for positions in the agency to carry out the [antidiscrimination] policy set forth in subsection (b) in a manner designed to eliminate underrepresentation ofminorities in the various categories of civil service employment within the Federal service, with specialefforts directed at recruiting in minority communities, in educational institutions, and from other sourcesfrom which minorities can be recruited .”2Until 2010, agencies were also required to submit a separate Hispanic Employment Plan to OPM. However, in September 2010, OPM releaseda memo, “Subject: Tenth Annual Report to the President on Hispanic Employment” which requests that Hispanic Employment information besubmitted with the FEORP report in an effort to consolidate like reports. Complying with this request, NARA has integrated the analysis, goalsand strategies Hispanic employment into our FEORP plan.7
DEFINITIONSAppendix A contains definitions of commonly-used terms throughout this plan.EQUAL EMPLOYMENT OPPORTUNITY (EEO) POLICYIt is the policy of the National Archives and Records Administration to prohibit discrimination and toensure equal employment opportunity for all applicants and employees without regard to race, color,religion, sex, sexual orientation and genetics, national origin, age or disability.DESIGNATION OF RESPONSIBILITYA. The Chief Human Capital Officer (CHCO), is responsible for:1. Overseeing the planning and implementation of this plan;2. Communicating the FEORP plan to NARA’s managers and employees;3. Certifying that the FEORP plan exists and is current; and4. Submitting the annual FEORP report to OPM.B. The Talent Management Division (HT) within the Office of Human Capital is responsible for:1. Annually developing and updating the FEORP plan;2. Implementing the recruitment strategies and programs identified within the plan; and3. Preparing FEORP reports and responding to inquiries about program activities.C. The Staffing and Recruitment Branch (HTS) within The Office of Human Capital is responsiblefor:1. Conducting recruitment and hiring practices that align with the FEORP plan andpromote the advancement of women and minorities; and2. Providing advice and assistance to selecting officials when vacancies occur inunderrepresented occupations.D. The Office of Diversity and Inclusion (HD) recommends changes to programs and procedures toeliminate practices that act as barriers to the hiring and advancement of women and minorities.E. The Learning and Development Division (HL) is responsible for providing developmentalopportunities that will support the advancement of women and minorities.F. Hiring officials are responsible for conducting recruitment and hiring practices that align with thisplan and promote the advancement of women and minorities.8
Underrepresentation AnalysisTotal employment for NARA at the end of Fiscal 2011 was 2,7233. Table 1 shows the race andnational origin (RNO) and gender of our workforce as of October 7, 2011.When evaluating the composition of our workforce to determine if underrepresentation exists,NARA measures itself against two groups: the Federal Civilian Workforce and the Relevant CivilianLabor Force. The Federal Civilian Workforce is defined by the OPM as full and part-time permanentnon-military employees working in non-Postal Executive Branch agencies of the U.S. Government.Measuring ourselves against the FCW enables us to see how our workforce compares to other Federalagencies.Relevant Civilian Labor Force is defined as those occupations in the Civilian Labor Force (noninstitutionalized individuals 16 years of age or older, employed or unemployed, U.S. citizens and nonU.S. citizens) that are directly comparable or relevant to occupations at NARA. Appendix B contains alist of the 54 occupational groups that comprise NARA’s RCLF, cross-walked to their correspondingOPM occupational series. Measuring ourselves against the RCLF enables us to compare ourselvesagainst like occupations in the national labor market.Table 1Representation of Minorities and Women at NARARNO AND GENDEROverall total (includes White nonHispanics)MenWomenTotal BlacksMenWomenTotal HispanicsMenWomenTotal Asian/Pacific IslandersMenWomenTotal Native AmericansMenWomen3AGENCY 9.30.761.039.0Total employment includes full-time permanent staff onboard as of October 7, 2011.9
Table 2 compares NARA’s workforce to the Relevant Civilian Labor Force. Groups that areunderrepresented by comparison to the RCLF (the legal standard of comparison required by 5 CFR 720)are shown in red.Table 2RNO AND GENDEROverall total (includes White nonHispanics)MenWomenTotal BlacksMenWomenTotal HispanicsMenWomenTotal Asian/Pacific IslandersMenWomenTotal Native 0.54.85.710.76.24.53.71.91.71.4.70.7010
RNO IN MISSION CRITICAL OCCUPATIONSThe majority of NARA’s workforce (58.9 percent) holds one of three Mission Critical Occupations –Archivist in the GS-1420 occupational series, or Archives Specialist or Archives Technician in the GS1421 occupational series. Figures 2, 3 and 4 show the RNO and gender of NARA’s Mission CriticalOccupations.Figure 2Figure 3Figure 411
To provide a larger perspective on the composition of NARA’s workforce, Figures 5, 6 and 7 show theRNO and gender of the next three largest occupational series within the agency: the GS-1001 GeneralArts and Information series, GS-0343 Management and Program Analyst series, and GS-2210Information Technology Management series, respectively.Figure 5Figure 6Figure 712
GRADE CLUSTER INFORMATIONFigure 8 compares the RNO and gender of NARA’s workforce, by grade cluster, to that of the FederalCivilian Workforce.Figure 8Grade Cluster Information13
SUPERVISORY VS. NON-SUPERVISORY WORKFORCEThe following charts show the distribution of women and minorities in supervisory versus nonsupervisory positions at NARA.Figure 9Supervisory vs. Non-supervisory Workforce*Note Native American not shown (0% representation)14
DIVERSITY AT THE EXECUTIVE LEVELFigure 10 shows the distribution of women and minorities in executive level positions at NARA. NARAdefines executive level positions as positions classified under the Senior Level (SL), Senior ExecutiveService (SES), Administratively Determined (AD) or Executive (EX) pay schedule.Figure 10Executive Level RNO and Gender15
FindingsOur analysis shows that while representation rates of Blacks and women compare favorably toboth the FCW and the RCLF, Hispanics, Asian/Pacific Islanders and Native Americans areunderrepresented in NARA’s workforce. Underrepresentation is particularly acute amongHispanics, who comprise only 1.6 percent of NARA’s workforce. Native Americans arelikewise underrepresented at all grade levels and across four of NARA’s five largest occupational series.Representation rates for Asian/Pacific Islanders vary. For example, Asian/Pacific Islanders comprise sixpercent of NARA’s executive level positions; however, they are consistently underrepresented at all othergrade levels.Our analysis also shows that minorities and women are better represented in the non-supervisoryworkforce than in the supervisory workforce. Minorities comprise 32 percent of our non-supervisoryworkforce, and only 18 percent of our supervisory ranks; likewise, women comprise 53 percent of ournon-supervisory workforce and 45 percent of supervisory positions.Progress is needed in increasing the representation of women and minorities at the most senior levels ofNARA. As illustrated in Figure 10, minorities comprise just 6 percent of NARA’s executive levelpositions, and women comprise 23 percent of NARA’s executive level positions.Specific findings for each group are outlined below:BLACKSBlacks comprise 25.6 percent of NARA’s total workforce, exceeding their representation in the FCW andRCLF by 7.7 percent and 15.1 percent respectively. Representation rates for Blacks exceed the FCWacross all grade levels, except at the GS 13-15 levels where representation rates are somewhat lower thanthe FCW. Representation rates for Blacks declined in FY11 in three of NARA’s five largest occupationalseries; GS-1421 (Archives Technician), GS-1001 (General Arts and Information) and the GS-2210(Information Technology Management) series.NARA’s greatest challenges regarding the representation of Blacks are at the supervisory and executivelevels. Blacks comprise 28.7 percent of NARA’s non-supervisory workforce, but only 15.2 percent ofsupervisory positions. Moreover, Blacks are not represented at all among NARA’s executive levelpositions. It is encouraging to note, however, that there was a 1.2 percent increase in representation (14 to15.2 percent) of Blacks at the supervisory level from last year.16
HISPANICSHispanics comprise 7.7 percent of the Federal workforce and 10.7 percent of the RCLF. However,Hispanics represent only 1.6 percent of NARA’s total workforce, making them the most underrepresentedgroup at the agency. Hispanics are underrepresented at all grade levels, with the most significantunderrepresentation occurring at the GS 9-12 levels with a difference of 7.6 percent when compared tothe FCW.Hispanics are underrepresented across NARA’s five largest occupational series when compared to theRCLF. However, when compared to FCW, Hispanics fare slightly better in the GS-1421 occupationalseries – exceeding the FCW by .1 percent.Hispanics comprise .18 percent of NARA’s non-supervisory workforce and are represented at a rate of 1percent within NARA’s supervisory positions. Hispanics are not represented at all among NARA’sexecutive level positions.NARA’s greatest challenge in recruiting Hispanics continues to be the exceedingly small number ofHispanics studying in the fields of archives, history, library and information science, and social science –the areas of study from which the majority (58.9 percent) of NARA’s workforce is based. Of theapproximate 200,000 undergraduate and graduate degrees conferred in the areas of library andinformation science, social science or history in 2008 - 2009, only 0.86 percent was conferred toHispanics4.ASIAN/PACIFIC ISLANDERSAsian/Pacific Islanders represent 2.5 percent of NARA’s workforce, as compared to 5.5 percent of theFederal workforce and 3.7 percent of the RCLF. In comparison to FY10, representation of this group hasincreased by .4 percent. Representation rates vary across NARA’s five largest occupational series.Within the GS-1421 occupational series, Asian/Pacific Islanders slightly exceed both the FCW andRECLF. Within the GS-1001 series, Asian/Pacific Islanders are only slightly underrepresented whencompared to the RCLF, but significantly more underrepresented when compared to the FCW. Within theGS-0343 series, Asian/Pacific Islanders exceed the FCW representation by .77 percent but areunderrepresented by .47 percent when compared to the RCLF. This however, is an improvement overFY10 when Asian/Pacific Islanders were not represented all within this occupational series. Asian/PacificIslanders also continue to exceed both the FCW and the RCLF within the GS-2210 series.Although Asian/Pacific Islanders represent only 1.7 percent of supervisory positions at NARA, they arethe only minority group represented within NARA’s executive ranks – representing 6 percent of thatworkforce.4National Center for Education Statistics, 2008-2009, Tables 297 and 300. 2008 – 2009 is the most recent year for which data is available.17
NATIVE AMERICANSNative Americans comprise 0.7 percent of NARA’s workforce (an increase of .10 percent over FY10), ascompared to 1.8 percent of the FCW and 1.4 percent of the RCLF. They are underrepresented at all gradelevels and across four of NARA’s five largest occupational series. The exception is the GS-1420 series,where Native Americans comprise .60 percent of the workforce (an increase of .30 percent over FY10),exceeding the FCW by the same amount. Native Americans do not hold any supervisory or executivelevel positions at NARA.As with Hispanics, one of the challenges NARA faces in recruiting Native Americans is the small numberof Native Americans majoring in fields of study that are applicable to NARA’s Mission CriticalOccupations. Only .80 percent of all undergraduate and graduate degrees conferred in 2008 - 2009 wereconferred to Native Americans majoring in library and information science, social science or history.5WOMENWomen represent 52.3 percent of NARA’s workforce, exceeding their representation in the FCW andRCLF by 8.6 and 5.5 percent respectively.Women comprise 50.9 percent of NARA’s MCOs, an increase of 2.9 percent over FY10. However,women exceed the RCLF for NARA’s three other largest occupational series – the GS-1001 series, GS0343 series, and GS-2210 series, and the FCW in two of those series (GS-1001 and GS-2210).NARA leads the FCW in female representation at the GS 9-12 and GS 13-15 levels. However, womenare underrepresented at the GS 1-4 and GS 5-8 levels. This is an improvement over FY10 when the FCWled NARA in female representation at all but the GS 5-8 level. Women comprise 53 percent of the nonsupervisory workforce and 45 percent of supervisory positions. Women comprise 23 percent of NARA’sexecutive positions, a decrease of 3 percent when compared to FY10.5National Center for Education Statistics, 2008-2009, Tables 297 and 300. 2008 – 2009 is the most recent year for which data is available.18
Trend AnalysisThis section provides a snapshot of our minority employment trends over the past three fiscal years(2009 – 2011). Specifically, we examined the composition of NARA’s overall workforce, RNOand gender of our Mission Critical Occupations (MCOs), RNO and gender of NARA’s next threelargest occupational series (GS-1001 General Arts and Information series, GS-0343 Managementand Program Analysts series, and GS-2210 Information Technology Management series), grade-clusterdata, and the composition of our supervisory/non-supervisory workforce as well as our executive levelpositions.These areas are discussed in detail below.NARA’s Workforce CompositionOverall minority representation has remained relatively stable over the three-year period, as shown inFigure 11 below.Representation of Blacks within NARA’s workforce has declined slightly each year - down 1.7 comparedto FY2009 and 1.0 percent compared to FY2010. Despite this decrease, Blacks continue to exceed boththe FCW and RCLF over the three-year analysis period.Hispanic representation had remained consistent at 1.4 percent for FY2009 and FY2010. In FY11 therewas slight increase (up .2 percent) to 1.6 percent in FY11. Representation of Asian/Pacific Islanders hasshown the greatest improvement, with slight increases each year over the three-year period.Native American representation has increased slightly each year, for a net increase of .2 percent over thethree-year analysis period.Figure 1119
Mission Critical Occupations (MCOs)With the majority of NARA’s workforce (58.9 percent) being employed in one of three MCOs, trendanalysis in this area is especially critical. With the exception of Blacks, minority and femalerepresentation in MCOs have either remained the same or increased slightly each year.As shown in Figure 12 below, representation of Blacks declined from 30.9% in 2009 to 30.1% in 2010and 28.6% in 2011, while all other races and women either stayed the same or slightly increased at theend of the analysis period. While we are cognizant of the decline in Black representation levels, we alsorecognize that we continue to considerably exceed the representation of Blacks in these occupations whencompared to the RCLF – by an average of 24.5 percent over the three year period.Figure 1220
Next Three Largest Occupational SeriesThe next three largest occupational series at NARA consist of the GS-1001 General Arts and Informationseries, GS-0343 Management and Program Analyst series and the GS-2210 Information TechnologyManagement series. Figures13-15 provides an overview of the data.GS-1001, General Arts and Information Series – Representation of women, Hispanics, and NativeAmericans has not changed. Representation of Blacks and Asian /Pacific Islanders has declined slightly.Figure 1321
GS-0343, Management and Program Analyst Series - When comparing NARA’s workforce in theManagement and Program Analyst series (GS-0343), Native Americans are the most severely impactedwith no representation during the three-year analysis period. Representation of all other groups havecontinued to increase, with the greatest growth reflected in representation of Asian/Pacific Islanders, whohad no representation in FY09 and FY10 to a 4.8% increase in FY11.Figure 14GS-2210, Information Technology Management Series - Over the course of the three-year analysisperiod, Hispanics have had no representation in this occupational series. There has been a slight decreasein representation amongst Blacks and Women. Representation of Asian/Pacific Islanders, on the otherhand, maintained representation from FY09 to FY10 at 15.2% and increased by 1.1 percent in FY11.Figure 1522
NARA’s Grade-Cluster DataThe following figures (16-19) compare the grade cluster data over the course of the three-year analysisperiod. Overall minority and female representation across the grade clusters has fluctuated slightly overthe course of three years. Representation of Blacks in the GS 1-4 and GS 9-12 levels saw the mostdeclines.Figures 16-19 Grade Cluster InformationFigure 16Figure 17Figure 18Figure 1923
NARA’s Supervisory/Non-supervisory and Executive Level WorkforceA review of the data relative to minority representation in supervisory positions and non-supervisorypositions reveals mixed results, although Black representation increased and Asian/Pacific Islanderrepresentation decreased in both the supervisory and non-supervisory workforce (see Figures 20-22).As shown in Figure 22, there has been no representation of Blacks, Hispanics and Native Americans atthe executive level over the three-year analysis period. The representation of Asian/Pacific Islanders hasremained stable. Representation of women has fluctuated from 24.2 percent in 2009 to 26 percent in 2010and 23 percent in 2011. While these increases are hopeful, there is still room for improvement. As wemove forward it will important to communicate these trends and findings and develop strategies toincrease representation of minorities across the board at executive levels.Figures 20 - 22Supervisory/Non-supervisory and Executive Level WorkforceFigure 2024
Figure 21Figure 2225
Trend Analysis SummaryWhile the 2009-20110 data reveals that fluctuations of minorities and women within NARA’s workforceover the past three years have occurred, overall progress has been negligible. To further analyze NARA’sworkforce, data was also reviewed for Fiscal Year 2008. This additional d
accountability efforts and the U.S. Office of Personnel Management's (OPM) annual FEORP and Federal Hispanic Employment Plan (HEP) reporting requirements. In addition, this plan will be revised each year to reflect NARA's latest workforce demographics and updated strategies for addressing underrepresentation at NARA.